Baritones of the ASX deliver the most beats
At the time of writing (87 companies had reported), there had been fewer misses than beats. In last week’s Vector Insights we suggested that two markets operate in Australian equities:
Results so far highlight this dichotomy, with mega-caps such as CBA and BHP not surprising markets, while smaller-sized companies like Suncorp and AGL exceeding expectations.
Much of the upside hasn’t been in the mega-caps that tend to dominate Australian equity portfolios. Mid-caps have been a bright spot, and the earnings outlook continues to support an allocation that diversifies away from Australian mega-caps.
Chart 1: S&P/ASX 200 February 2025 earnings result split
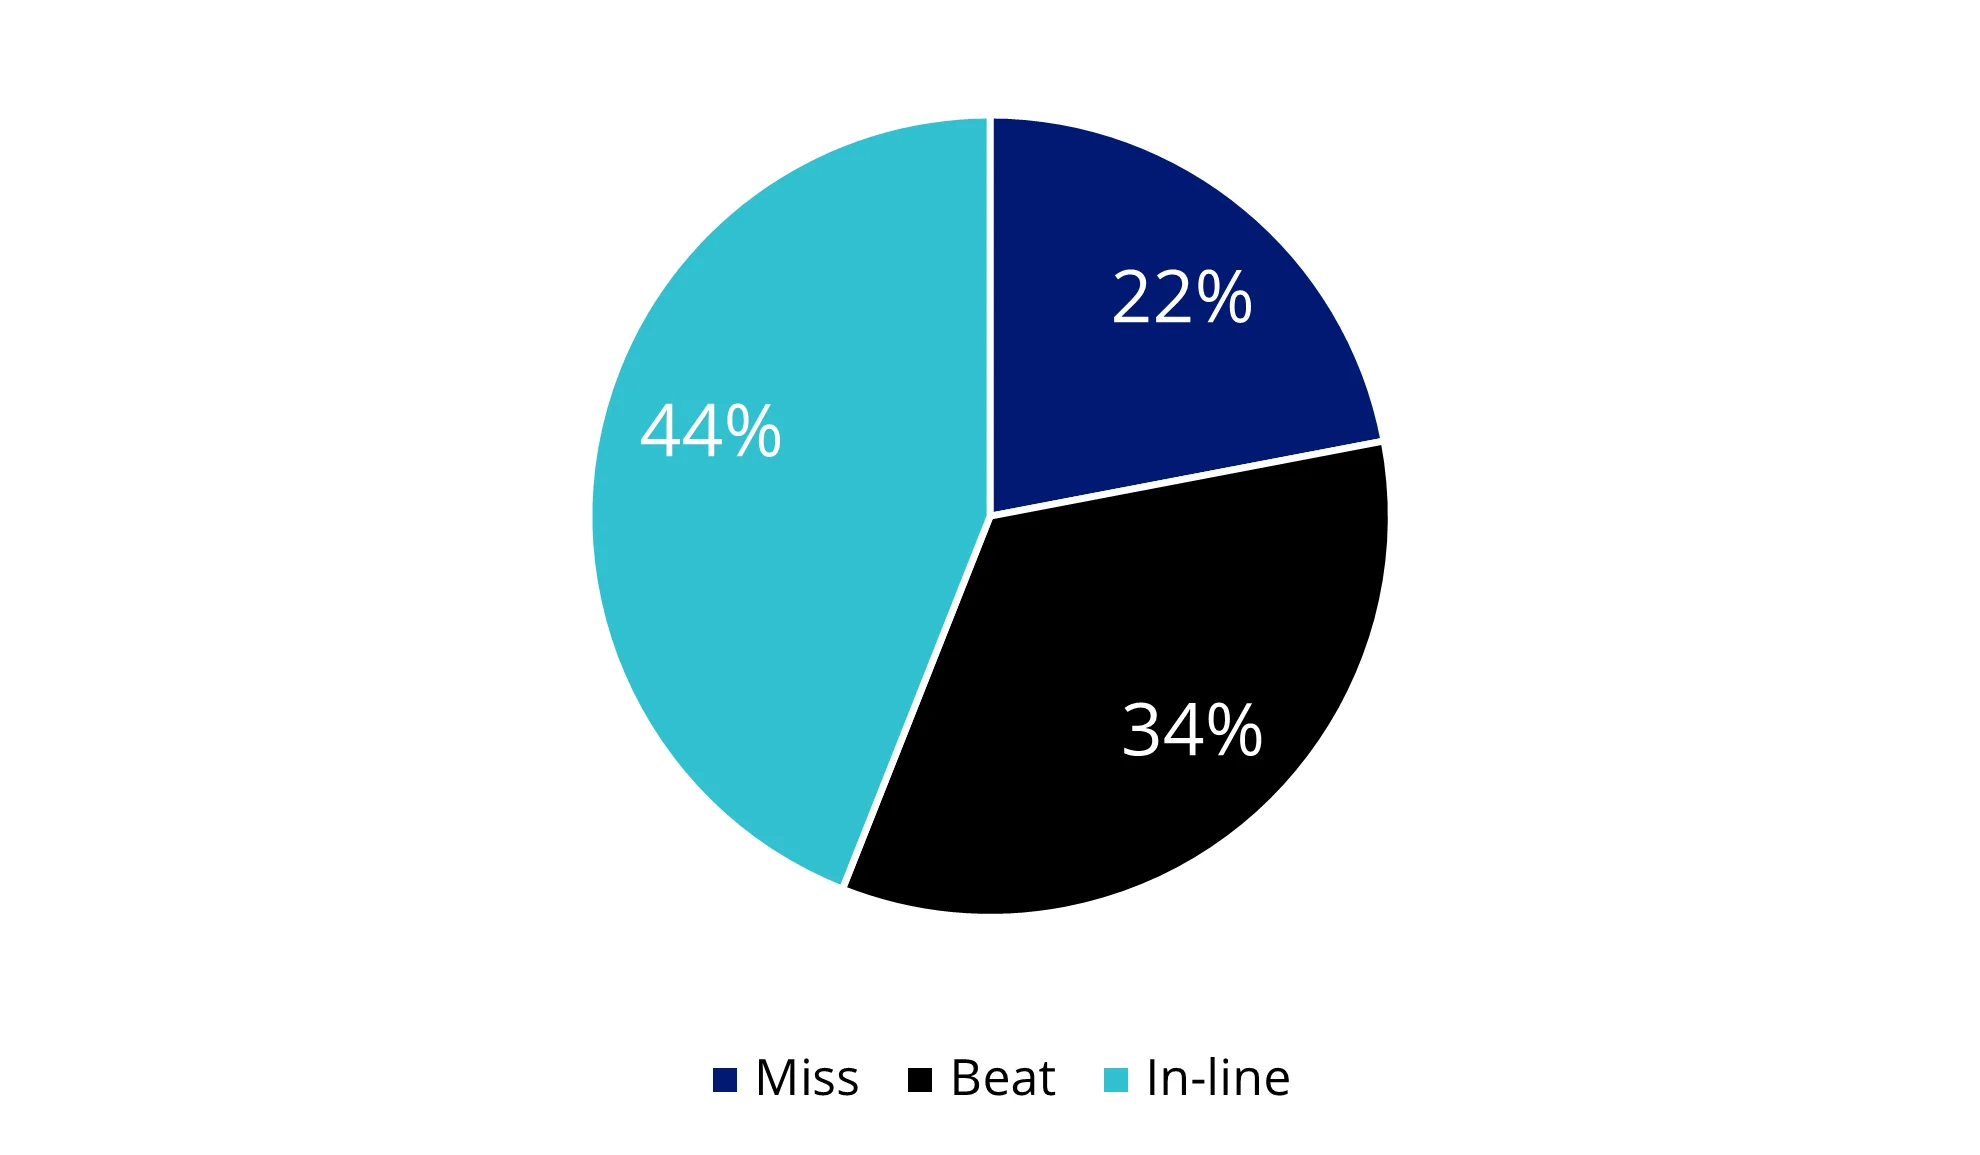
Source: Bloomberg, Index Weighted, as at 21 February 2025, ±2.5% range for beat/miss.
The spread of these results highlights that the beats are outside the largest companies. This means the S&P/ASX 200, which weights companies by market capitalisation, does not offer meaningful exposure to the highest-performing companies – unlike an equal-weight approach, such as VanEck Australian Equal Weight ETF (MVW), where company holdings are weighted equally. Another Australian equity strategy that outperforms the S&P/ASX 200 for this earnings season is one of that focuses on the Australian mid-cap market.
Chart 2: Market-weighted EPS surprise February 2025 earnings results
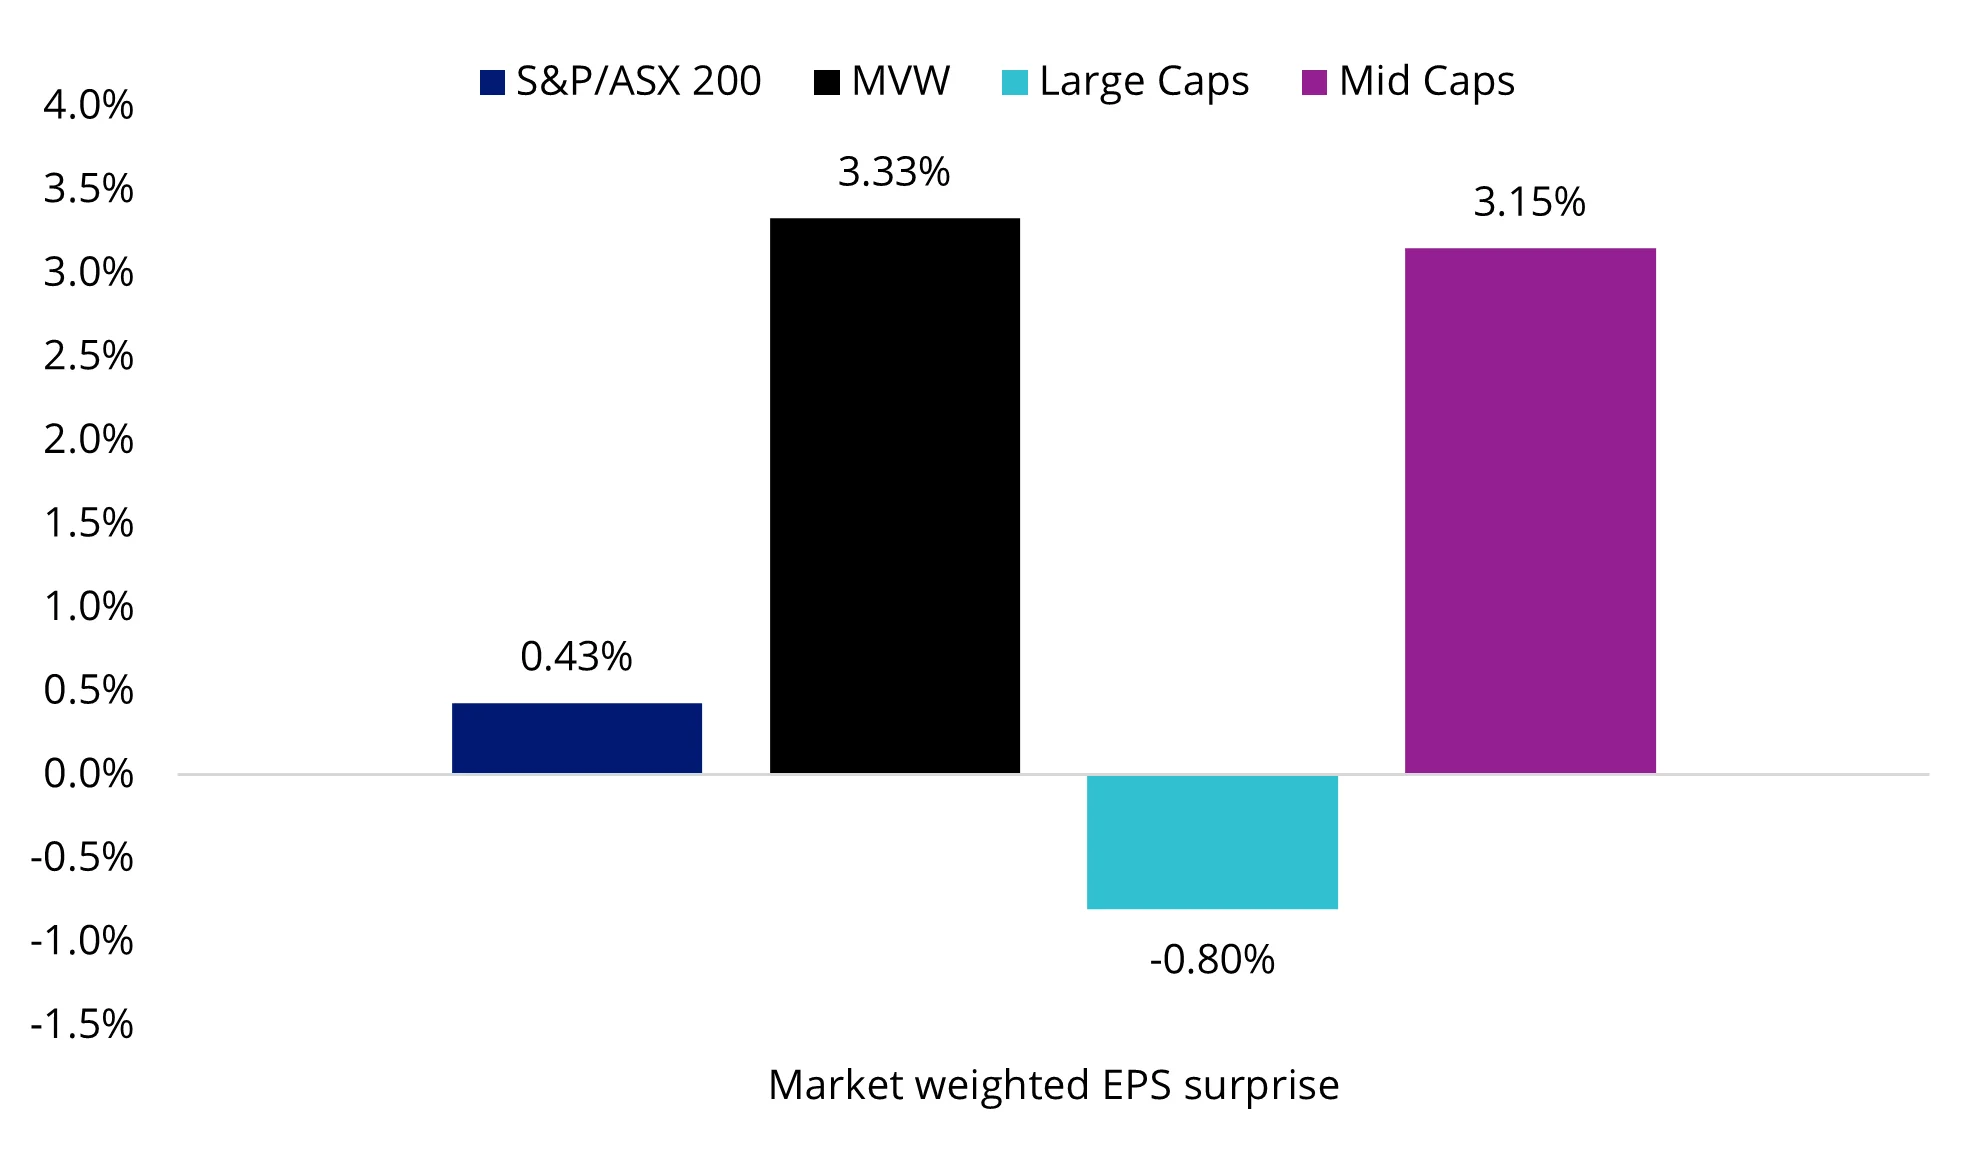
Source: Bloomberg, 21 February 2025, Large Cap as S&P/ASX 20, Mid Cap as S&P/ASX Mid Cap 50, The ASX index series is shown for comparison purposes as it is the widely recognised benchmark series used to measure the performance of the Australian equities market. It weights companies by market capitalisation. MVW tracks an index (MVIS Australia Equal Weight) that measures the performance of the largest and most liquid ASX-listed companies, weighted equally at rebalance. MVW’s index has a different amount of companies and different industry allocations than the S&P/ASX indices.
The results have had analysts updating their price targets with mid-caps recording the highest average upward price target revision.
Chart 3: 12-month consensus price target revisions during earnings season
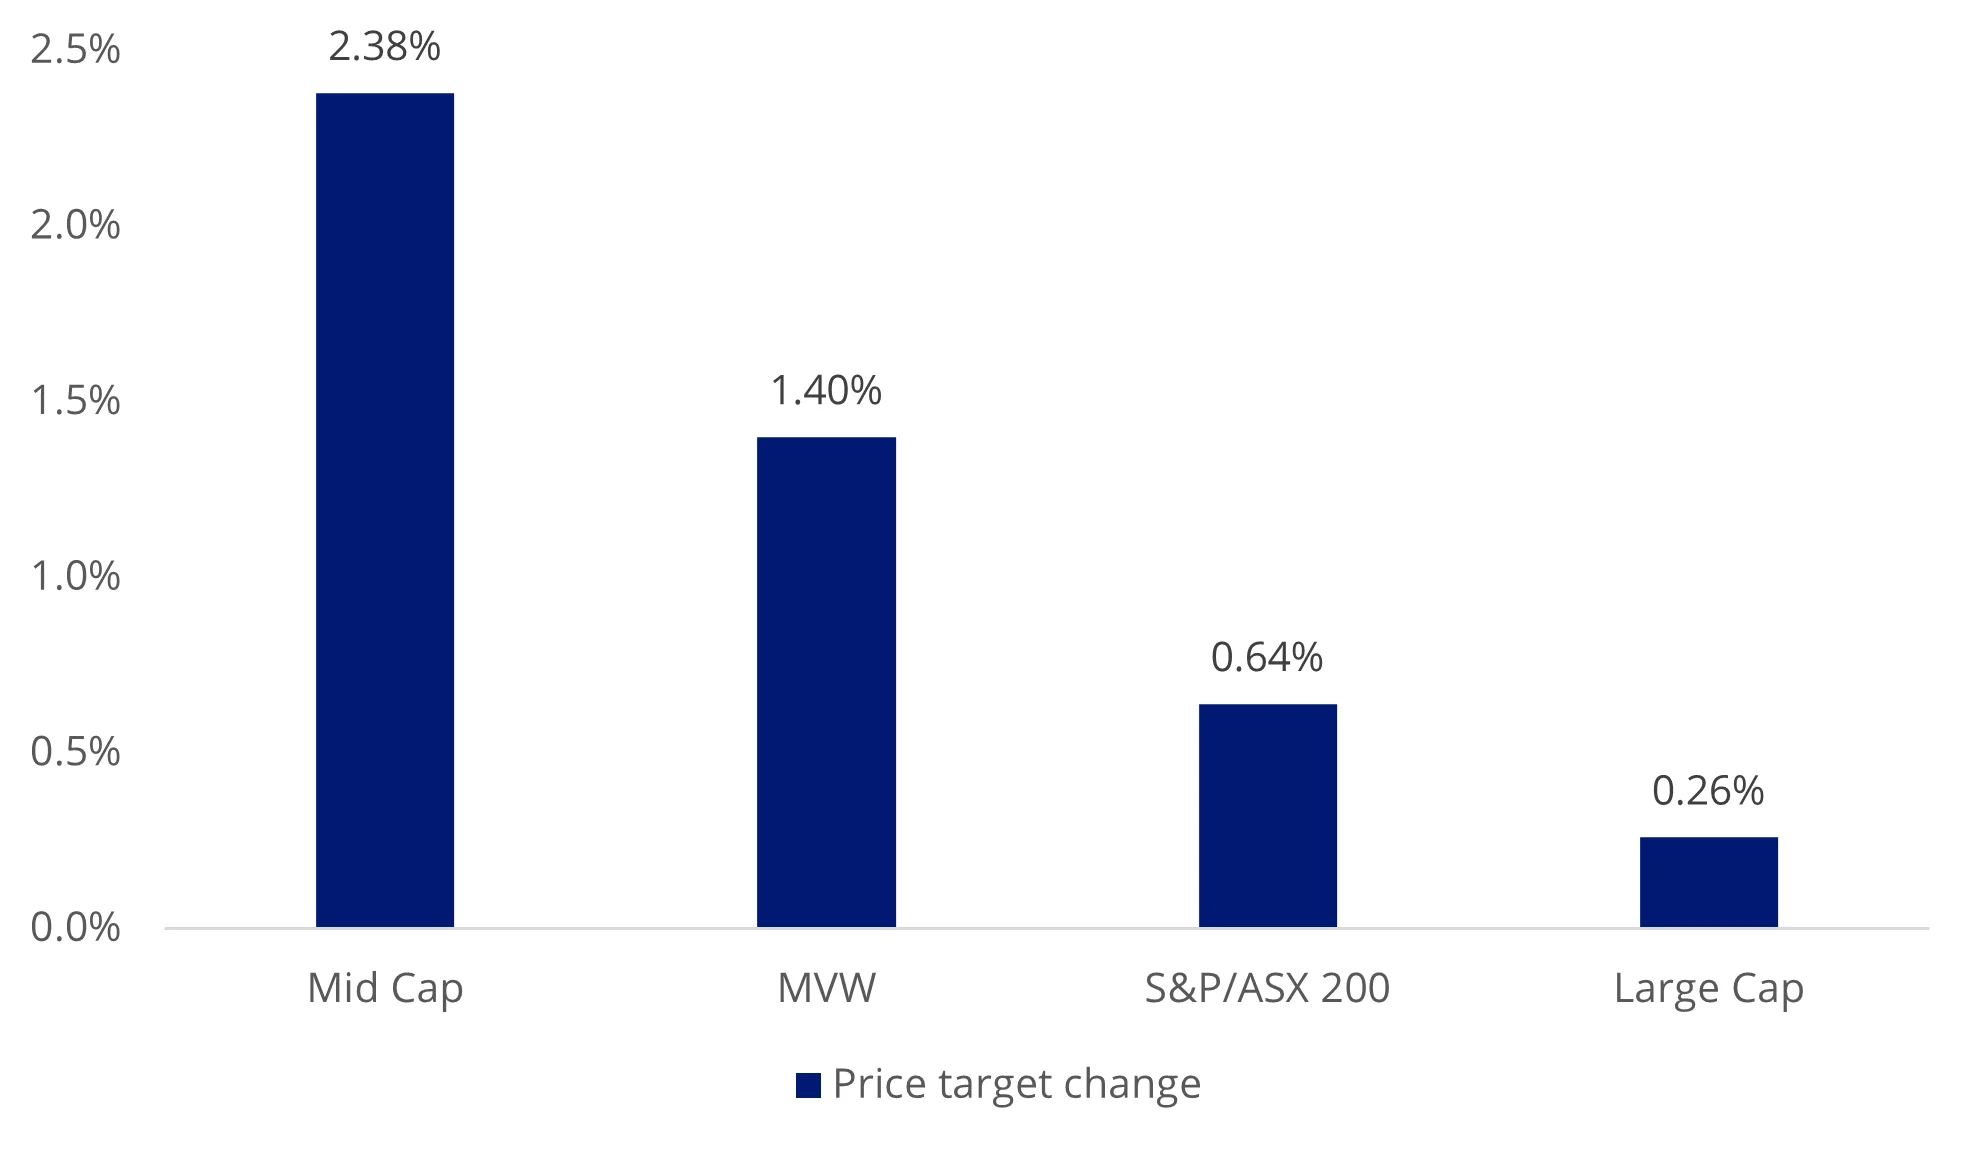
Source: Bloomberg, 31 January to 20 February 2025, Large Cap as S&P/ASX 20, Mid Cap as S&P/ASX Mid Cap 50. The ASX index series is shown for comparison purposes as it is the widely recognised benchmark series used to measure the performance of the Australian equities market. It weights companies by market capitalisation. MVW’s index (MVIS Australia Equal Weight) measures the performance of the largest and most liquid ASX-listed companies, weighted equally at rebalance. MVW’s index has a different amount of companies and different industry allocations than the S&P/ASX indices.
And looking further ahead, the estimated 3 to 5 years earnings per share (EPS) growth shows a similar story.
Chart 4: Estimated 3 to 5 years earnings (EPS) per share growth
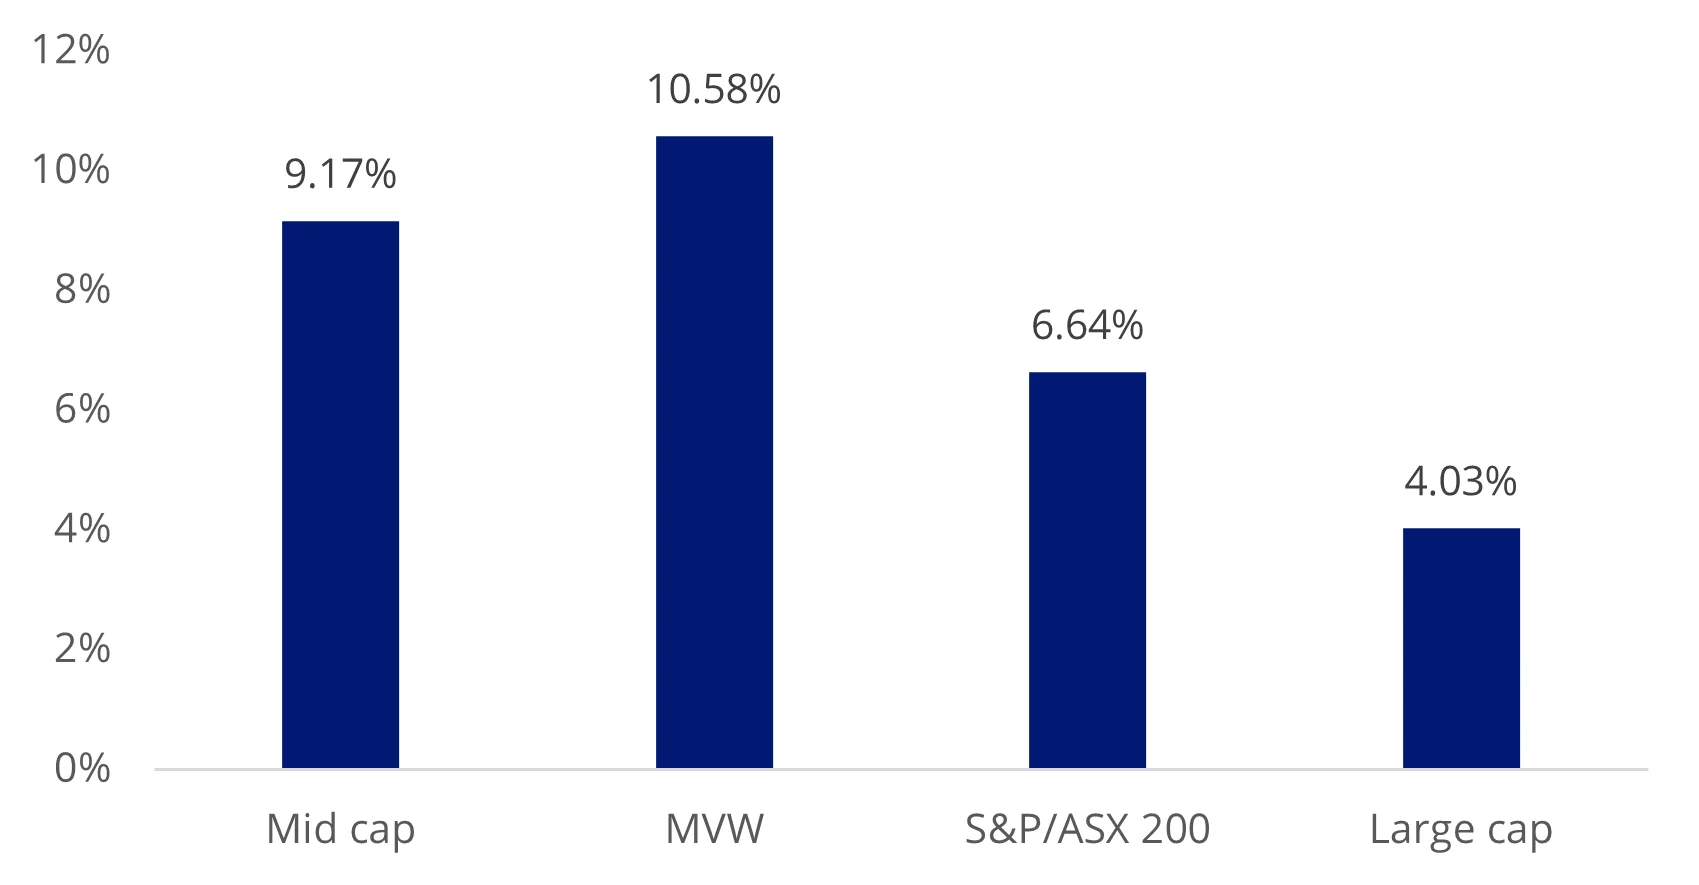
Source: FactSet, 20 February 2025, Large Cap as S&P/ASX 20, Mid cap is S&P/ASX MidCap 50. The ASX index series is shown for comparison purposes as it is the widely recognised benchmark series used to measure the performance of the Australian equities market. It weights companies by market capitalisation. MVW’s index (MVIS Australia Equal Weight) measures the performance of the largest and most liquid ASX-listed companies, weighted equally at rebalance. MVW’s index has a different amount of companies and different industry allocations than the S&P/ASX indices.
While these are future projections, this suggests a bigger allocation towards the stocks that are not mega caps, where there is limited room for growth. Having greater exposure to companies outside of the ASX top 10 could be beneficial for Australian equities investors going forward.
We think the earnings results support consideration of:
- VanEck’s Australian Equal Weight ETF (MVW): a passive Australian equities approach that weights each constituent equally, rather than weighting based on company size. The result is a portfolio that is underweight the mega-caps of the Australian market and has greater exposure to those companies outside the mega-caps.
- The VanEck S&P/ASX MidCap ETF (MVE): the only ETF tracking the S&P/ASX MidCap 50 Index;
- Our newest ASX listing, the VanEck Australian Long Short Complex ETF (ALFA): an actively managed, unconstrained high, conviction Australian equity portfolio that targets long and short positions by utilising sophisticated computations and programmed learning, with the aim of outperforming the S&P/ASX 200 Accumulation Index over the medium to long term, after fees and other costs.
Key risks: An investment in MVW and MVE carries risks. These include risks associated with financial markets generally, individual company management, industry sectors, fund operations and tracking an index. See the PDS for details. An investment in ALFA carries risk. The Fund is considered to have a higher investment risk than a comparable fund that does not engage in short selling and leverage. Investors should actively monitor their investment as frequently as daily to ensure it continues to meet their investment objectives. Risks associated with an investment in the fund include those associated with short selling risk, leverage risk, prime broker risk, counterparties risk, concentration risk, operational risk and material portfolio information risk. See the ALFA ETF PDS and TMD for more details and read the TMB attributes to help determine if the fund is right for you.


Published: 25 February 2025
Any views expressed are opinions of the author at the time of writing and is not a recommendation to act.
VanEck Investments Limited (ACN 146 596 116 AFSL 416755) (‘VanEck’) is the issuer and responsible entity of all VanEck exchange traded funds (Funds) listed on the ASX. This is general advice only and does not take into account any person’s financial objectives, situation or needs. The product disclosure statement (PDS) and the target market determination (TMD) for all Funds are available at vaneck.com.au. You should consider whether or not any Fund is appropriate for you. Investments in a Fund involve risks associated with financial markets. These risks vary depending on a Fund’s investment objective. Refer to the applicable PDS and TMD for more details on risks. Investment returns and capital are not guaranteed.
The S&P/ASX MidCap Index (the Index”) is a product of S&P Dow Jones Indices LLC or its affiliates (“SPDJI”) and ASX Limited (“ASX”) and licensed for use by VanEck. S&P® is a registered trademark of Standard & Poor’s Financial Services LLC (“S&P”); Dow Jones® is a registered trademark of Dow Jones Trademark Holdings LLC (“Dow Jones”); and these trademarks have been licensed for use by SPDJI and sublicensed by VanEck. The Fund is not sponsored, endorsed, sold or promoted by SPDJI, Dow Jones, S&P, their respective affiliates, or ASX and none of them makes any representation regarding the advisability of investing in the Fund. Such parties do not accept liability for any errors, omissions, or interruptions of the Index and do not give any assurance that the Fund will accurately track the performance of the index or provide positive investment returns. Inclusion of a security within the index or Fund is not a recommendation by any party to buy, sell, or hold such security.
MVIS Australia Equal Weight Index (‘MVIS Index’) is the exclusive property of MV Index Solutions GmbH based in Frankfurt, Germany (‘MVIS’). MVIS is a related entity of VanEck. MVIS makes no representation regarding the advisability of investing in the Fund. MVIS has contracted with Solactive AG to maintain and calculate the MVIS Index. Solactive uses its best efforts to ensure that the MVIS Index is calculated correctly. Irrespective of its obligations towards MVIS, Solactive has no obligation to point out errors in the MVIS Index to third parties.