Australia, the lucky country again?
Journalist Donald Horne once proclaimed Australia to be ‘the lucky country’. Horne’s intent was to comment that, while other industrialised nations created wealth using clever means such as technology and other innovations, Australia did not. Rather, Australia’s economic prosperity was largely derived from its remote geographical location and rich natural resources.
Will the luck run out?
Lucky is an apt word to describe Australia’s winning streak, dodging a deep recession during the tech wreck of 2001 and the global financial crisis of 2008. And, just like its previous great escapes, Australia could be about to get lucky again, this time by potentially avoiding a global recession within the next 24 months.
Recession bells are starting to toll as central banks around the world aggressively increase policy rates in pursuit of containing multi-decade high inflation. Russia’s invasion of Ukraine and corresponding western sanctions have seen energy prices skyrocket particularly in Europe, adding to investor angst. However, the outlook for Australia is somewhat rosier for several reasons. So, is Australia about to get lucky again, or is our luck finally about to run out?
Prior to the COVID-19 recession, Australia held the longest streak of avoiding recession in 28 years among developed nations. The nation avoided a recession during the 1997 Asian financial crisis, dot com bubble, global financial crisis and eurozone crisis. It was also the only developed nation to avoid a recession during the GFC, defined as two consecutive periods of negative gross domestic product (GDP) growth, and why Australia is often referred to as the ‘lucky country’.
How did Australia avoid a GFC recession? There were three contributing factors outlined by the Reserve Bank of Australia (RBA).
- Low Australian banking exposure to the US housing market and US banks
- Subprime and other high-risk loans were only a small share of lending in Australia
- Chinese demand for Australian resources buoyed economic activity
This time round, Australia’s fortunes could mean the nation avoids a recession. Here is why.
1. Headline inflation
Australia has lower headline inflation than the US and many European nations. This means the task of the RBA containing high inflation without triggering a recession, aka ‘hard landing’ relative to other nations less challenging. The majority of Australian mortgages are variable which means cash rate increases immediately impact budgets and corresponding spending. This allows the RBA to pivot faster based on changes in inflation. US and European mortgages are majority fixed. Policy rate increases delay the need for consumers and businesses to refinance, resulting in a time lag on impacting spending patterns. The US Federal Reserve is effectively throwing darts blindfolded via its aggressive policy rate stance, balancing economic growth and inflation.
G10 Inflation YoY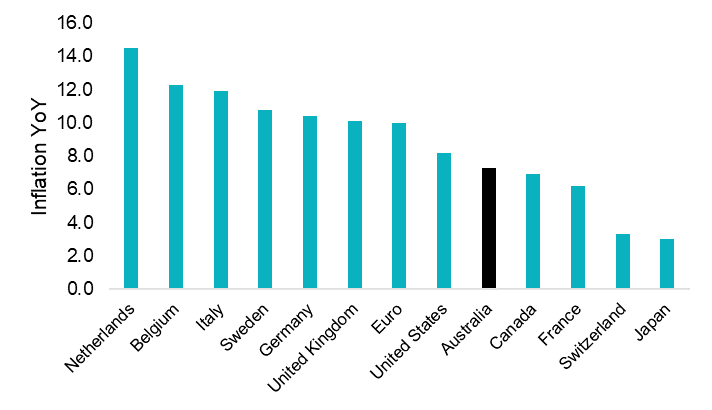
Source: Bloomberg
2. Wage growth
Wage growth in Australia is less pronounced. You may have heard of the Phillips curve which states that changes in unemployment and inflation are negatively correlated. This implies that a level of labor retrenchment i.e. the increase in unemployment rate required to slow wage growth, cost inflationary pressures on business and ultimately consumer costs lower. The Australian government is increasing the number of permanent migration visas available in 2022-23 from 160,000 to 195,000 places. Net migration will help cool the tight labor market and lower wage cost pressures.
G10 Wage Growth YoY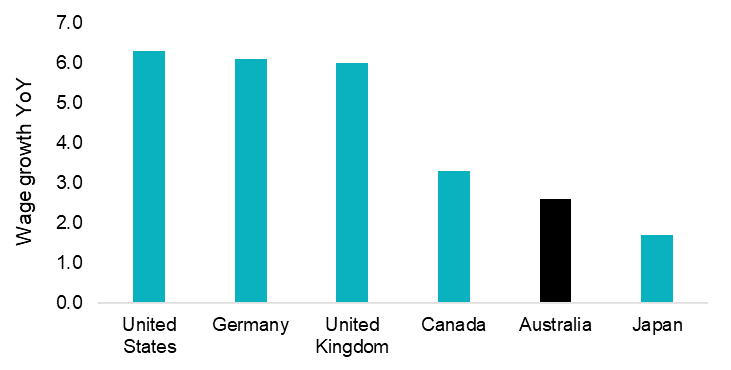
Source: Bloomberg
3. RBA Pivot
The RBA is prioritising growth in 2023 over containing inflation between the 2-3% target. RBA increased their Australian CPI forecast for 2023 from 2.75% to 4.75% over the past 4 quarters. In contrast, the Fed is resolute on driving down inflation to 2% despite the probability of a US recession increasing for 2023.
Central bank forecasts for inflation and GDP growth in 2023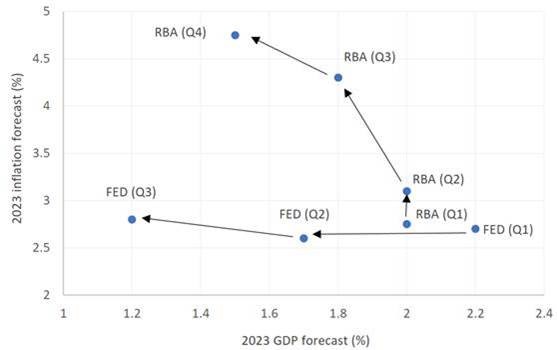
Source: RBA, Federal Reserve
4. Major commodities exporter
Australia is a major commodities exporter with abundant natural resources relative to its own needs. Natural gas for example is in short supply in Europe due to the low supply from Russia, contributing to high energy costs in the region. Australia is one of the largest exporters of LNG, putting downward pressure on energy costs domestically. The federal government is also considering implementing export caps on some energy commodities to safeguard Australian supply.
Governments also often turn to infrastructure spending as a fiscal measure to expand growth in an economic downturn. Chinese President Xi Jinping has cited infrastructure spending as the government’s main lever to rescue economic growth. The Australian resources sector could be a major beneficiary of this investment, as it was during the Global Financial Crisis (GFC).
At the end of 2009, China’s year on year infrastructure investment sky rocketed to 54 per cent, from 10 per the previous year. The spending helped resurrect economic growth during the lows of the GFC. As a result, Australian commodity export prices soared, and mining as a percentage contribution of Australian GDP jumped, boosting Australian resource companies.
China infrastructure investment growth YoY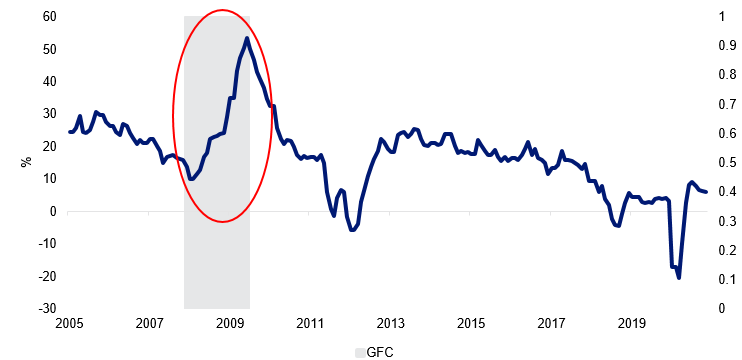
Source: Bloomberg
Bond markets and the Organisation for Economic Co-operation and Development (OECD) are optimistic on Australia’s economic outlook relative to other G10 nations. The Australian government 10 year bond yield is higher than the 2 years whereas the US government bond yield curve is inverted. Yield inversion between the 2 and 10 year has historically been a leading indicator for an impending recession in the next 6 to 18 months. Australian projected real GDP growth for 2023 is expected to be one of the highest according to the OECD.
10 Year less 2 year government bond yields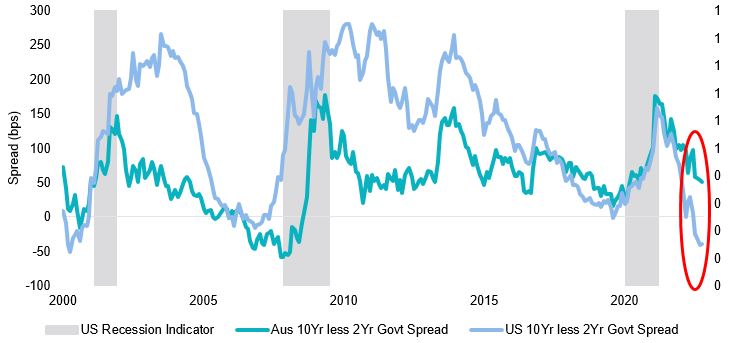
Source: Bloomberg
OECD G10 2023 Real GDP Forecast YoY
Source: Bloomberg
The rosier outlook of Australia’s economy improves the case for investing in Australian equities. VanEck has previously outlined the challenges of investing in Australian equities due to high stock and sector concentration by market capitalisation. The top 10 holdings in the market benchmark S&P/ASX 200 accounts for 50% of exposure and is overweight financials and resources relative to other major market country indices. These challenges also impact the efficacy of factor investing as outlined in VanEck’s white paper The Australian Concentration Conundrum. However, there is an alternative way to invest in a diversified portfolio of Australian equities that has historically achieved excess returns over the long term and is supported by academic research – Equal weighting.
Equal weighting, as the names suggests, gives the same importance to each stock in a portfolio, regardless of a company’s size. The strategy decreases stock and sector concentration by increasing exposure to smaller companies.
Sector weight comparison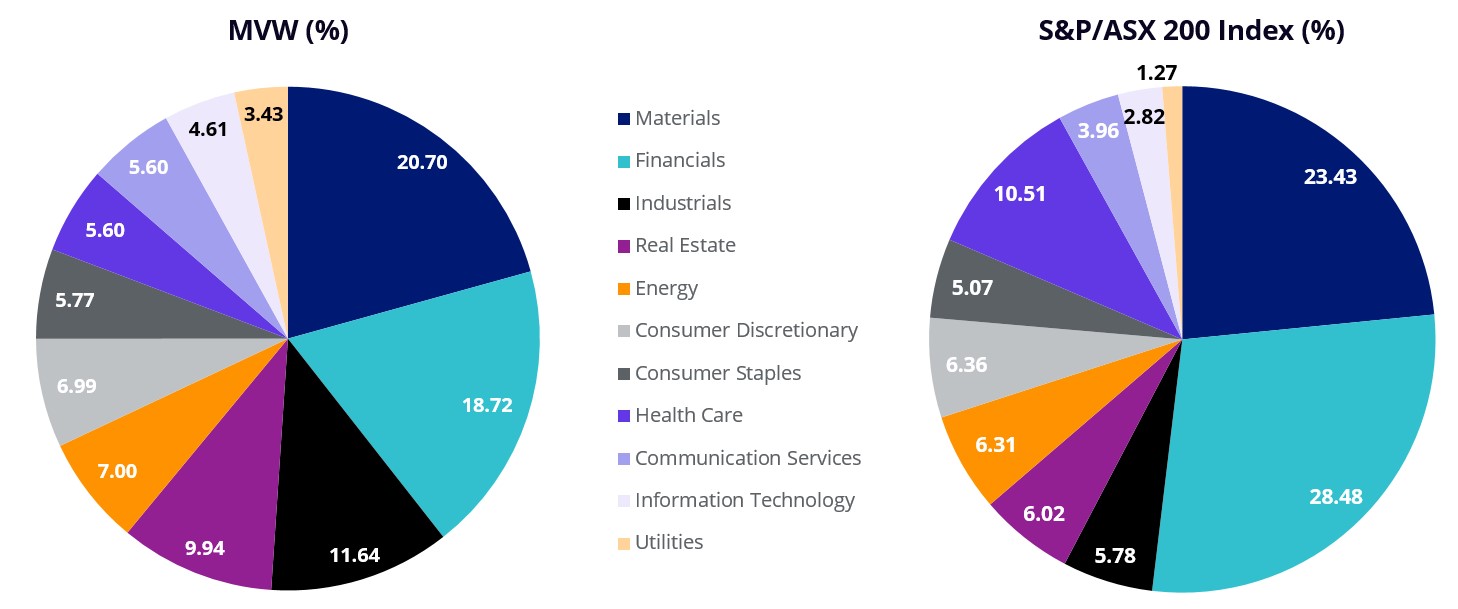
Source: FactSet as at 31 October 2022
Equally weighted portfolios have historically outperformed their market capitalisation counterparts over the long term. There have been a number of studies discussed in detail in the white paper above which support this and it is demonstrated below.
The chart below shows the performance of MVW Index, against the S&P/ASX 200.
Cumulative performance of MVW Index versus S&P/ASX 200
Growth of hypothetical $10,000 investment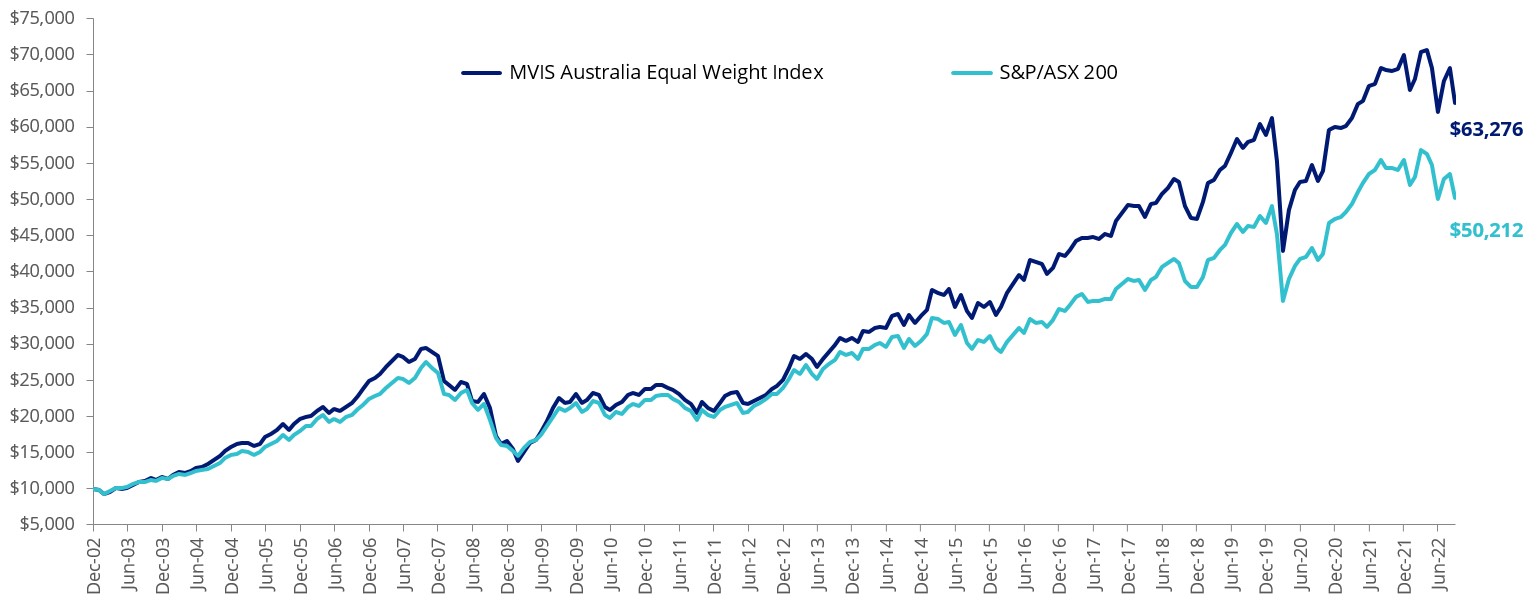
Source: VanEck, Morningstar Direct, as at 30 September 2022. The above performance graph shows the performance of the MVW Index vs the S&P/ASX 200 Index rebased to 10,000. Results are calculated to the last business day of the month and assume immediate reinvestment of all dividends and exclude costs associated with investing in MVW. You can not invest directly in an index. The above performance information is not a reliable indicator of current or future performance of the indices or MVW, which may be lower or higher. MVW Index base date is 31 December 2002. MVW Index performance prior to its launch on 29 November 2013 is simulated based on the current index methodology. The S&P/ASX 200 Index is shown for comparison purposes as it is the widely recognised benchmark used to measure the performance of the broad Australian equities market. It includes the 200 largest ASX-listed companies, weighted by market capitalisation. MVW’s index measures the performance of the largest and most liquid ASX-listed companies, weighted equally at rebalance. MVW’s index has fewer companies and different industry allocations than the S&P/ASX 200. For financial professionals only.
Access to Australian Equal Weight
VanEck Australian Equal Weight ETF (ASX ticker: MVW) offers investors access to a core Australian equity portfolio that equally weights the largest and most liquid ASX-listed companies.
Key risks
An investment in the ETF carries risks associated with: financial markets generally, individual company management, industry sectors, fund operations and tracking an index. See the PDS for details.


Published: 17 November 2022