Beyond BHP: A flaw of ASX 200 ETFs
Most ETFs track a market capitalisation index. The market capitalisation index for Australian equities would be the S&P/ASX 200 or S&P/ASX 300. These are known as ‘market capitalisation’ indices because company inclusion is determined by the market capitalisation (size). Size is the only prerequisite for inclusion, and the bigger the company, the larger its representation in the index.
These indices were used for passive investments such as ETFs because they were often the first of their kind, and that was the only reason they were recognised as 'the benchmark'. These benchmarks, however, were not initially designed for investment purposes, rather they were created to provide an update, or a health check, of the market.
As investing evolved, so too have indices. There is a body of research testing the efficacy of market capitalisation indices. The research into index construction started by assessing the strengths and weaknesses of market capitalisation approaches.
Researchers found that stock prices do not always reflect a company’s fundamentals. Therefore, if the market overvalues a company, the market index has too much exposure to that company, likewise if the market undervalues a company its value will not be reflected in the market index.
In other words, a fund tracking a market capitalisation index like the S&P/ASX 200 could be allocating too much to an overpriced company and not enough of an underpriced company. The opposite of what investors want.
S&P/ASX 200 investors experienced this in action over the past few years. When BHP consolidated it was close to 12% of the S&P/ASX 200 Index. That means that when you invested in an ETF tracking the largest 200 companies in Australia you were buying more BHP than any other company. Buying more of what turned out to be, an overpriced company relative to the rest of the market. BHP declared its results earlier this week. Over the past two and a half years, its allocation in the S&P/ASX 200 has shrunk to 8.7% of the index.
Researchers also found the risk of exposure to bubbles and concentration risk as potential weaknesses of market capitalisation indices. Again, the S&P/ASX 200 is an example of this, being one of the most concentrated in the world. Two cyclical sectors, materials and financials, make up almost 50 per cent of the local index.
Researchers have also considered alternative approaches to index construction. One such methodology that has academic support is equal weighting. As the name suggests each company, irrespective of size, represents the same proportion of the index. All holdings are equally weighted when it rebalances.
In a concentrated market like Australia, diversification benefits can be achieved by applying an equally weighted methodology. Equal weighting reduces the concentration risk of the mega-cap companies, such as the big banks and big miners that dominate the S&P/ASX 200 and delivers increased exposure to companies outside the top 10 where there is generally greater opportunity for growth.
The VanEck Australian Equal Weight ETF (MVW) tracks the MVIS Australia Equal Weight Index (MVW Index). The equal weighted index the ETF tracks is unique because it combines equal weight diversification with investability criteria ensuring liquidity. In other words, it was designed for investing.
Taking an equally weighted approach has been proven to produce outperformance over the long-term compared to a benchmark market capitalisation approach, as well as providing diversification benefits.
So let’s walk through the difference between MVW and the S&P/ASX 200.
MVW vs S&P/ASX 200 Index – Fundamentals
Table 1: Statistics and fundamentals
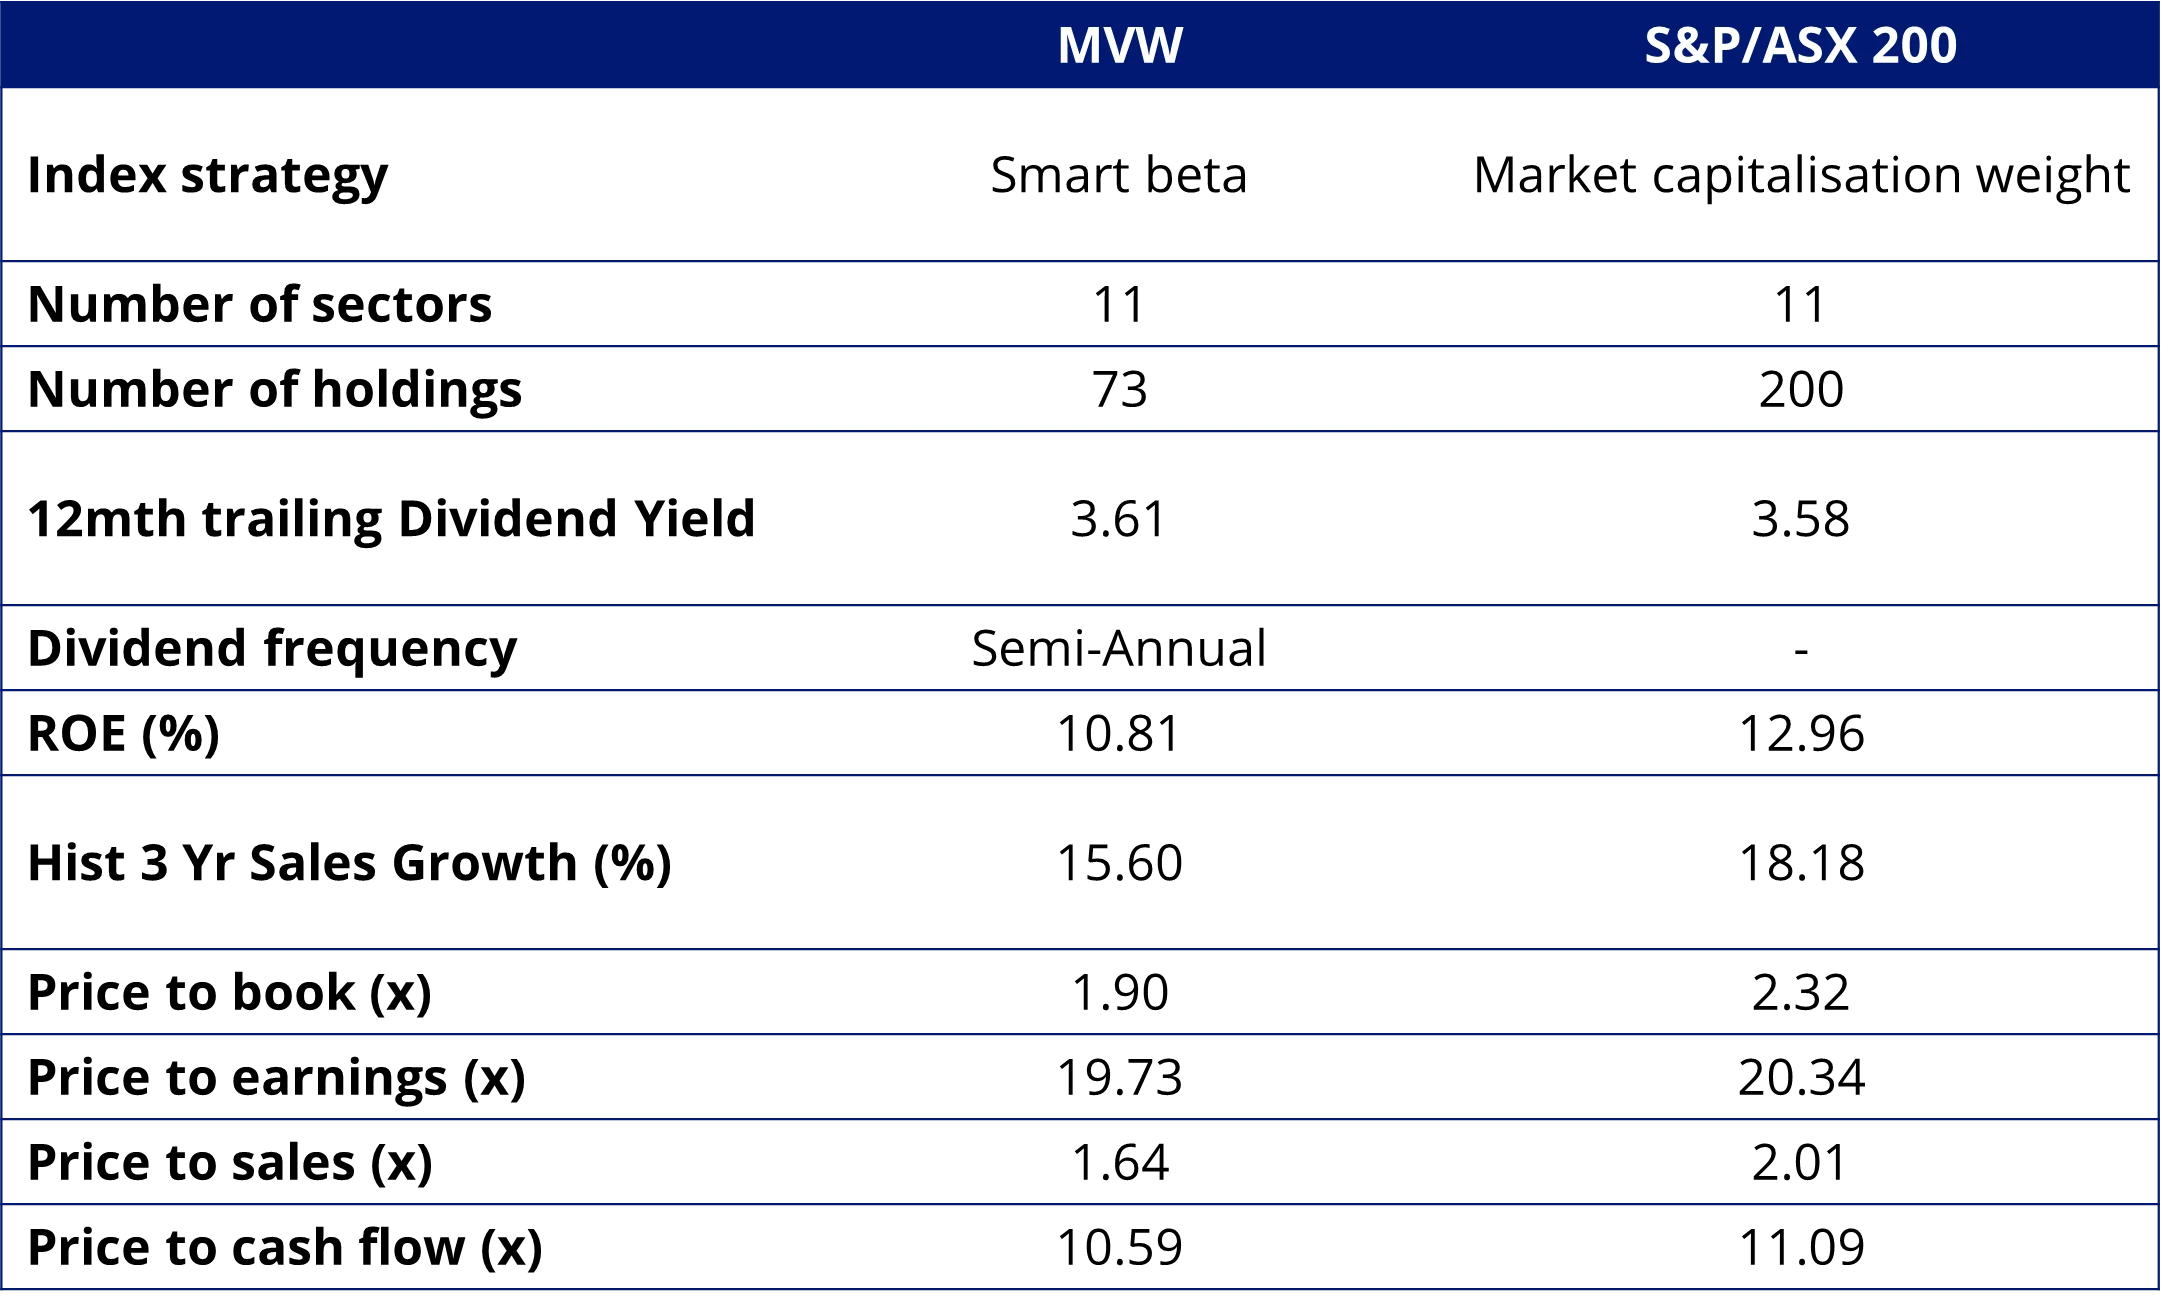
Source: FactSet as at 27 August 2024. Past performance is not a reliable indicator of future performance. You cannot invest directly in an index. The dividend yield is not an indication of future dividends.
MVW has lower price to book, price to earnings, price to sales and price to cash flow. Despite being underweight companies and sectors (discussed below) usually associated with high dividends, such as banks, it also has a marginally higher dividend yield.
MVW vs S&P/ASX 200 Index - Top 10 holdings
Below you can see the top 10 companies. The differences are stark – to see all the holdings in MVW and their weightings click here.
Table 2 & 3: Top 10 holdings of MVW and S&P/ASX 200
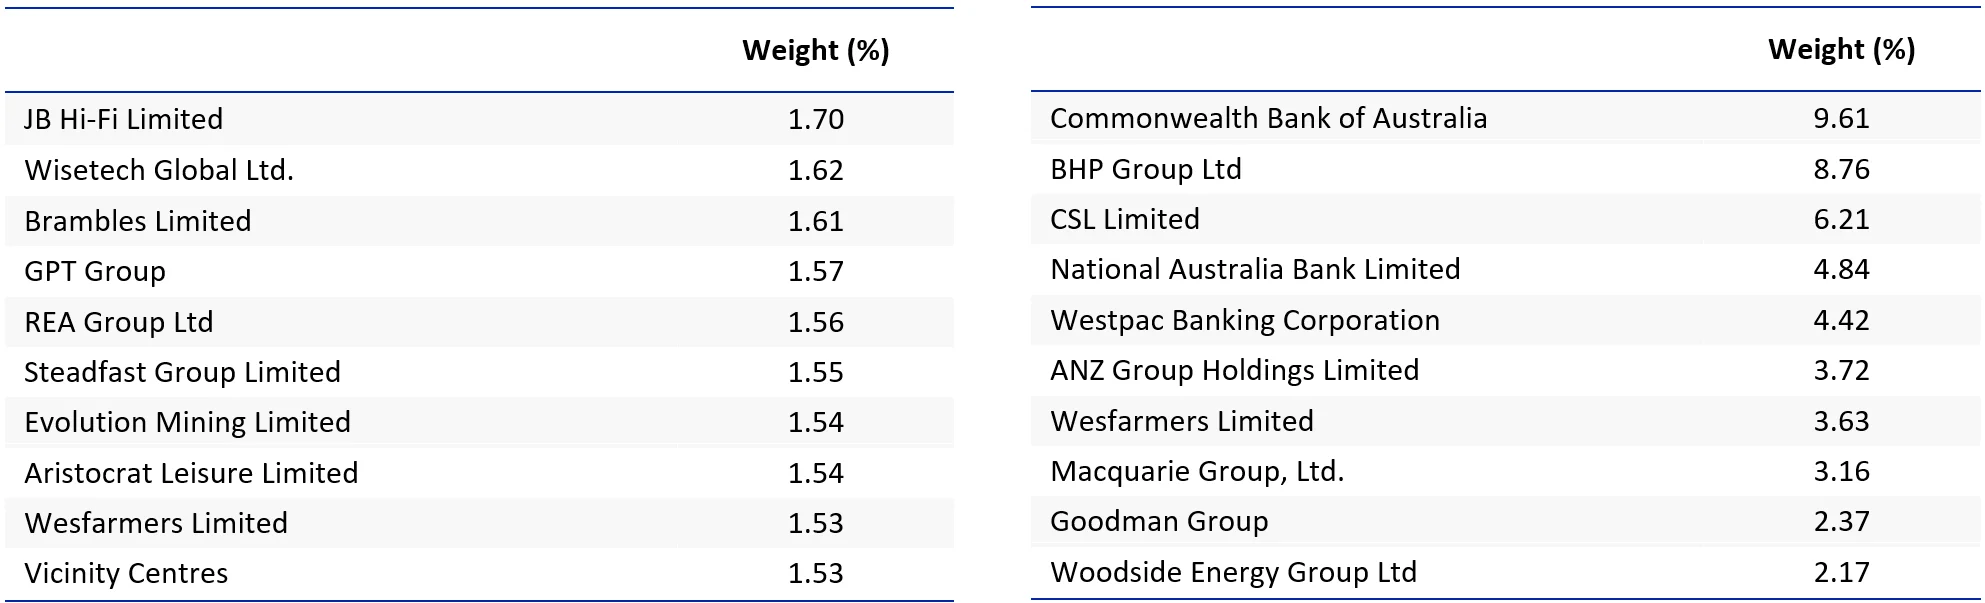
Source: FactSet, VanEck, MVIS, as at 27 August 2024. FactSet, VanEck, S&P, as at 27 August 2024
MVW’s holdings are not equal in Table 2 above because it only rebalances back to equal weight each quarter. The next rebalance will be in September. Noticeably JB Hi-Fi is now 1.70% of MVW after its strong performance following its recent update during report season. At the last rebalance, it was 1.37% of MVW. It was only 0.37% of the S&P/ASX 200 Index. In this way, investors in MVW have benefited more from its allocation to JB Hi-Fi than investors in S&P/ASX 200 trackers. It will be pared at the next quarterly rebalance and the portfolio holding will be equal with the others.
You can see the two largest companies in S&P/ASX 200 make up over 18% of the portfolio. That means 198 fills in the remaining 82%. You can see the next eight companies, by size, represent 30.5% of the index. So, 190 companies, like JB Hi-Fi, are squeezed into the remaining 51%.
MVW vs S&P/ASX 200 Index - Sectors
MVW is currently underweight the financials sector by 10.9% compared to the S&P/ASX 200. Conversely, it is overweight industrials by 9.8% and real estate by 3.4%.
Charts 1 & 2: S&P/ASX 200 and MVW Index company weightings
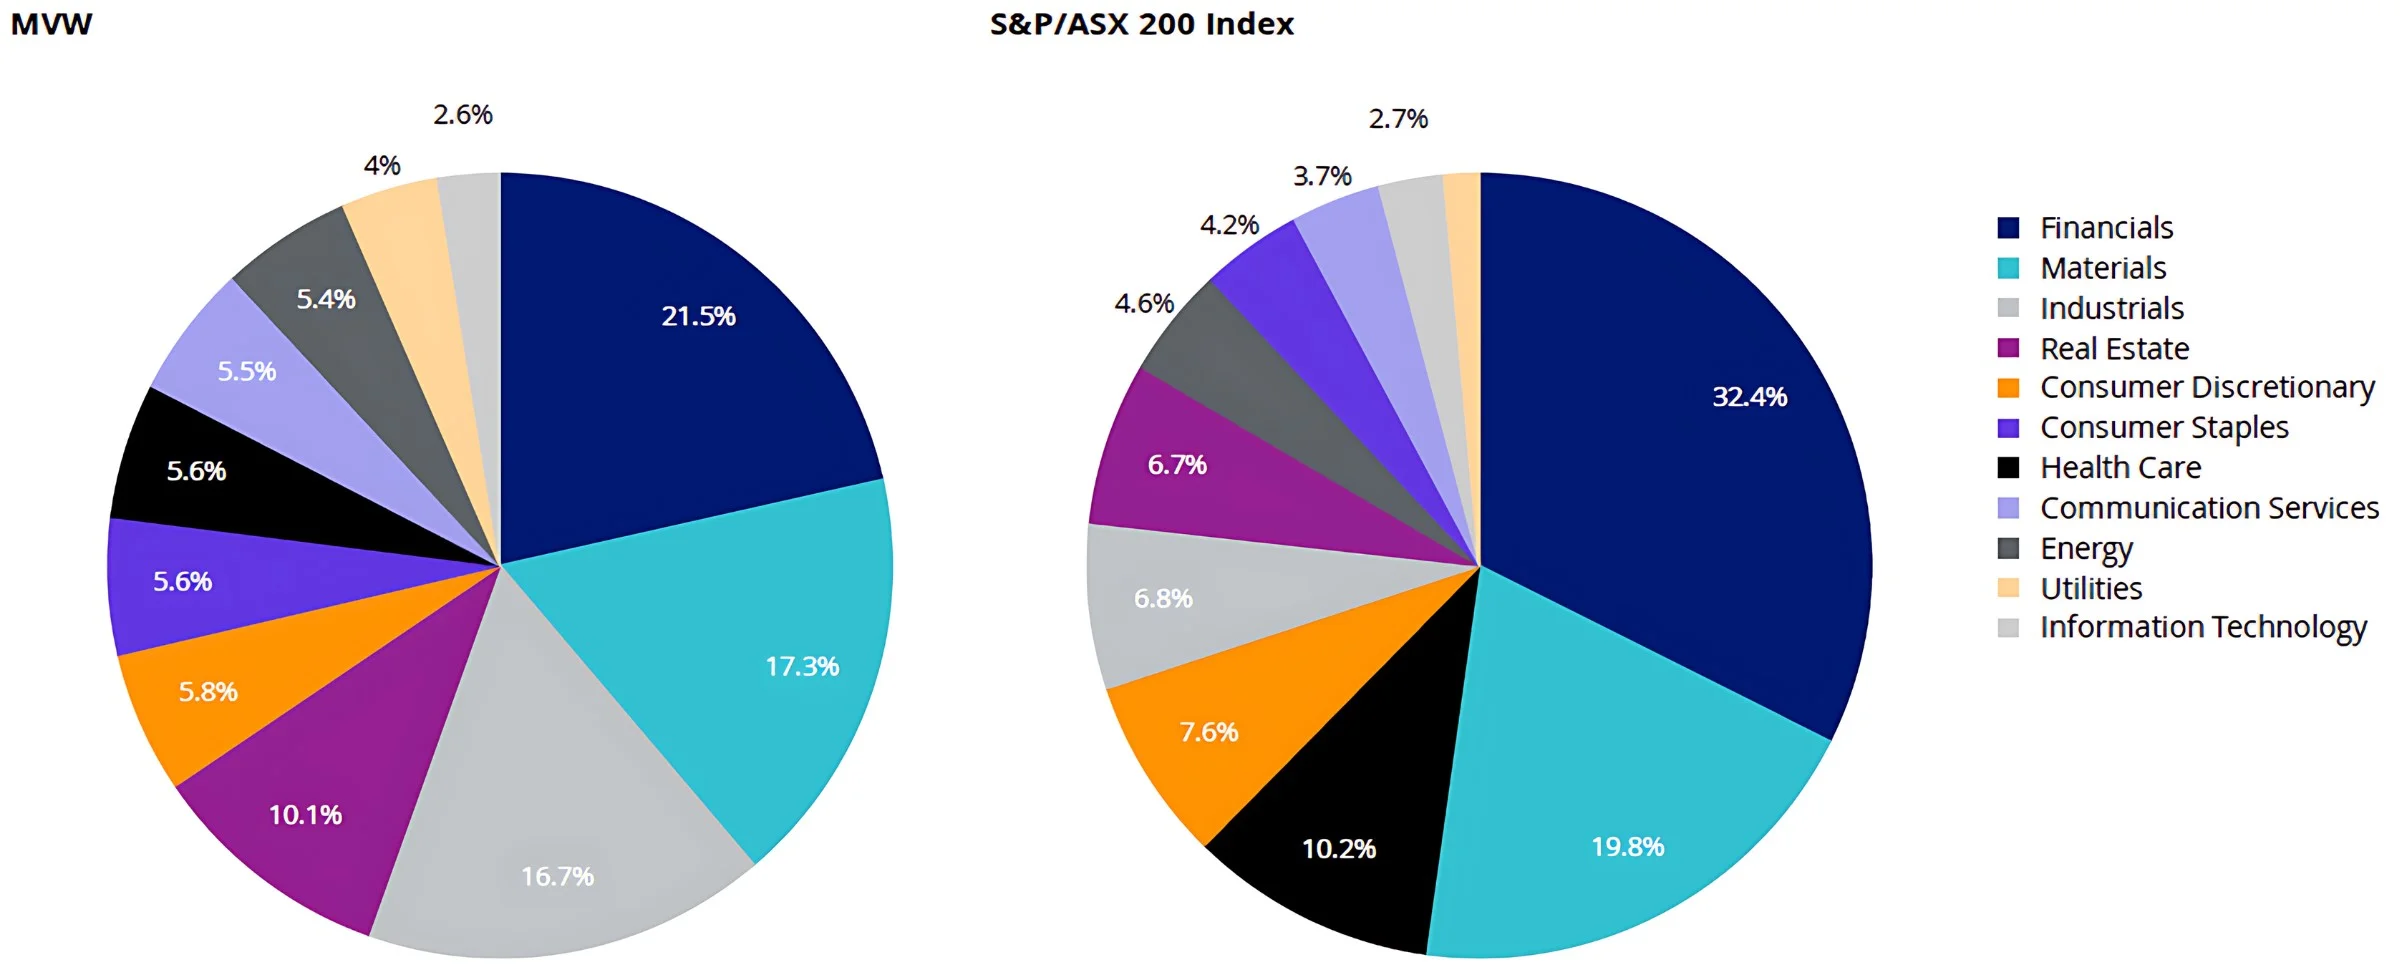
Source: FactSet, 31 July 2024
What this means is that if there is another systematic banking issue, or commodities fall the impact on the S&P/ASX 200 is greater than in the MVW Index.
MVW vs S&P/ASX 200 Index - Style
When looking at portfolios it is important to determine what style e.g. value or growth and what size bias a portfolio holds e.g. mega, large, mid or small. Below we can see MVW’s. Importantly MVW holds large companies with a similar value-core orientation relative to the S&P/ASX 200, which skews larger (giant) and more toward growth.
Chart 3 & 4: MVW holdings based style map and S&P/ASX 200 holdings based style map

Source: Morningstar Direct, as at 31 July 2024
MVW vs S&P/ASX 200 - Performance
Equal weight investing has served Australian investors well. At the time of writing, since its inception on ASX in 2014, MVW has outperformed the S&P/ASX 200 by 1.02% p.a.
Chart 5: Cumulative performance since MVW inception date to 29 August 2024
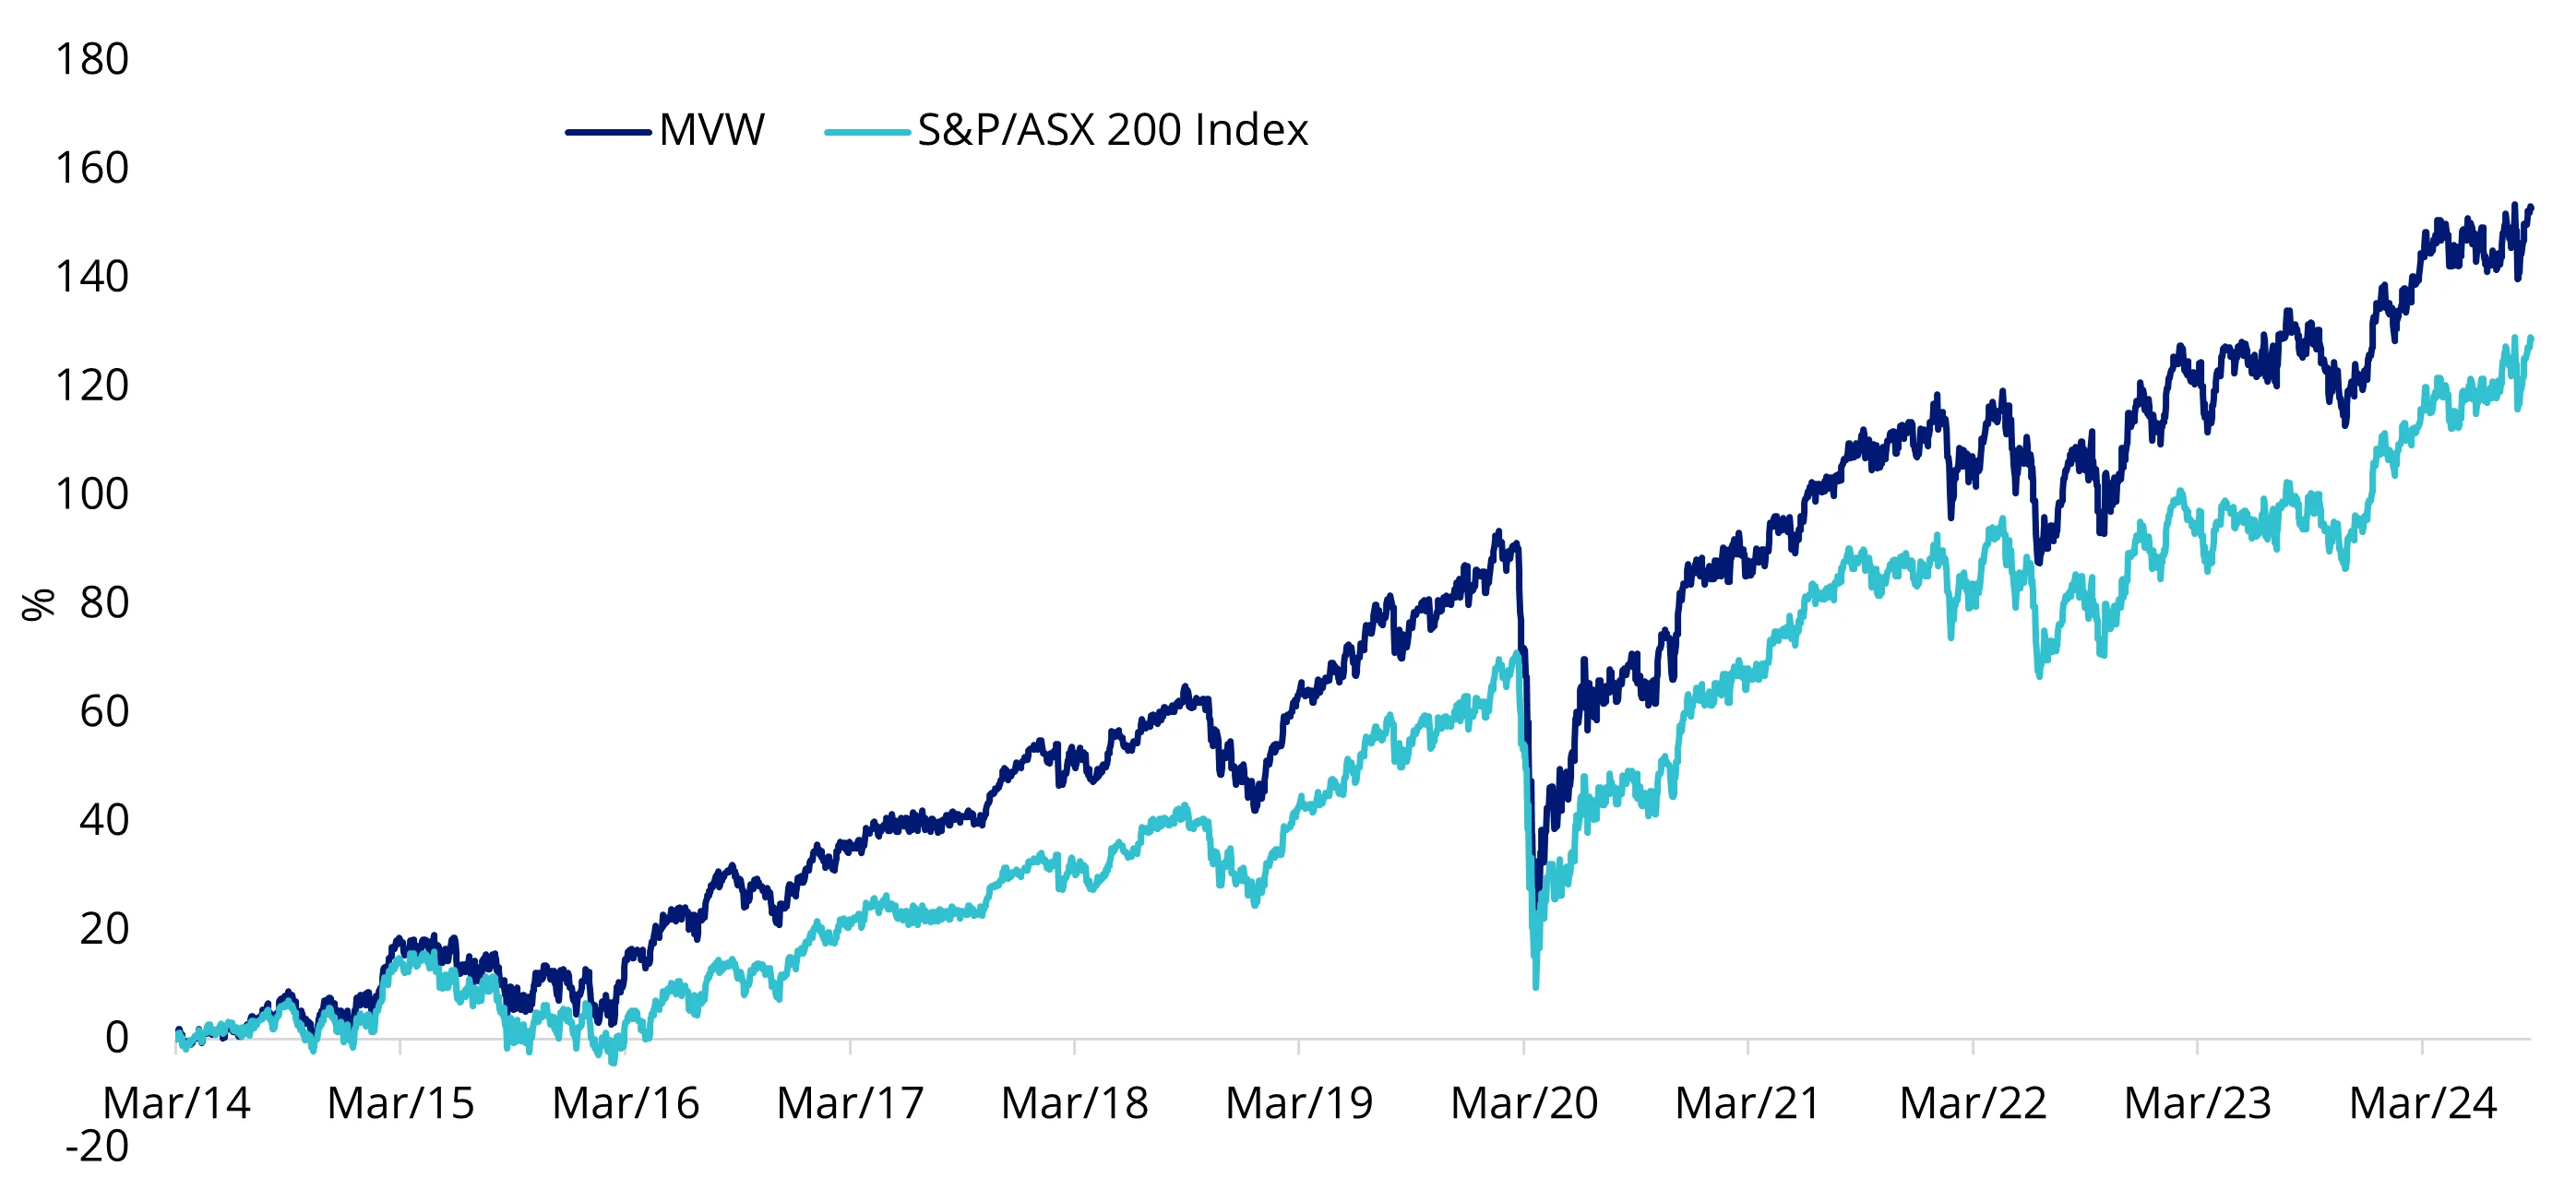
Table 4: Trailing performance to 29 August 2024
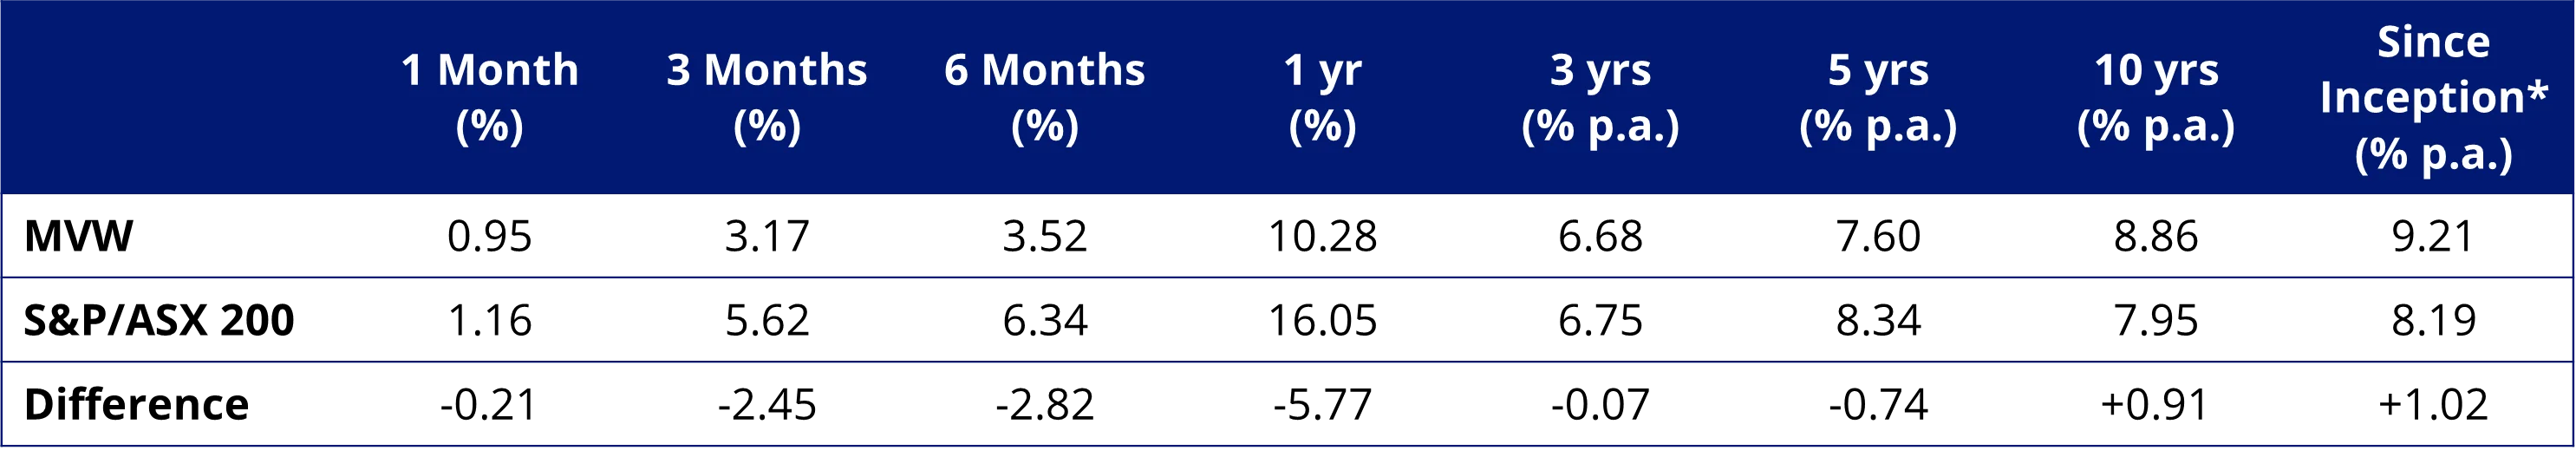
* MVW Inception date is 4 March 2014 a copy of the factsheet is here.
Chart 5 and Table 4 source: Morningstar Direct, VanEck. The chart and table above show the past performance of MVW and of the S&P/ASX 200. You cannot invest directly in an index. Results are calculated to the last business day of the month and assume immediate reinvestment of distributions. MVW results are net of management fees and other costs incurred in the fund, but before brokerage fees and bid/ask spreads incurred when investors buy/sell on the ASX. Returns for periods longer than one year are annualised. Past performance is not a reliable indicator of future performance. The S&P/ASX 200 Index is shown for comparison purposes as it is the widely recognised benchmark used to measure the performance of the broad Australian equities market. It includes the 200 largest ASX-listed companies, weighted by market capitalisation. MVW’s index measures the performance of the largest and most liquid ASX-listed companies, weighted equally at rebalance. MVW’s index has fewer companies and different industry allocations than the S&P/ASX 200. Click here for more details.
While each Australian equity ETF has its merit for portfolio inclusion, you should assess all the risks and consider your investment objectives.
Past performance is no guarantee of future performance. The above is not a recommendation. Please speak to your financial adviser or stock broker.
For further information you can email us or call on us on +61 2 8038 3300.
Key risks
An investment MVW carries risks associated with: ASX trading time differences, financial markets generally, individual company management, industry sectors, country or sector concentration, political, regulatory and tax risks, fund operations and tracking an index. See the PDS for details.


Published: 30 August 2024
Any views expressed are opinions of the author at the time of writing and is not a recommendation to act.
VanEck Investments Limited (ACN 146 596 116 AFSL 416755) (VanEck) is the issuer and responsible entity of all VanEck exchange traded funds (Funds) trading on the ASX. This information is general in nature and not personal advice, it does not take into account any person’s financial objectives, situation or needs. The product disclosure statement (PDS) and the target market determination (TMD) for all Funds are available at vaneck.com.au. You should consider whether or not an investment in any Fund is appropriate for you. Investments in a Fund involve risks associated with financial markets. These risks vary depending on a Fund’s investment objective. Refer to the applicable PDS and TMD for more details on risks. Investment returns and capital are not guaranteed.
MVIS Australia Equal Weight Index (‘MVIS Index’) is the exclusive property of MV Index Solutions GmbH based in Frankfurt, Germany (‘MVIS’). MVIS is a related entity of VanEck. MVIS makes no representation regarding the advisability of investing in the Fund. MVIS has contracted with Solactive AG to maintain and calculate the MVIS Index. Solactive uses its best efforts to ensure that the MVIS Index is calculated correctly. Irrespective of its obligations towards MVIS, Solactive has no obligation to point out errors in the MVIS Index to third parties.


