Weighty considerations for Australian equities
The way many active funds and big institutional investors construct their portfolios is to hold positions like the index they are trying to beat, otherwise they are taking a big risk. In Australian equities, the standard market index is the S&P/ASX 200 Index. If markets go against active funds and they drastically underperform the index, they will be seen as incompetent. Better to be just above or just below the index.
Beta is a measure of correlation and sensitivity. Therefore, it makes sense that the Australian Industry Superannuation funds, which are assessed against the benchmarks prescribed in the Your Future Your Super (YFYS) regime, hold a select few of the companies with a beta closer to the S&P/ASX 200 Index to manage risk. Many use CBA as their ‘beta’ for Australian equities. CBA’s three-year beta is 1, much closer than any of the other of the mega-caps on ASX such as BHP with a beta of 1.1 (a beta of 1 equates to a perfect correlation).
As global markets rallied in 2024, investors with Australian equity exposures bought up the likes of CBA, NAB and Westpac to manage their risk. Combined, these three banks contributed 648 bps to the benchmark’s total return with CBA contributing 347 bps alone.
Table 1: Three year beta of S&P/ASX Top 10

Source: FactSet, Three years to 31 December 2024
Table 2: Top 10 contributors to S&P/ASX 200 performance in 2024

Source: FactSet, 12 months to 31 December 2024
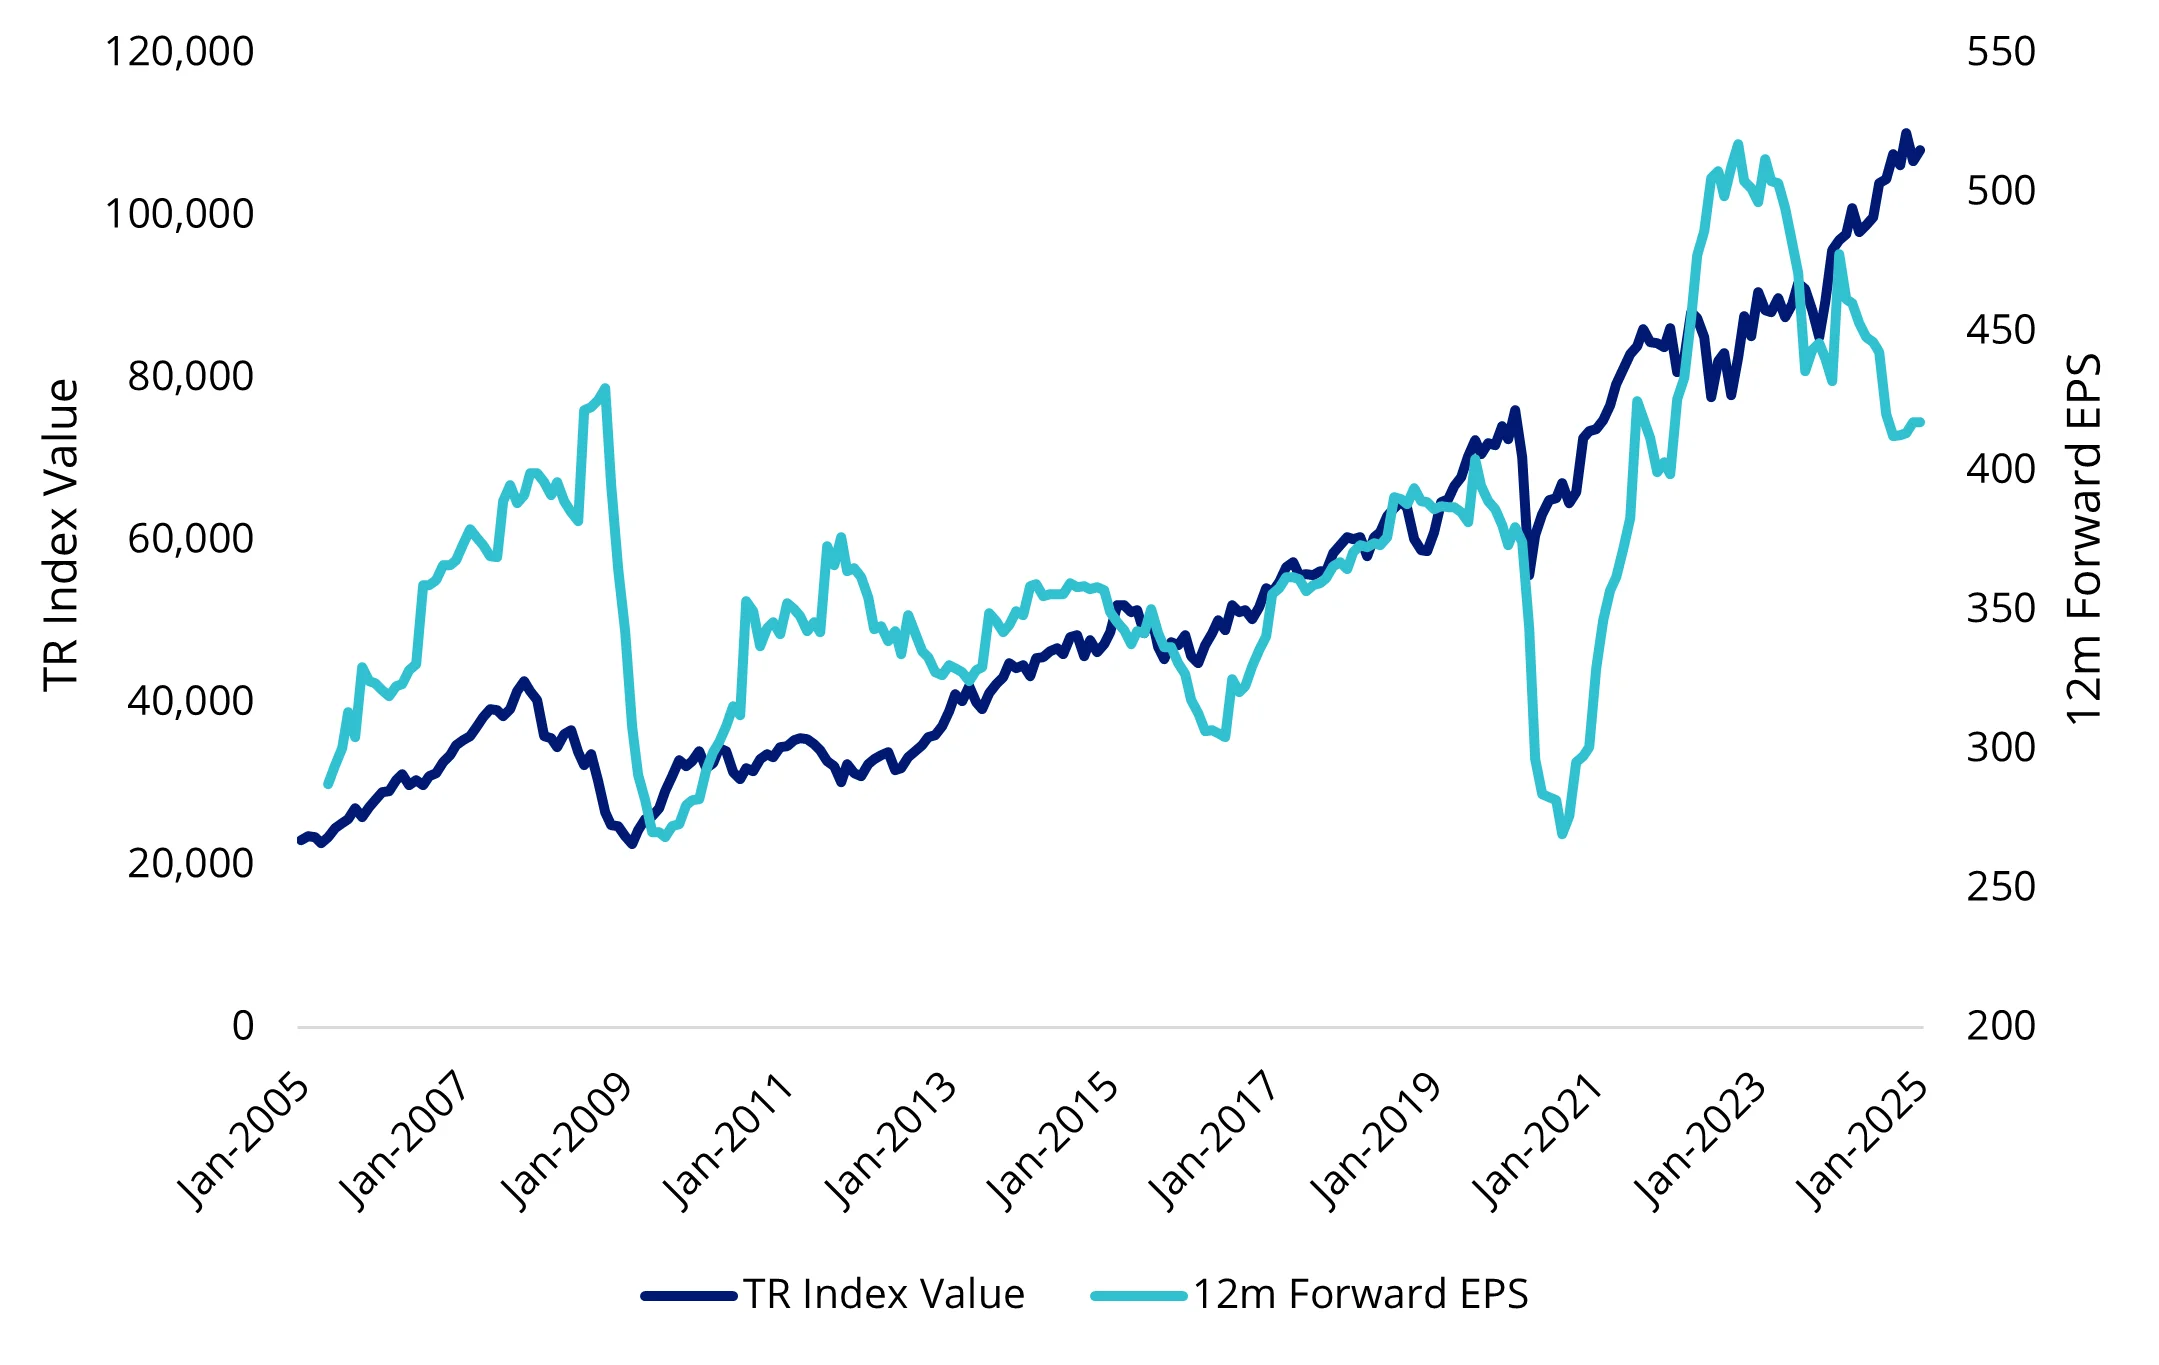
However, the 2024 Australian equity rally did not align with Earnings per Share (EPS) metrics. On a trailing EPS basis, the S&P/ASX 200’s march is in a different direction to EPS, despite a correlation in the past. Share price returns generally follow earnings i.e. EPS.
Chart 1: S&P/ASX 200 12-month trailing EPS and returns

Source: Bloomberg, 31 December 2024. You cannot invest in an index. Past performance is not indicative of future performance.
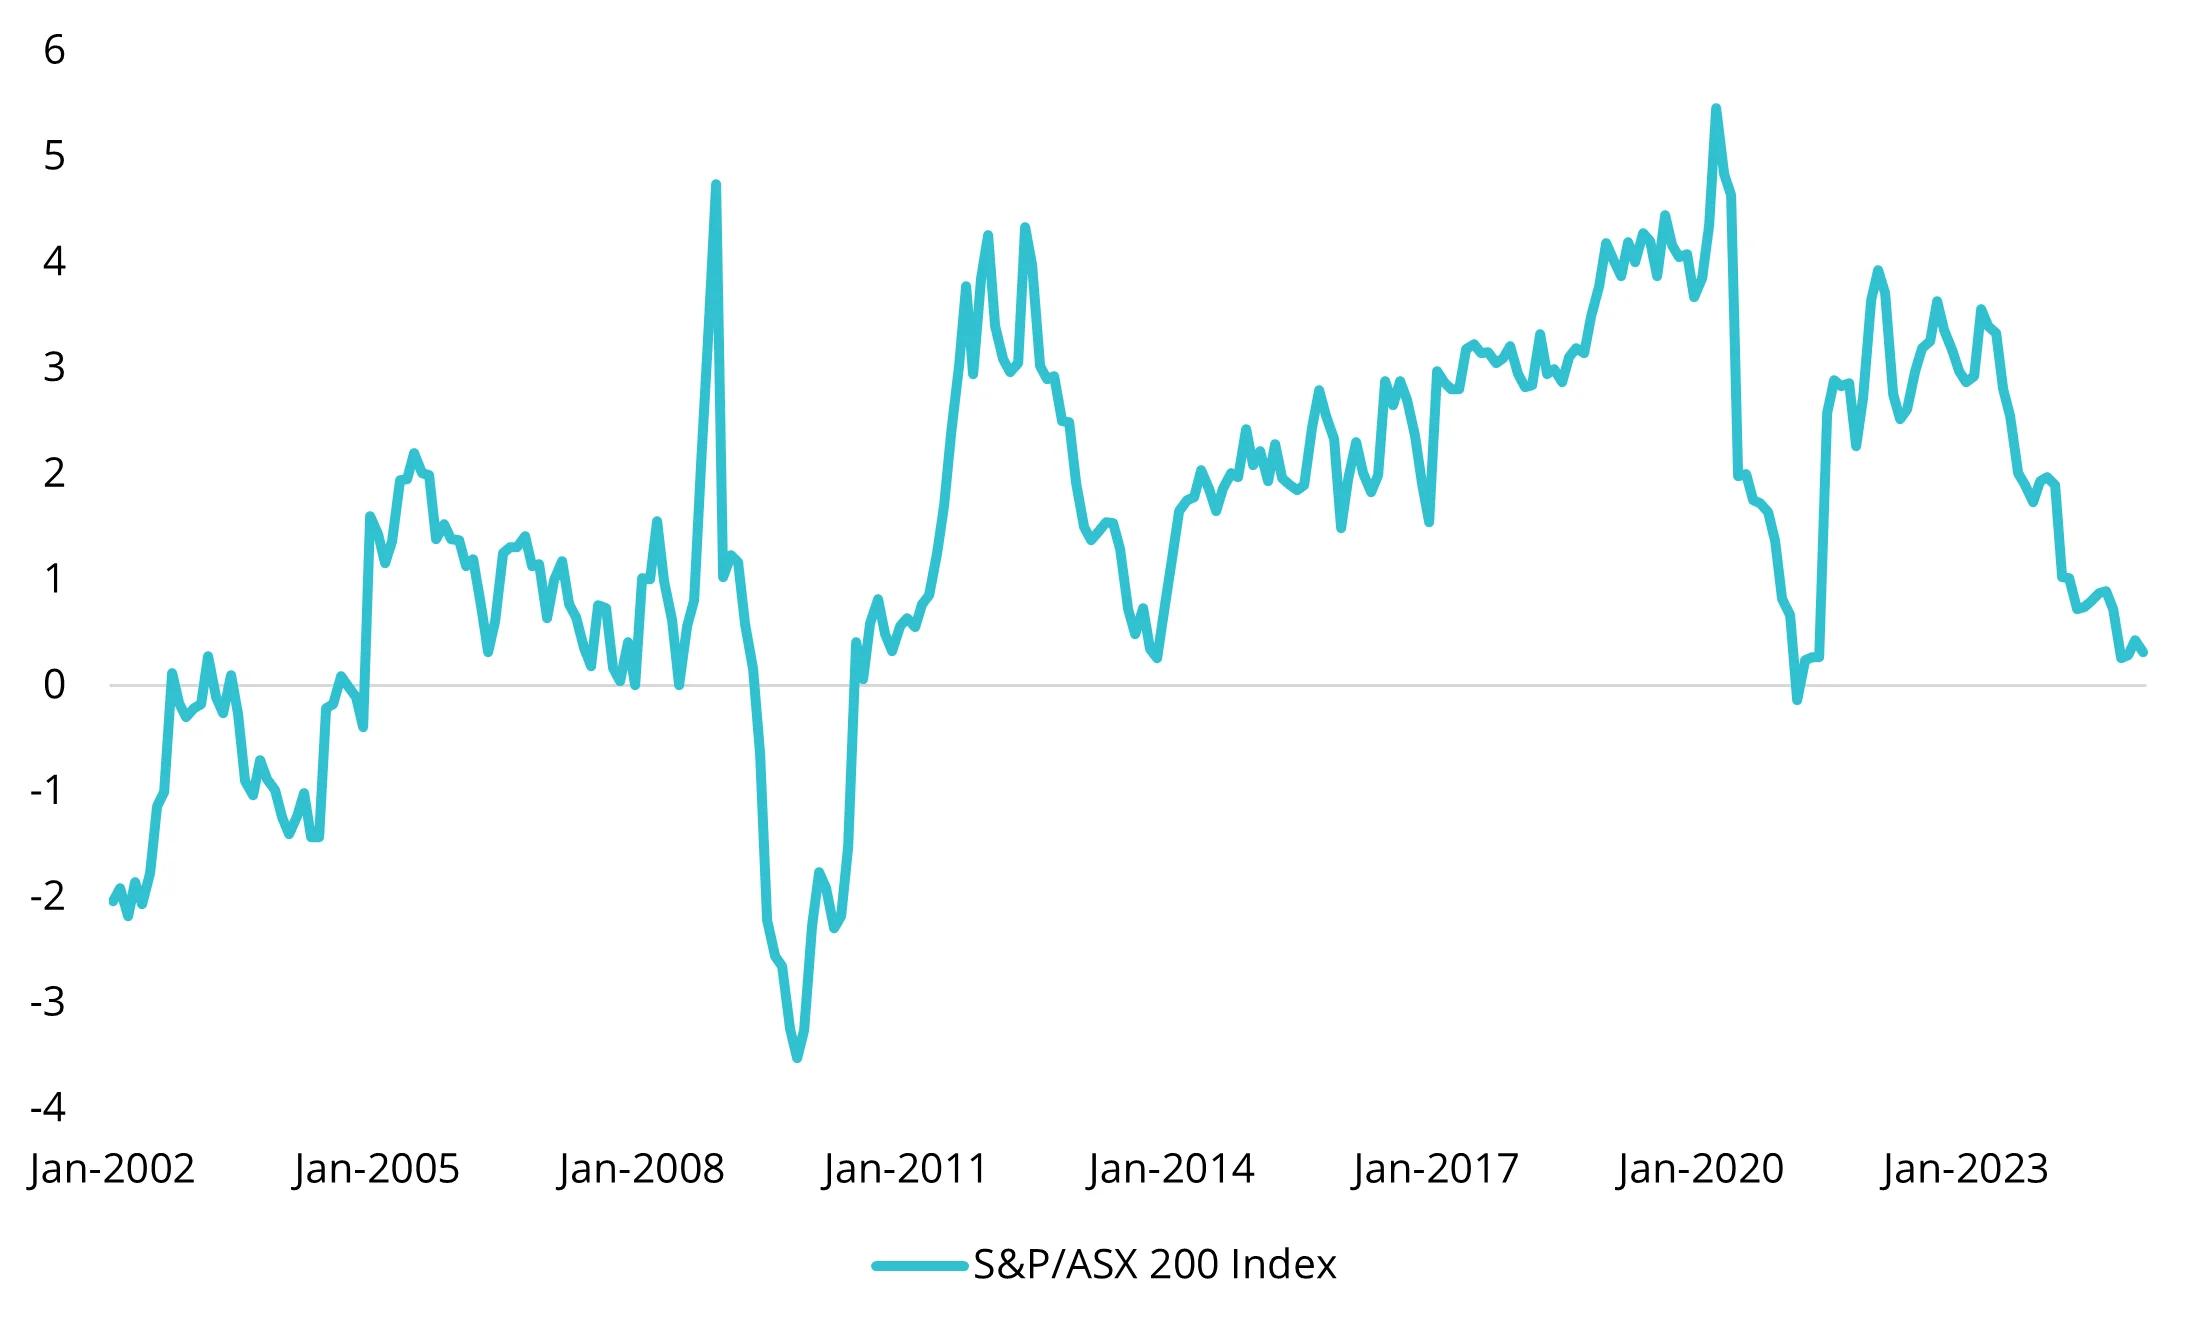
As investors ponder 2025, the equity risk premium of Australian equities may also be giving them cause for concern.
Chart 2: S&P/ASX 200 Equity risk premium

Source: Bloomberg, 31 December 2024, Equity risk premium calculated as 12-month trailing earnings yield less Australian 10-year bond yield.
So, while momentum drove markets last year, we think the opportunities in Australian equities are more likely to be outside the mega-caps that drove 2024’s index returns. Case in point, the S&P/ASX MidCap 50 was the highest returning S&P/ASX market cap index strategy in the S&P/ASX index series for the 12 months ending 31 December 2024 (S&P/ASX 200: 11.44%, S&P/ASX 50: 11.65%, S&P/ASX MidCap 50: 12.39% and the S&P/ASX Small Ordinaries: 8.36%, Source: Morningstar Direct).
A portfolio approach with more meaningful exposure to those companies outside the top 10 warrants consideration.
Rather than constructing an index or a portfolio considering a constituents’ size, like the S&P/ASX 200 or S&P/ASX 300, the MVIS Australia Equal Weight Index (MVW index) which the VanEck Australian Equal Weight ETF (MVW) tracks, includes only the largest and most liquid companies on ASX. MVW Index currently includes 73 companies, and it equally weights them once a quarter, at each rebalance.
Australian equity market – stocks weights
Because of the MVW Index’s equal weight construction methodology, at last rebalance, no stock was more than 1.39%. The impact of this is that MVW is underweight the mega-caps that dominate the S&P/ASX 200. What this means is that if, say, BHP or CBA goes down or up 2%, its impact on the S&P/ASX 200 is greater than in the MVW Index.
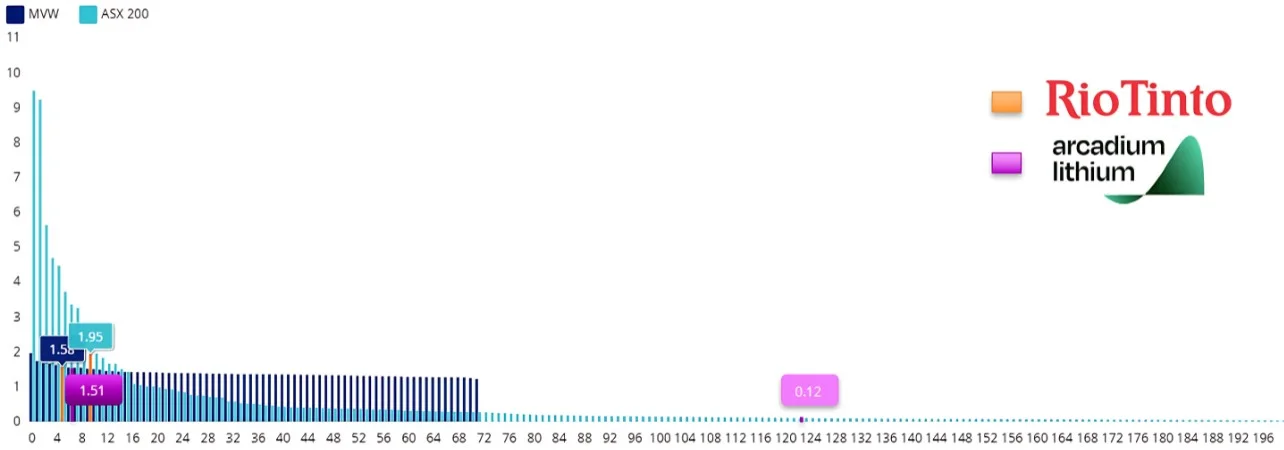
On the other side of the coin, 56 companies within the MVW Index have a higher weighting than the S&P/ASX 200 and therefore have a greater influence on MVW’s returns. As Chart 3 below shows, MVW has a larger exposure for around 80% of its portfolio than the market capitalisation-weighted benchmark index.
The companies in which MVW is overweight may be former small and mid-caps that have grown large, or they may be large or mega caps that have fallen in size. Importantly, these companies have much greater growth potential or are more likely to be taken over as highlighted by the proposed Rio/Arcadian transaction last year.
At the time, Arcadium Lithium represented a meagre 0.12% of the S&P/ASX 200. As one of the most liquid stocks on ASX, it was 1.51% of MVW, which means investors in equal weight benefitted more from this type of corporate activity.
Chart 3: Constituent rank and weightings of MVW versus S&P/ASX 200 at time of Rio’s bid for Arcadian

Source: Factset, 30 September 2024
It’s not just takeover targets that MVW may be overweight. It is also companies with greater growth potential, which you can see in its fundamentals.
Better fundamentals
MVW currently has higher historical EPS growth than the market index. It also represents better value at the moment with a lower price to earnings, price to book and price to sales.
Table 3: Fundamentals

Source: FactSet as at 31 December 2024
Using MVW in a portfolio
Since it launched, over a decade ago, MVW has become the fourth-largest broad-based Australian equities ETF on ASX. It is the largest smart beta ETF in its category and has enjoyed support from all parts of the market. Investors have been using MVW to replace or sit alongside their:
- Australian equity unlisted active fund which charges higher fees;
- LICs which are trading at discounts; or
- ASX/200 trackers to reduce stock and sector concentration risks.
MVW is designed to be a core Australian equities portfolio construction solution that can be deployed to de-risk and diversify with no one security or sector dominating providing a more balanced exposure to Australia’s economy. Its management fee of just 35 basis points per annum makes it one of the lowest-cost investment funds in its peer group, including unlisted managed active funds.
Many advisers and their investors are already using MVW as their core Australian equity allocation, around which they can add high-conviction satellite ideas.
In addition to MVW, another way to take advantage of the current market dynamics is our recently launched VanEck Geared Australian Equal Weight Fund (Hedge Fund) (GMVW).
Key risks
An investment in the ETF carries risks. These include risks associated with financial markets generally, individual company management, industry sectors, fund operations and tracking an index. GMVW borrows money to increase the amount it can invest. While this can result in larger gains in a rising market, it can also magnify losses in a falling market. The greater the level of gearing in the Fund, the greater the potential loss of capital. The Fund is considered to have a higher investment risk than a comparable fund that is ungeared. See the PDS for details.
Published: 20 January 2025
Any views expressed are opinions of the author at the time of writing and is not a recommendation to act.
VanEck Investments Limited (ACN 146 596 116 AFSL 416755) (VanEck) is the issuer and responsible entity of all VanEck exchange traded funds (Funds) trading on the ASX. This information is general in nature and not personal advice, it does not take into account any person’s financial objectives, situation or needs. The product disclosure statement (PDS) and the target market determination (TMD) for all Funds are available at vaneck.com.au. You should consider whether or not any Fund is appropriate for you. Investments in a Fund involve risks associated with financial markets. These risks vary depending on a Fund’s investment objective. Refer to the applicable PDS and TMD for more details on risks. Investment returns and capital are not guaranteed.


