Will Australia’s big four fall from grace?
China efforts to revitalise its economy spells good news for Australian miners but adds to mounting challenges for the big four banks.
China pumps the brakes on ASX big bank rally
China announced a series of new policies and rate cuts to revitalise the country’s economy last week, with the central bank now commencing a long-awaited easing cycle.
Previous government stimulus packages have tried and failed to resuscitate China’s economy, which has struggled to recover since the collapse of its property sector in 2021. However, the magnitude of the new measures and the unified front across fiscal, monetary, regulatory policy channels – as well as direct intervention into the equity market – suggests this time may be different.
The market saw this development as great news for Australian mining companies, many of which have been deeply impacted by China’s misfortunes. Reinvigoration of the Chinese property market would see a greater appetite for raw materials, fuelling demand and a corresponding uptick in prices for commodities such as iron ore and copper.
For Australian banks, China’s ambitious growth plans are not so positive. Historically, banks and miners have operated like a seesaw, with one or the other attracting the lion’s share of investors. A reversal of fortunes for resources means banks will have to surrender the lofty heights they’ve enjoyed over the last 12 months. The ink on China’s rate cut documentation has barely dried, and we started to see this seesaw dynamic play out in markets. From the announcement on September 24 to October 1, S&P/ASX 200 Banks Index fell 6.2% while S&P/ASX 200 Resources Index climbed by 9.2%.
The People’s Bank of China is not the only central bank that the likes of Commonwealth Bank, ANZ and Macquarie need to worry about. Australia’s own central bank, the RBA, poses another headwind, with easing monetary policy on the horizon that will put more pressure on big banks’ margins.
NIMs continue to deteriorate
The RBA recently updated its Major Banks’ Net Interest Margin (NIM) chart. The chart below shows that while NIMs rates have been kept high by the RBA, the banks’ NIMs have dipped, and stayed below 2% again. A reduction in NIMs results in a reduction in cash earnings and will impair the Big 4’s ability to increase dividend payments.
Chart 1: Major Banks’ Net Interest Margin* (Domestic, half yearly)
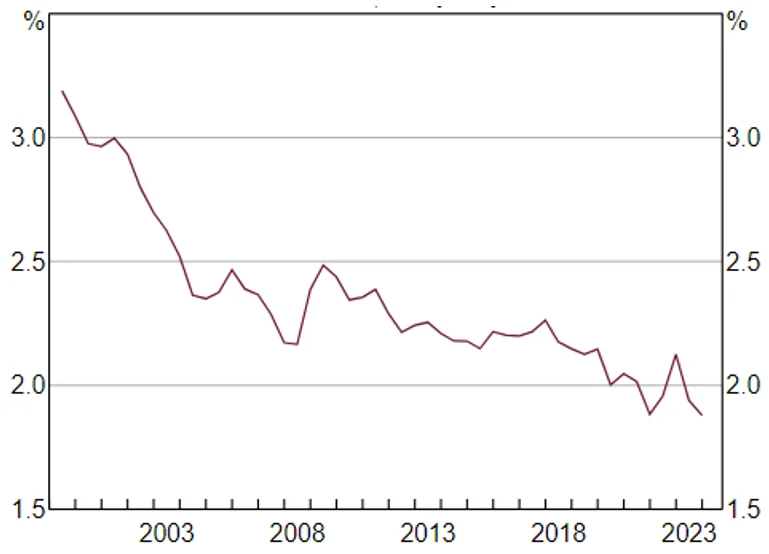
Source: Banks’ financial reports; RBA. Released on 25 September 2024 (data as at 19 September 2024). *Data for a given period relate to banks’ public profit reports released in that half; IFRS basis from 2006, AGAAP prior, excludes St George Bank and Bankwest prior to the first half of 2009. Sources: Banks’s financial reports; RBA.
This, together with banking being one of the more unloved sectors among the Australian broking community, an impending market rotation presents a risk to most Australian equity portfolios benchmarked to the S&P/ASX 200, as this index is highly concentrated and overexposed to the major Australian banks.
Chart 2: CBA sell-side price recommendations
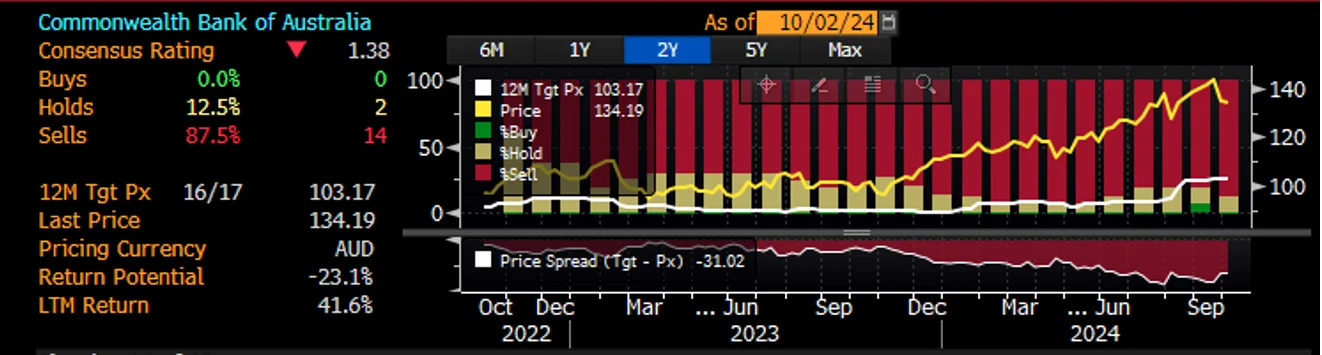
Source: Bloomberg, as at 2 October 2024. This is not a recommendation to act.
This market rotation presents a risk to most Australian equity portfolios benchmarked to the S&P/ASX 200, which is overexposed to the major Australian banks.
MVW vs S&P/ASX 200 Index – A more balanced approach
VanEck Australian Equal Weight ETF (MVW) is a portfolio construction solution that reduces concentration risk to banks and can be deployed to de-risk and diversify with no one security or sector dominating providing a more balanced exposure to Australia’s economy.
The index MVW tracks, equally weights the largest and most liquid stocks on the ASX at each rebalance. Because of this, at last rebalance, no company was more than 1.17%. What this means is that if ANZ or CBA goes up or down 2%, its impact on the S&P/ASX 200 is greater than on MVW.
A consequence of the equal weight methodology is that MVW relative to the S&P/ASX 200 is underweight those sectors that contain larger than average companies. For example, MVW is currently underweight the financials sector by 11.59% compared to the S&P/ASX 200. Conversely it will be overweight sectors that contain smaller than average companies. MVW is currently overweight industrials by 9.99%, real estate by 3.57% and communication services by 2.01%. Therefore, MVW has less sector concentration risk than the S&P/ASX 200.
Chart 3: MVW versus S&P/ASX 200 sector differential
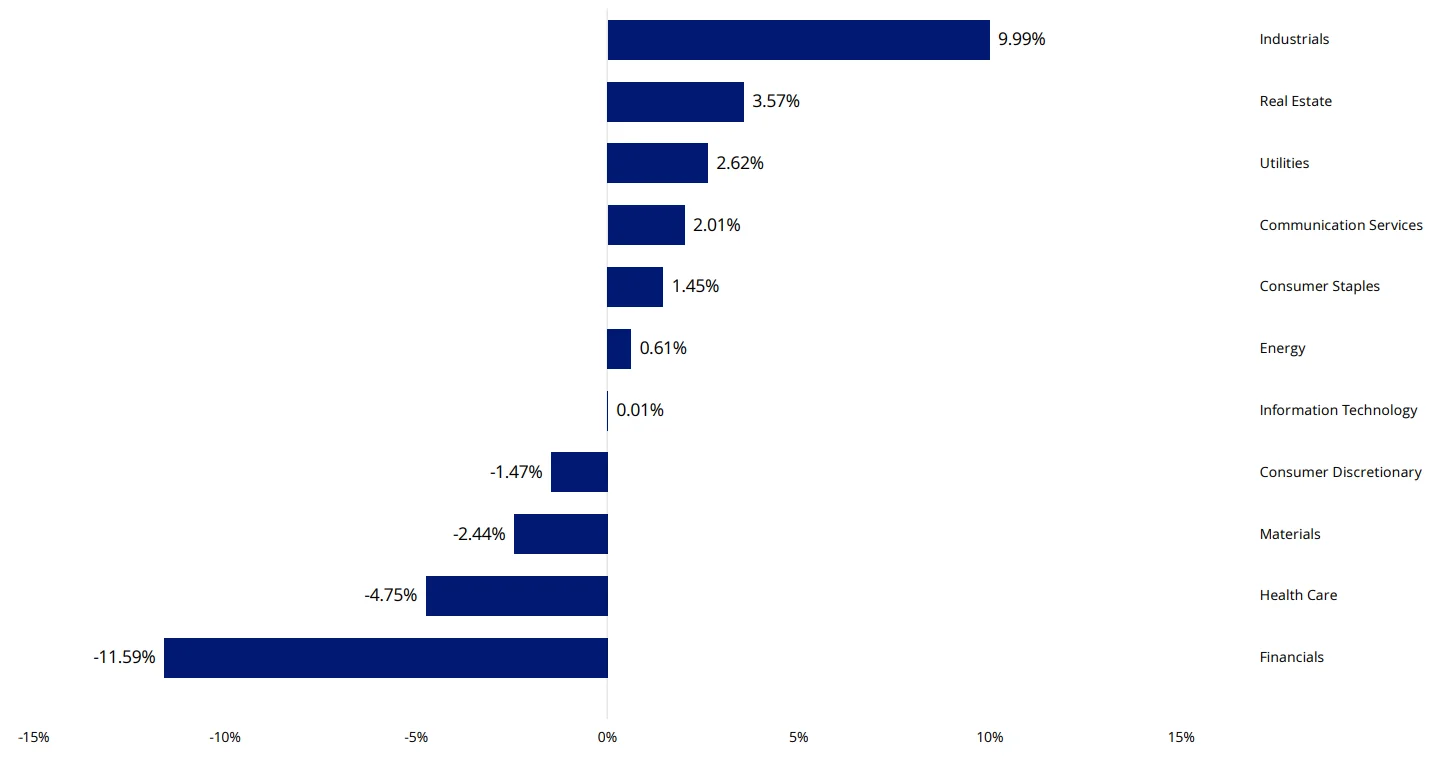
Chart 4: MVW versus S&P/ASX 200 Market capitalisation breakdown
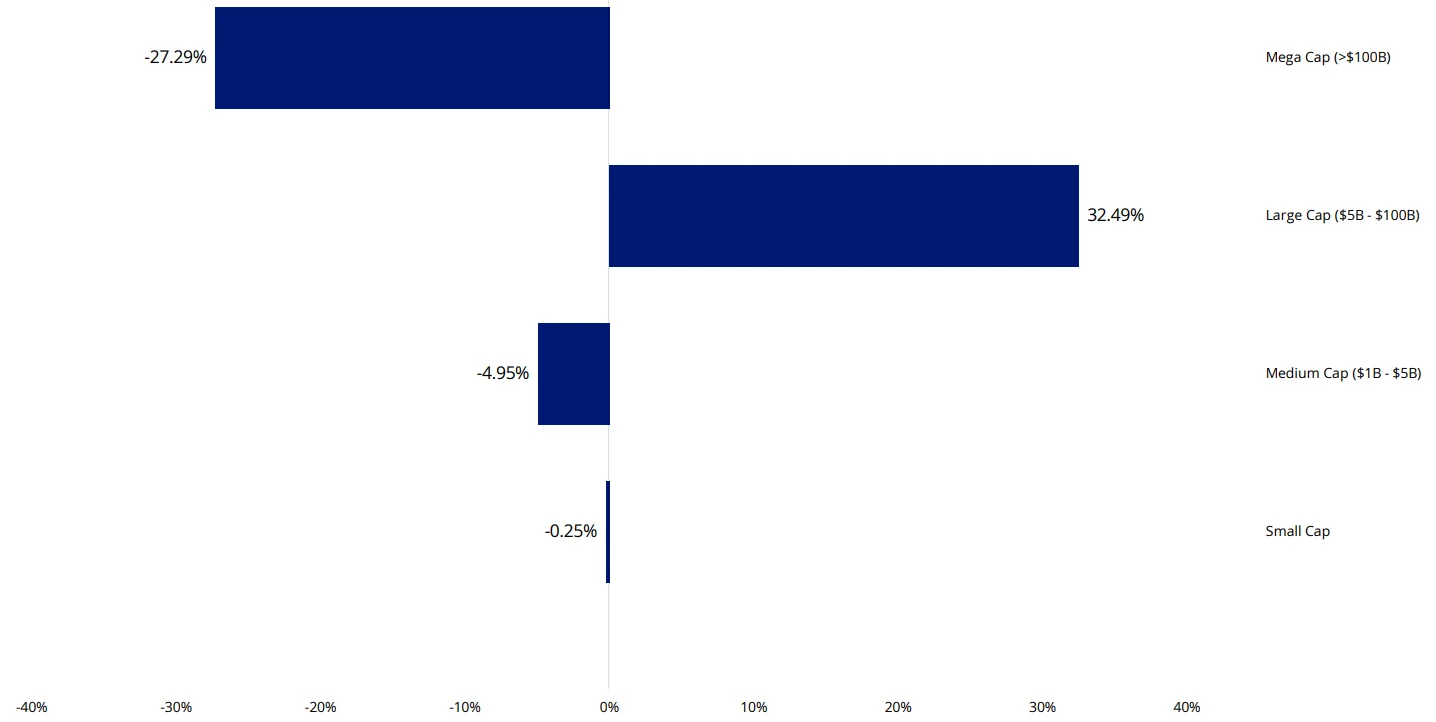
Charts 3 & 4 Source FactSet, as at 31 August 2024. Calculated by subtracting S&P/ASX 200 weights from respective MVW weights; positive differentials indicate greater MVW weight.
Irrespective of any market rotations or corrections taking place, MVW is designed to be a long-term portfolio solution, that reduces concentration risk to the banks.
Since its inception in 2014, MVW has outperformed the S&P/ASX 200 Index by 109 basis points per annum. The returns since China’s recent policy announcement reflect MVW being underweight mega cap banks while being overweight large miners. MVW gained 2.48% while the S&P/ASX200 rose only 0.70%¹. As always, past performance is by no means a reliable indicator of future performance.
Table 1: Trailing performance to 30 September 2024
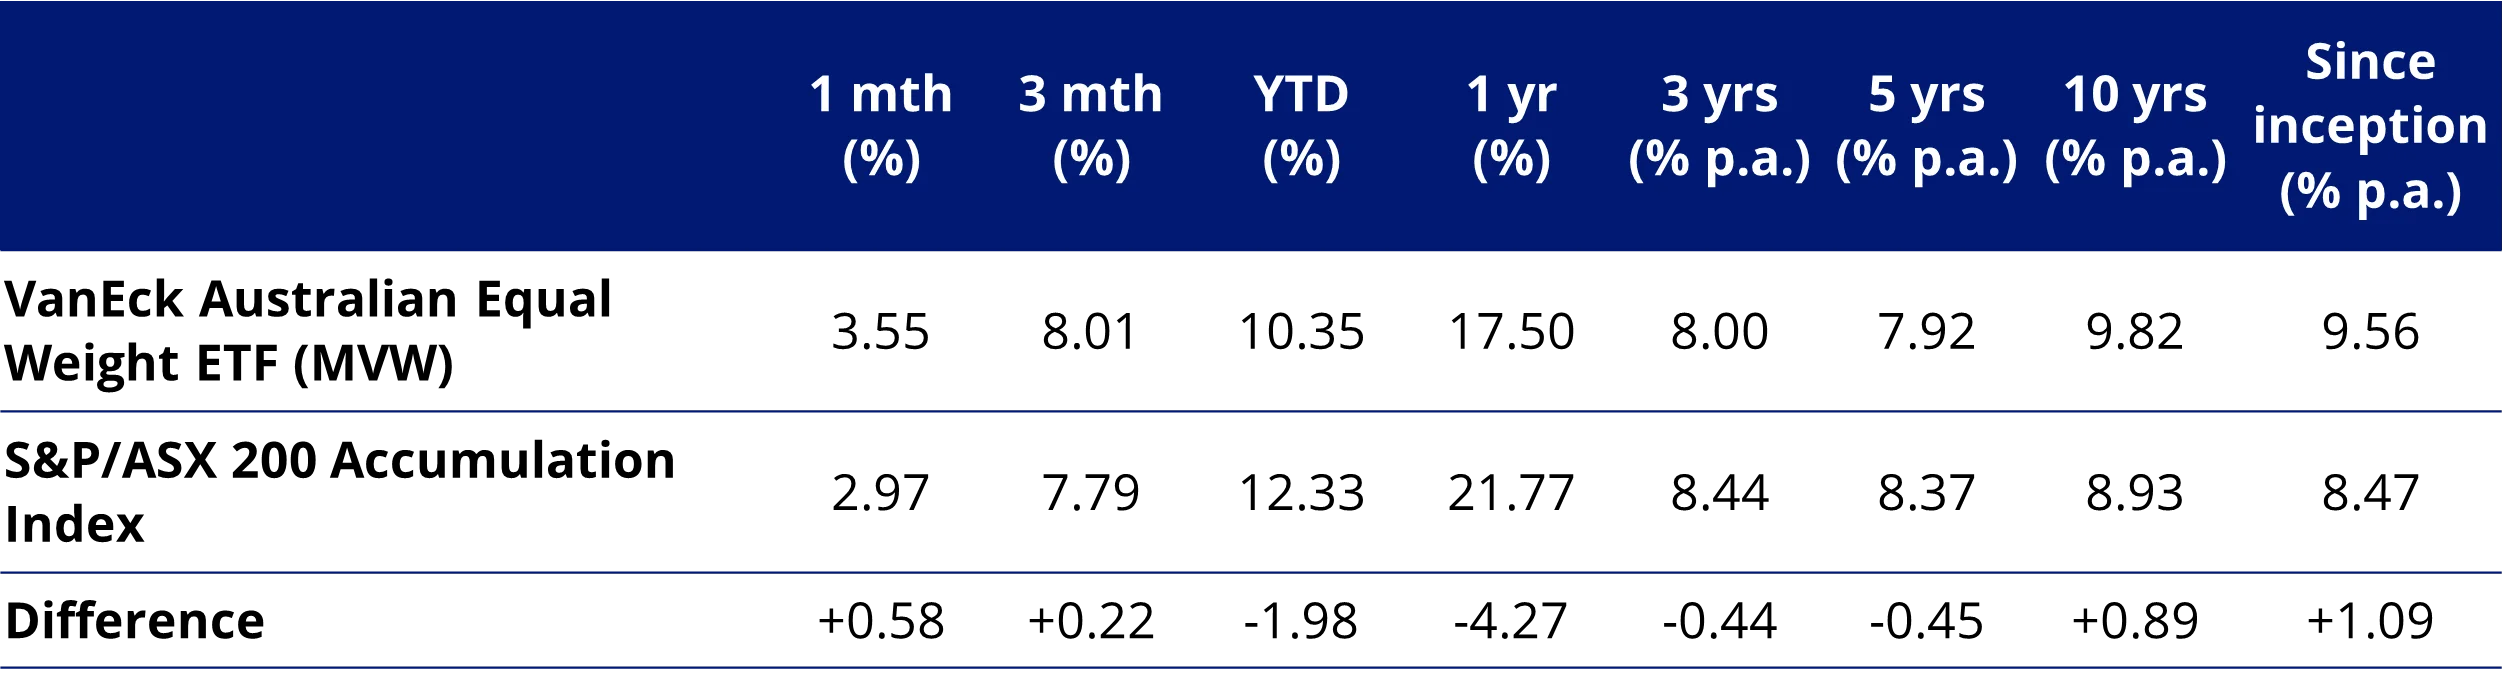
MVW Inception date is 4 March 2014 a copy of the factsheet is here.
Table 1 source: Morningstar Direct, VanEck. The table above shows past performance of MVW and of the S&P/ASX 200. You cannot invest directly in an index. Results are calculated to the last business day of the month and assume immediate reinvestment of distributions. MVW results are net of management fees and other costs incurred in the fund, but before brokerage fees and bid/ask spreads incurred when investors buy/sell on the ASX. Returns for periods longer than one year are annualised. Past performance is not a reliable indicator of future performance. The S&P/ASX 200 Index is shown for comparison purposes as it is the widely recognised benchmark used to measure the performance of the broad Australian equities market. It includes the 200 largest ASX-listed companies, weighted by market capitalisation. MVW’s index measures the performance of the largest and most liquid ASX-listed companies, weighted equally at rebalance. MVW’s index has fewer companies and different industry allocations than the S&P/ASX 200. Click here for more details.
Key risks
An investment in our Australian equal weight ETF carries risks associated with: financial markets generally, individual company management, industry sectors, fund operations and tracking an index. See the VanEck Australian Equal Weight ETF PDS and TMD for more details.
Source
123 September 2024 to 1 October 2024 and is intended to illustrate the short-term impact of China's easing cycle.


Published: 02 October 2024
Any views expressed are opinions of the author at the time of writing and is not a recommendation to act.
VanEck Investments Limited (ACN 146 596 116 AFSL 416755) (VanEck) is the issuer and responsible entity of all VanEck exchange traded funds (Funds) trading on the ASX. This information is general in nature and not personal advice, it does not take into account any person’s financial objectives, situation or needs. The product disclosure statement (PDS) and the target market determination (TMD) for all Funds are available at vaneck.com.au. You should consider whether or not an investment in any Fund is appropriate for you. Investments in a Fund involve risks associated with financial markets. These risks vary depending on a Fund’s investment objective. Refer to the applicable PDS and TMD for more details on risks. Investment returns and capital are not guaranteed.