Carbon markets could be set for upswing
Analyse recent performance and key trends in global compliance carbon markets. Explore regulatory shifts and market dynamics that may drive carbon prices upward.
The compliance carbon market was relatively subdued in July, with the ICE Global Carbon Total Return Australian Dollar Index down 1.62%. However, several market trends and regulatory changes on the horizon could see the market pick up over the remainder of the year.
European Union Emission Trading System
European Carbon Emission Allowance Futures (EUAs), the largest constituent within the index (approximately 45% weight), trended down for the first half of the month before regaining momentum and ending 5.7% higher in AUD. With the political leadership change done and dusted, market movement returned to the standard demand and supply dynamic:
- Demand:
The power demand of the European summer has been the main focus. This year has been a tale of two halves, with the North proving to be cooler than the South. Natural gas prices have stabilised to the five-year average after a significant spike in 2022 from the Russian-Ukraine conflict, and this has been a preferred source of power generation over coal. As burning gas generates approximately 50% less carbon dioxide, this preference may hinder the upside of EUAs. On a positive note, we are also seeing reduced output from clean energy generation, including cuts in the French nuclear output, which makes fossil fuels a plausible source if gas prices continue to rise over the next few months.
- Supply:
July saw the highest volume in carbon allowance auctions this year. The auction volume from member states in 2024 decreased to 373 million (down from 394 million in 2023), however the total auction volume for 2024 is 15% higher than last year. This has primarily been driven by an increased effort to raise funds for the EU’s Innovation Fund and Modernisation Fund, as well as the front-loading of an additional 51.4 million allowances allocated to the REPowerEU Plan. However, an excess of 830 million allowances will reportedly be removed from the market leading up to the compliance deadline for surrendering allowances on 30 September (according to BloombergNEF), and this could be supportive of the EUA price.
Chart 1: EU ETS 2024 monthly auction volumes
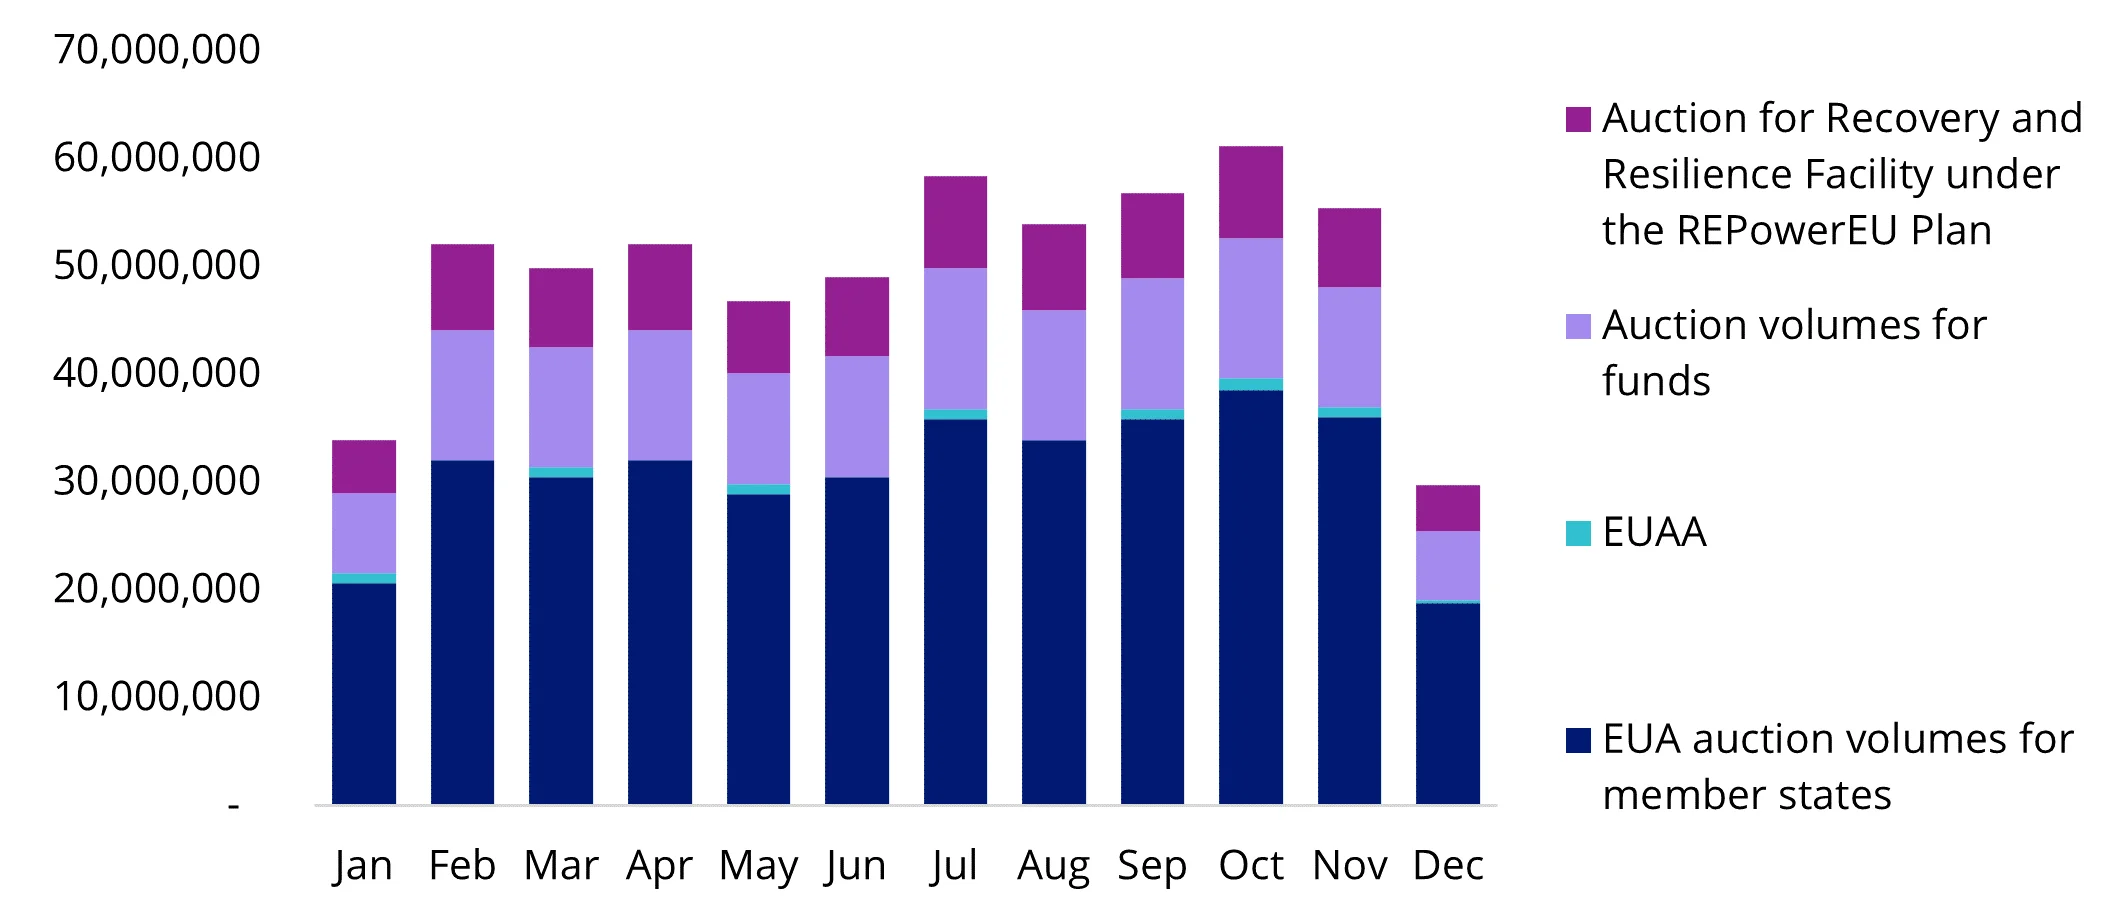
Source: BloombergNEF. Auction volumes for funds include Innovation Fund and Modernisation Fund. EUAA refers to EU Aviation Allowance.
Regional Greenhouse Gas Initiative
Further west in the United States, the Regional Greenhouse Gas Initiative (RGGI) announced in July that a marginally lower allotment of 15,943,608 CO2 allowances would be available for the upcoming September auction, compared to June. As the cost containment reserve (CCR) was exhausted after the March auction, there will be no further caps in auction prices (US$15.92 per short ton in 2024) for the remainder of the year based on the design of the mechanism. Less supply could be supportive of the auction price.
Chart 2: RGGI auction results

Source: RGGI. Data to 1 August.
In July, the RGGI also reported on how revenues from the program were being reinvested. More than $350 million in proceeds from 2022 have been invested in energy efficiency, clean and renewable energy, beneficial electrification, greenhouse gas abatement and climate change adaptation, and direct bill assistance.
California Cap-and-Trade Program
California Carbon Allowances (CCAs) have experienced some downward pressure since April. The latest workshop by the California Air Resources Board (CARB) indicated two alternative cap trajectories out to 2045. However, bearish sentiment arose as the proposed cap adjustment is not due to start until 2026 (rather than 2025, as anticipated). In our view, this may be a good entry point as the state’s long-term emission reduction goal remains intact: GHG emissions cut by 85% below 1990 levels and carbon neutrality achieved by 2045.
Performance update
Chart 3: Performance in AUD

Source: Bloomberg as at 31 July 2024. Past performance is not indicative of future performance.
Abbreviation used: EUA = EU emission allowance futures; UKA = UK emission allowance futures; RGGI = Regional Greenhouse Gas Initiative; CCA = California Carbon Allowance.
Investors can gain exposure to global carbon markets by the VanEck Global Carbon Credits ETF (Synthetic) (ASX: XCO2).
Key risks
An investment in VanEck Global Carbon Credits ETF (Synthetic) carries risks associated with: ASX trading time differences, market risk, concentration risk, futures strategy risk, cap and trade risk, currency risk, political, regulatory and tax risks, fund operations and tracking an index. See the VanEck Global Carbon Credits ETF (Synthetic) PDS for details.


Published: 15 August 2024
Any views expressed are opinions of the author at the time of writing and is not a recommendation to act.
VanEck Investments Limited (ACN 146 596 116 AFSL 416755) (VanEck) is the issuer and responsible entity of all VanEck exchange traded funds (Funds) trading on the ASX. This information is general in nature and not personal advice, it does not take into account any person’s financial objectives, situation or needs. The product disclosure statement (PDS) and the target market determination (TMD) for all Funds are available at vaneck.com.au. You should consider whether or not an investment in any Fund is appropriate for you. Investments in a Fund involve risks associated with financial markets. These risks vary depending on a Fund’s investment objective. Refer to the applicable PDS and TMD for more details on risks. Investment returns and capital are not guaranteed.