How fossil fuel demand can drive carbon pricing
Wind speeds were expected to drop in northwest Europe, especially in Germany, which was expected to drop below the seasonal average for well into June. Coinciding with these weather forecasts, British and Dutch wholesale gas prices rose during May. There are concerns about the ability of wind farms to generate enough electricity.
A consequence of the lack of wind in Europe, in line with the increased demand for fossil fuels, is that the price of carbon has also risen.
Driven by this demand, the carbon allowance under the European Union Emissions Trading Scheme (EU ETS) rose 7.3% and allowances under the UK Emissions Trading Scheme (UK ETS) rose 35.1% in May.
As a result of these price movements, the VanEck Global Carbon Credits ETF (Synthetic) (ASX: XCO2), which tracks an index made up of carbon prices from the four most actively traded carbon futures markets, had a particularly strong month. During the recent rally, the carbon price in Europe passed €70/Mt and we believe there is still an asymmetric upside for the price of carbon, which remains at levels too low for carbon emissions reduction targets.
The weather forecast in Europe is for a slight breeze
During May wind speeds were expected to drop in north-west Europe, especially in Germany, where it was expected to drop below the seasonal average for well into June. Industries reliant on wind power to generate electricity have had to seek alternatives, namely natural gas and coal. A consequence of this is that this has also increased demand for carbon allowances, pushing up the price of carbon.
The EUAs (EU allowances covered by the EU ETS), Dec-24 futures rose past €70 per metric tonne during the month. The strength of the carbon credits prices in the bloc has also been attributed to the retirement of coal- and lignite-fired power plants by EU member states, which could lead to as many as 160 million EUAs being voluntarily cancelled by 2030 and in turn drive tighter supply and price uptick over the long term1.
In the other big European carbon market, the UK ETS, the price of carbon has also benefited from the upcoming UK election and how the country will navigate its path towards its climate goals. The opposition Labour Party is considered to have a more ambitious stance on climate action compared to the current Conservative government which has recently been watering-down its commitments.
Chart 1: Prices of major carbon markets in May
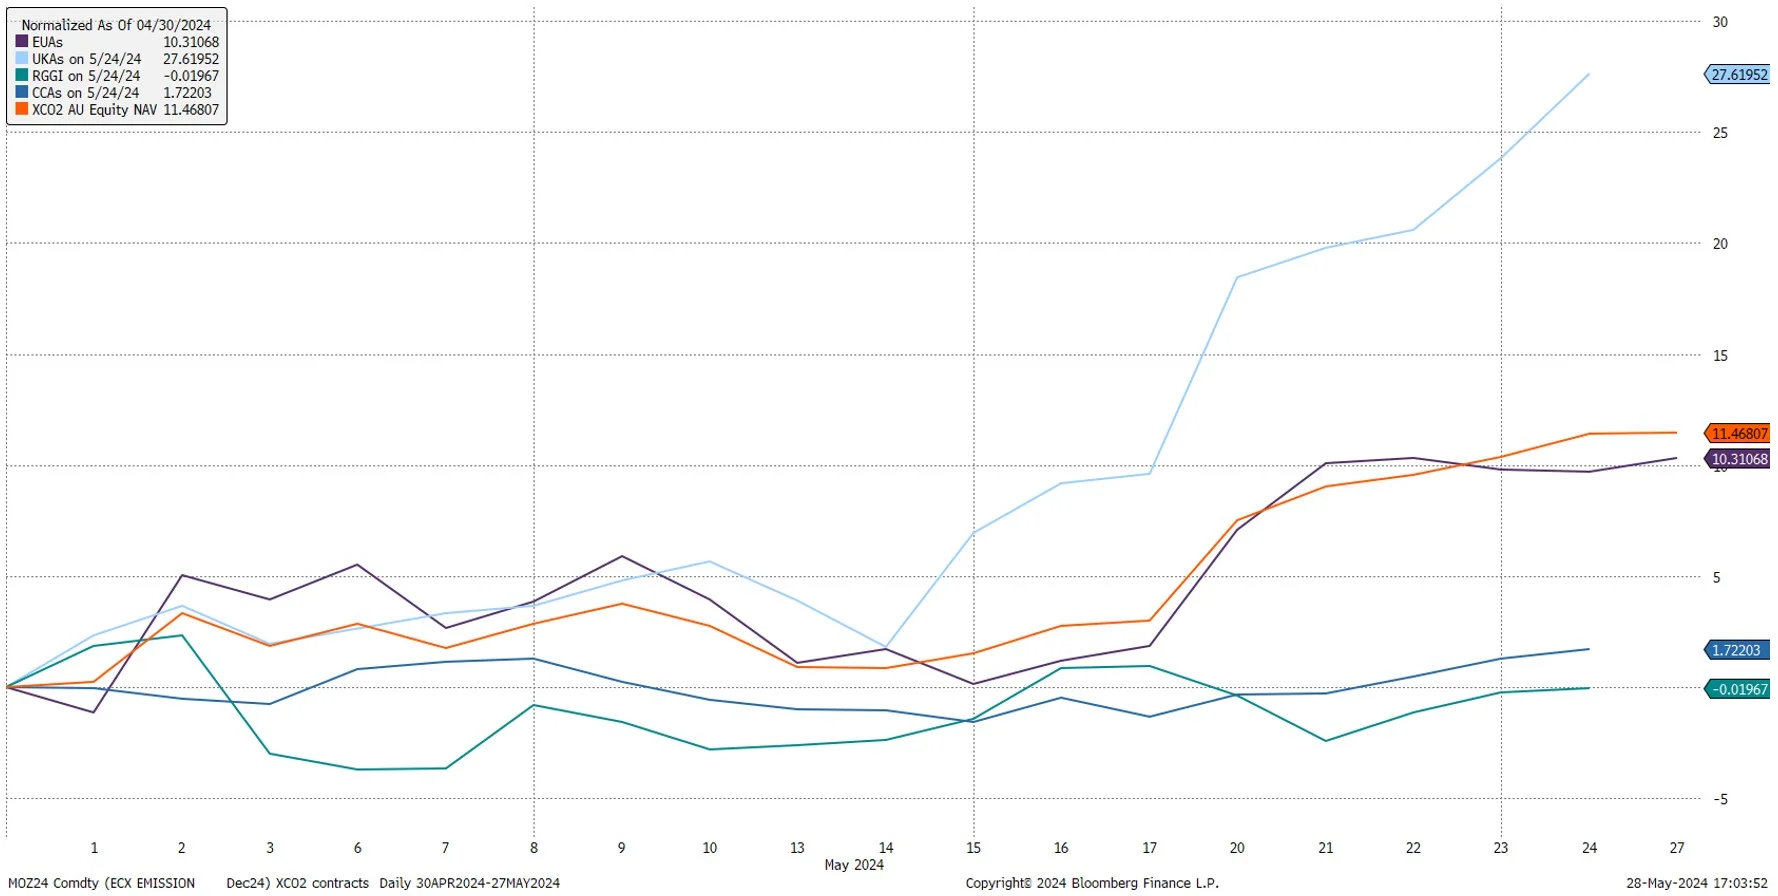
Source: Bloomberg, as at 27 May 2024. Past performance is not indicative of future results.
2024 could end up being a vintage carbon year
We remain bullish on the long-term outlook for carbon permit prices in compliance markets as they remain the policy tool of choice for incentivising carbon abatement. Further, the current environment could potentially be a compelling entry point as demand for carbon increases as the globe transitions to a low-carbon economy.
To achieve agreed goals to limit global temperature increases to 1.5 degrees Celsius (ratified by the Paris Agreement), the World Bank has estimated that a carbon price of US$226-385 per tonne of CO2 emitted is needed by 2030. In chart 2 below, the 2030 carbon price corridor of US$63-127 is based on the recommendations in the report of the High-Level Commission on Carbon Prices to limit temperature rises below 2 degrees Celsius.
Currently, there is room for prices to grow to achieve these outcomes.
Chart 2: Prices and coverage across ETSs and carbon taxes, as of April 1, 2024
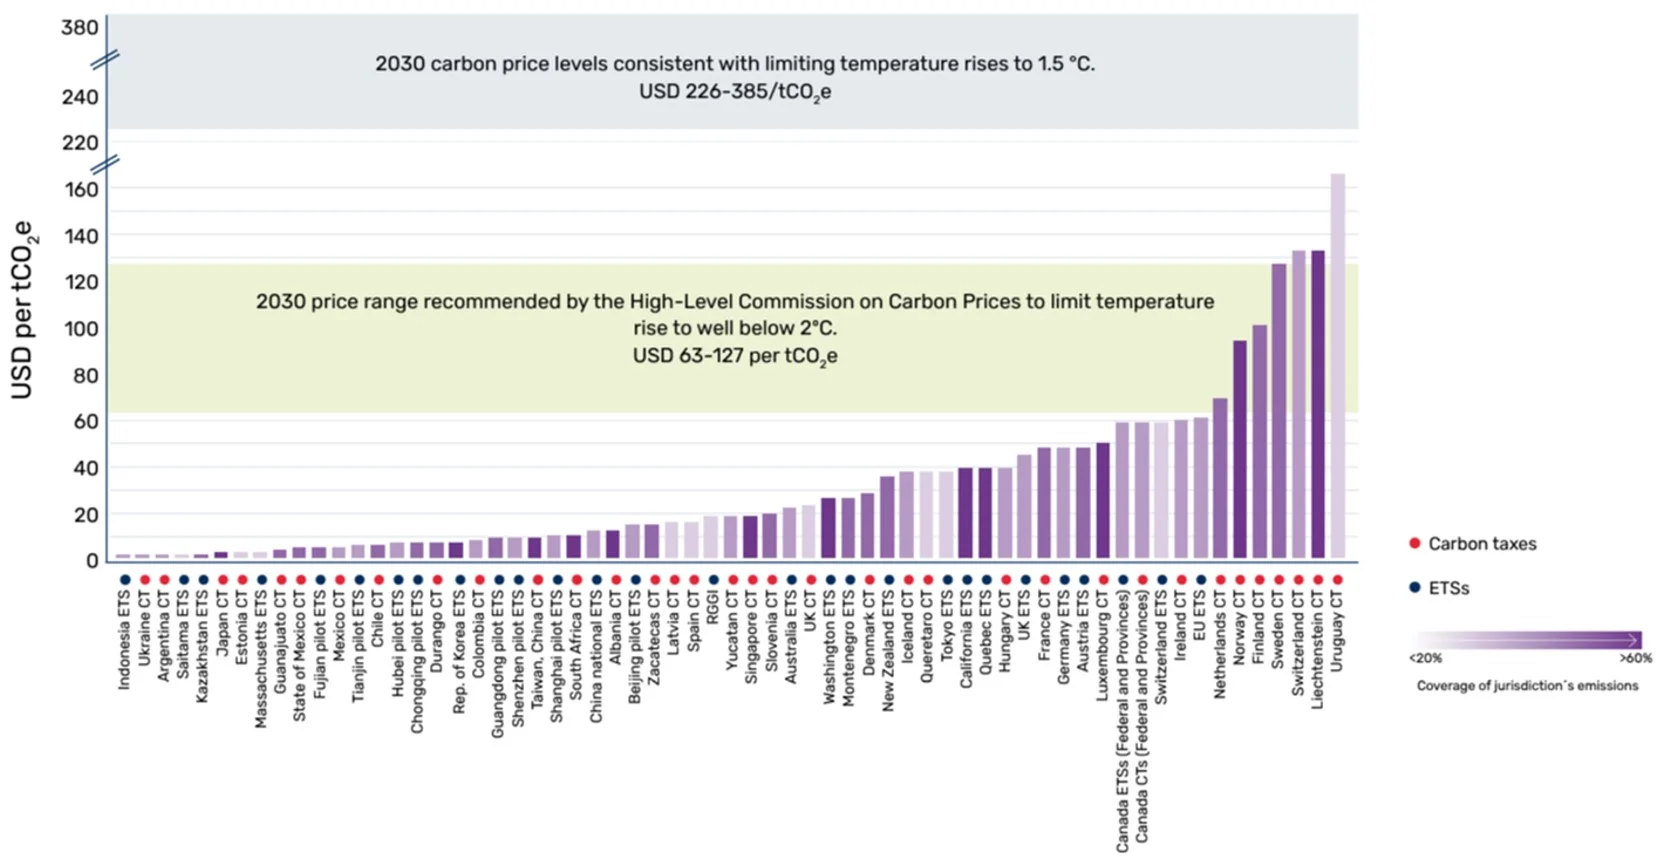
Source: World Bank, State and Trends of Carbon Pricing 2024.
Locally, while Australia does not have a carbon price, the Australian Energy Markets Commission (AEMC) released a report at the end of March that announced an interim value of cutting emissions, starting at A$70 per tonne of carbon dioxide equivalent in 2024. That price should increase steadily to reach A$420/t CO-e by 2050, when Australia aims to reach net zero carbon emissions.
Global authorities agree that the price of carbon should rise to achieve ambitious climate targets. Governments have been reaping rewards, last year global revenues from carbon exceeded US$100 billion for the first time. We think this is an opportunity for investors too.
Chart 3: Evolution of global carbon price revenues over time
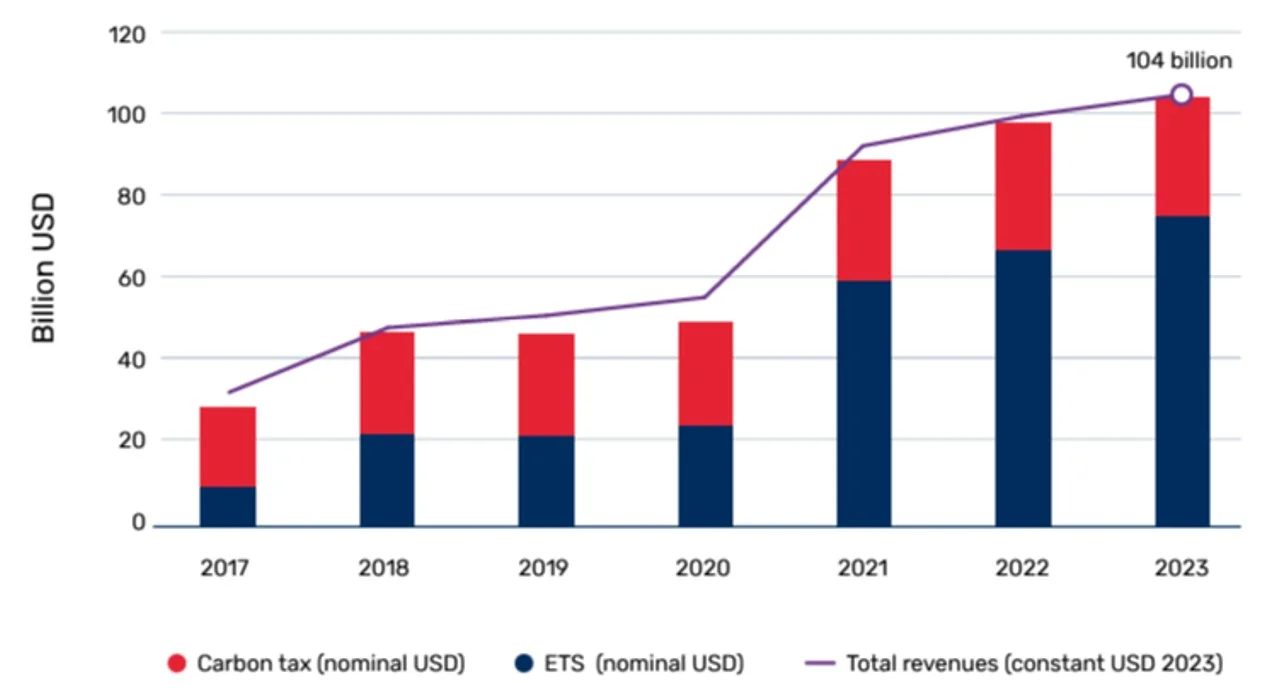
Source: World Bank, State and Trends of Carbon Pricing 2024
Some of the ETS schemes are large. They are also liquid markets. In the four most actively traded carbon markets there were US$628.9 billion worth of futures traded in 2023.
The four most actively traded carbon futures markets in the world are:
- European Union Emissions Trading Scheme (EU ETS), which started in 2005;
- Western Climate Initiative (California Cap and Trade Program), which started in 2013;
- Regional Greenhouse Gas Initiative (RGGI covering many North Eastern US states), which started in 2009; and
- UK Emissions Trading Scheme (UK ETS), which started in 2021.
Together these markets represent some of the largest regional economies in the world and these make up the ICE Global Carbon Futures Index that the VanEck ETF XCO2 aims to track.
Low correlation to other asset classes
One reason many investors are attracted to global carbon futures is because of the low correlation to other asset classes. The table below shows the correlation of XCO2 index since its base date, at the start of 2014, against major asset classes included in most Australian portfolios.
Table 1: ICE Global Carbon Futures Index correlation to other major asset classes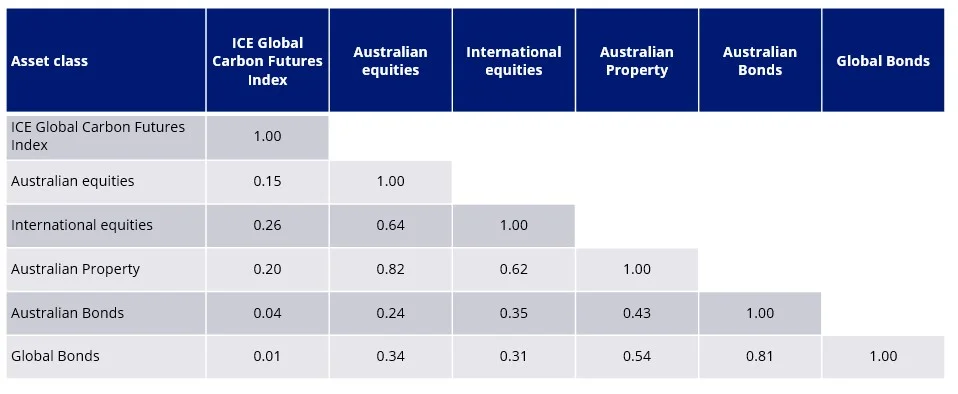
Source: Morningstar Direct, 1 January 2014 to 30 April 2024. ICE Global Carbon Futures Index base date is 1 January 2014. Results are calculated monthly and assume immediate reinvestment of all dividends. You cannot invest in an index. Past performance is not a reliable indicator of future performance. Comparison indices used: Australian Equities – S&P/ASX 200 Accumulation Index, International Equities – MSCI World ex Australia Index, Australian Property – S&P/ASX 200 A-REITs Index, Australian Bonds – Bloomberg AusBond Composite 0+ years, Global Bonds – Barclays Global.
We regularly write about carbon markets – review past posts here.
Key risks: An investment in the ETF carries risks associated with: ASX trading time differences, market risk, concentration risk, futures strategy risk, cap and trade risk, currency risk, political, regulatory and tax risks, fund operations and tracking an index. See the PDS for details.
1Carbon Pulse


Published: 04 June 2024
VanEck Investments Limited (ACN 146 596 116 AFSL 416755) (VanEck) is the issuer and responsible entity of all VanEck exchange traded funds (Funds) trading on the ASX.This is general advice only and does not take into account any person’s financial objectives, situation or needs. The product disclosure statement (PDS) and the target market determination (TMD) for all Funds are available at vaneck.com.au. You should consider whether or not an investment in any Fund is appropriate for you. Investments in a Fund involve risks associated with financial markets. These risks vary depending on a Fund’s investment objective. Refer to the applicable PDS and TMD for more details on risks. Investment returns and capital are not guaranteed.
ICE is a registered trademark of ICE Data Indices, LLC or its affiliates. This trademark has been licensed, along with the ICE Global Carbon Futures Index (“Index”) for use by VanEck in connection with XCO2 (the “Product”). Neither VanEck nor the Product(s), as applicable, is sponsored, endorsed, sold or promoted by ICE Data Indices, LLC, its affiliates or its third party suppliers (“ICE Data and its Suppliers”). ICE DATA AND ITS SUPPLIERS MAKE NO REPRESENTATIONS OR WARRANTIES REGARDING THE ADVISABILITY OF INVESTING IN SECURITIES GENERALLY, IN THE PRODUCT(S) PARTICULARLY, OR THE ABILITY OF THE INDEX TO TRACK GENERAL MARKET PERFORMANCE. ICE DATA AND ITS THIRD PARTY SUPPLIERS ACCEPT NO LIABILITY IN CONNECTION WITH THE USE OF THE INDEX, INDEX DATA OR MARKS. See PDS for a full copy of the disclaimer. © 2025 Van Eck Associates Corporation. All rights reserved.