Politics at play for the cost to pollute
Beating all other mainstream asset classes, carbon credit futures was the top performing asset class* this quarter, returning 7.2% to 30 June 2024. Find out what is driving this performance in this month’s carbon markets analysis.
It is election season, with Continental Europe and the UK hitting the polls in June and July, causing some short-term volatility in the two respective compliance carbon markets.
EUAs – the carbon allowance futures instrument to access the longest-standing European market, hit a recent high of €76.25/Mt although ended June 10% lower off the back of concern that the right-leaning parties may undermine the Bloc’s climate ambitions. The new Parliament will have a say in areas such as the 2040 Climate Target, as well as the implementation of ETS2, a new emissions trading system announced in 2023 which will cover and address the CO2 emissions from fuel combustion in buildings, road transport and additional sectors. Having said that, most of the European Green Deal has been implemented since its presentation in 2019; the possibility of revoking the existing climate policies would be very low.
The UK’s carbon market also had a bumpy ride in June. The UKA price shot up above £50/Mt mid-June, a level we have not seen since October 2023, and finished 6% lower. In what was a highly predicted outcome, the UK election produced a center-left Labour Party win. The Party is considered more environmentally friendly and the change of government could be a catalyst for nation’s carbon price to converge to its European counterpart.
Another bullish trading signal is that traders having been building net long UKA positions since the start of February. Commitment of Trader data suggests that investment funds reversed short positions in March, followed by record-high net long positions in June.
EUA and UKA prices

Source: BloombergNEF as at 28 June 2024. Past performance is not indicative of future performance.
UKA number of contracts held by investment funds
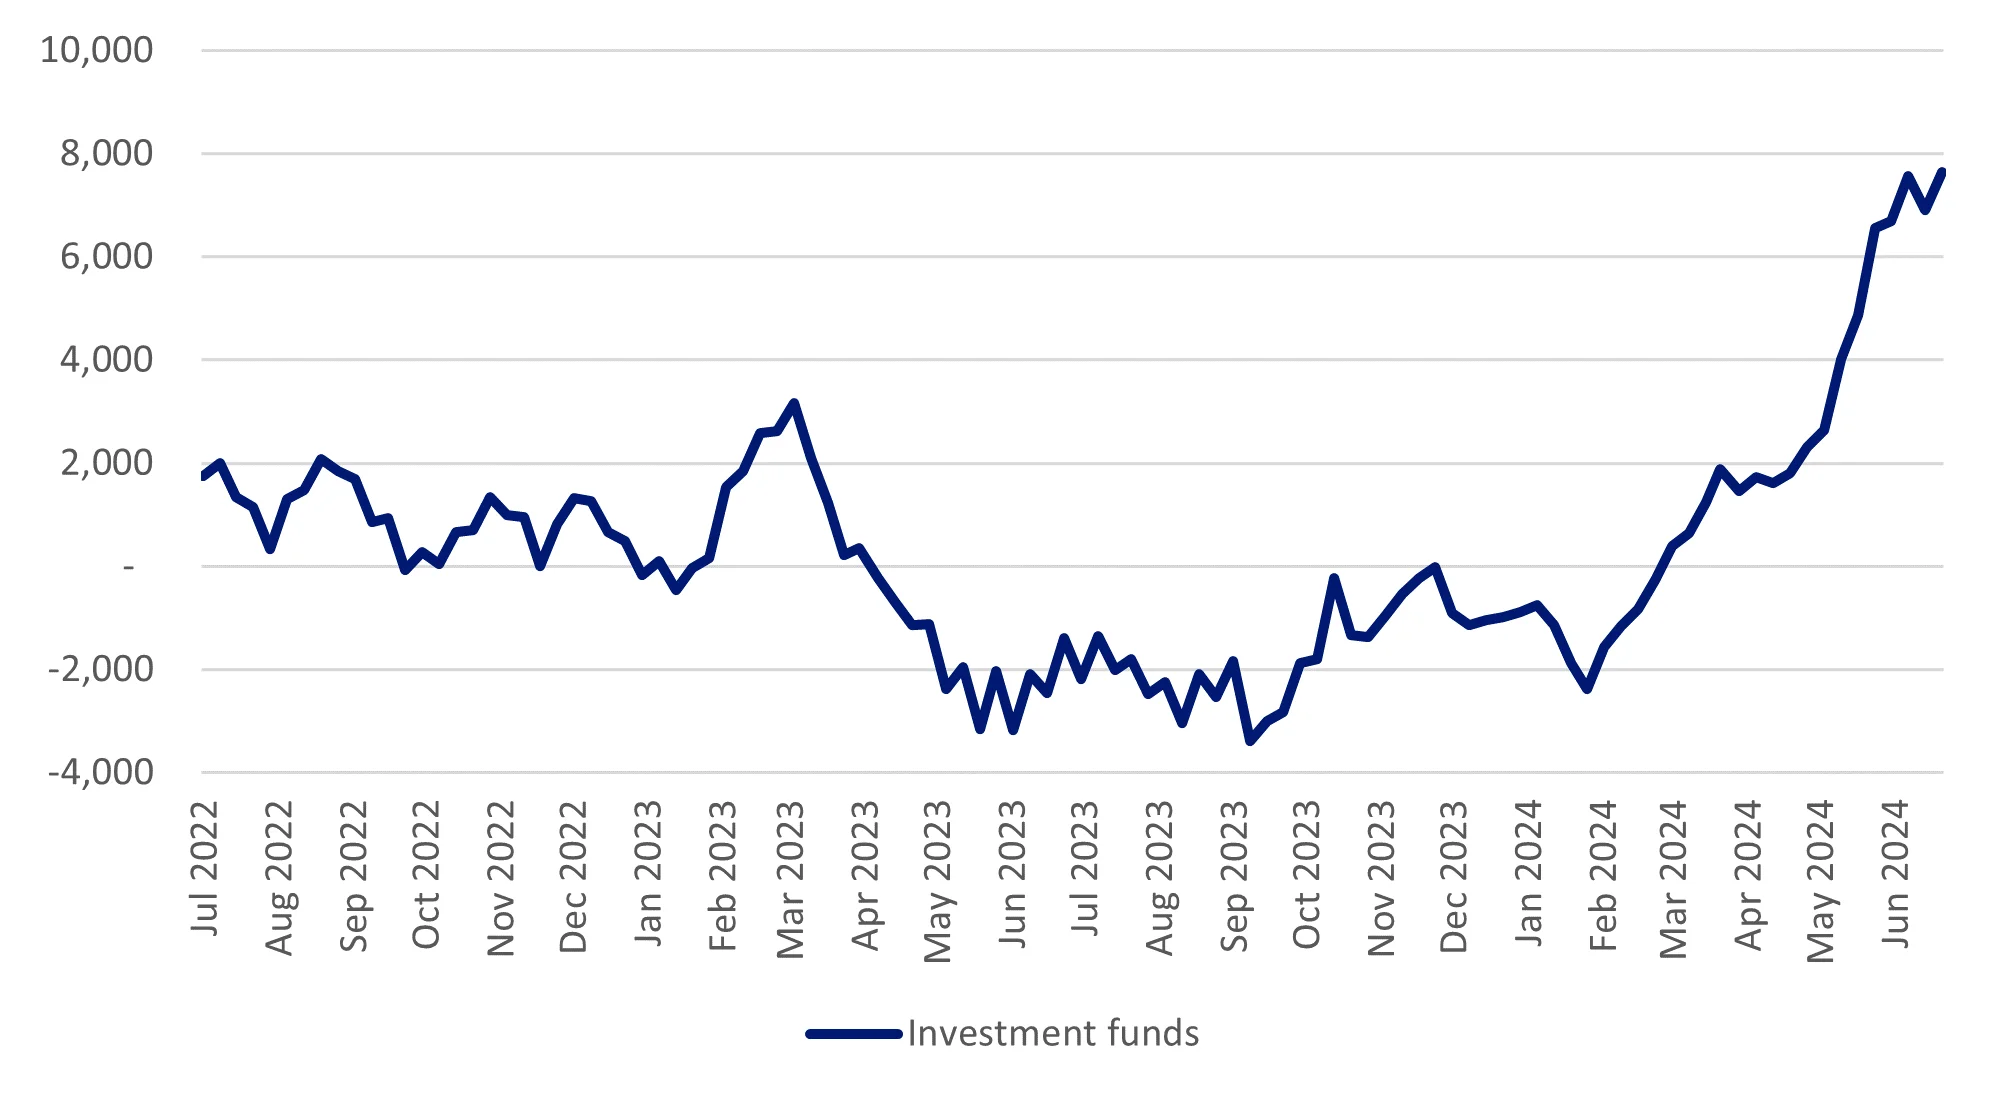
Source: BloombergNEF as at 28 June 2024.
Election fever is also stateside, the November Presidential election will be one of the biggest political events to watch this year, which will also determine the pace of achieving climate target for the US.
During June we also had the quarterly auctions for both RGGI and CCAs.
We are yet to see RGGI’s price ascent slow down any time soon. The auction cleared all quota at an all-time high of $21.03 per short ton of CO2, which is 31% higher than 24Q1 and 65% higher than 23Q2. The fact that the cost containment reserve (CCR) allowances have been exhausted last quarter means that there will be no auction price cap for the remaining of the calendar year. The CCR is a fixed additional supply of allowances that are made available for sale if an auction’s interim clearing price exceeds a certain price level ($15.92 in 2024). The statistics published by RGGI indicates a high participation rate of 76% by Compliance Entities, while ratio of bids to supply also remains elevated at 2.7x, in other words, the total dollar amount of bids is 2.7 times higher than that of supply.
On the other hand, in California, the second quarterly auction for the year saw the clearing price ($37.02/Mt) dipping 11% from the last quarter ($41.76/Mt), yet still 22% higher compared to the same time last year ($30.33/Mt). The recent price action is on the back of the regulator’s market rule update regarding reducing the volume of allowances market participants can hold. This tweak is estimated to free up over 20 million allowances, leading to a short-term increase of supply in the market. The state is also exploring the opportunity of linking the program with Washington, a state with more stringent market design.
RGGI auction clearing price
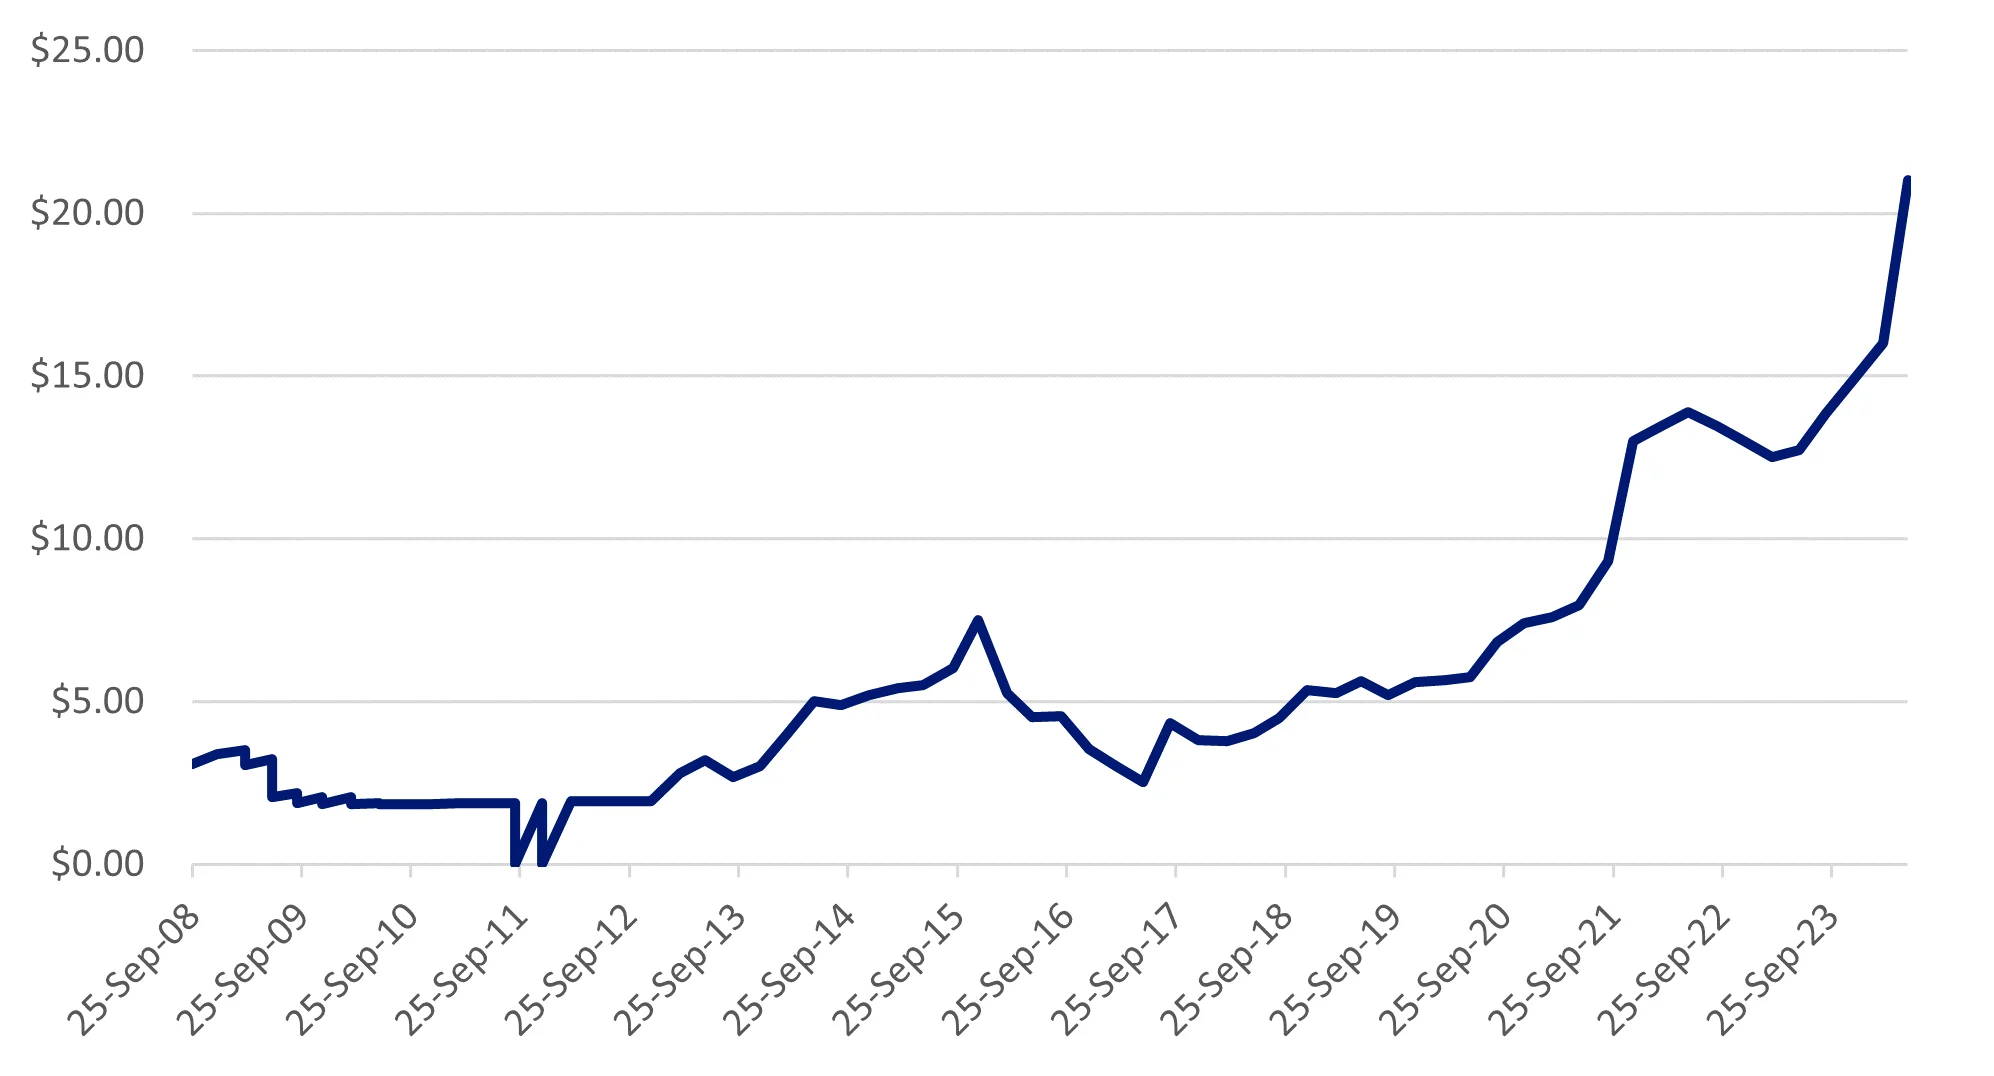
Source: RGGI
CCA auction clearing price
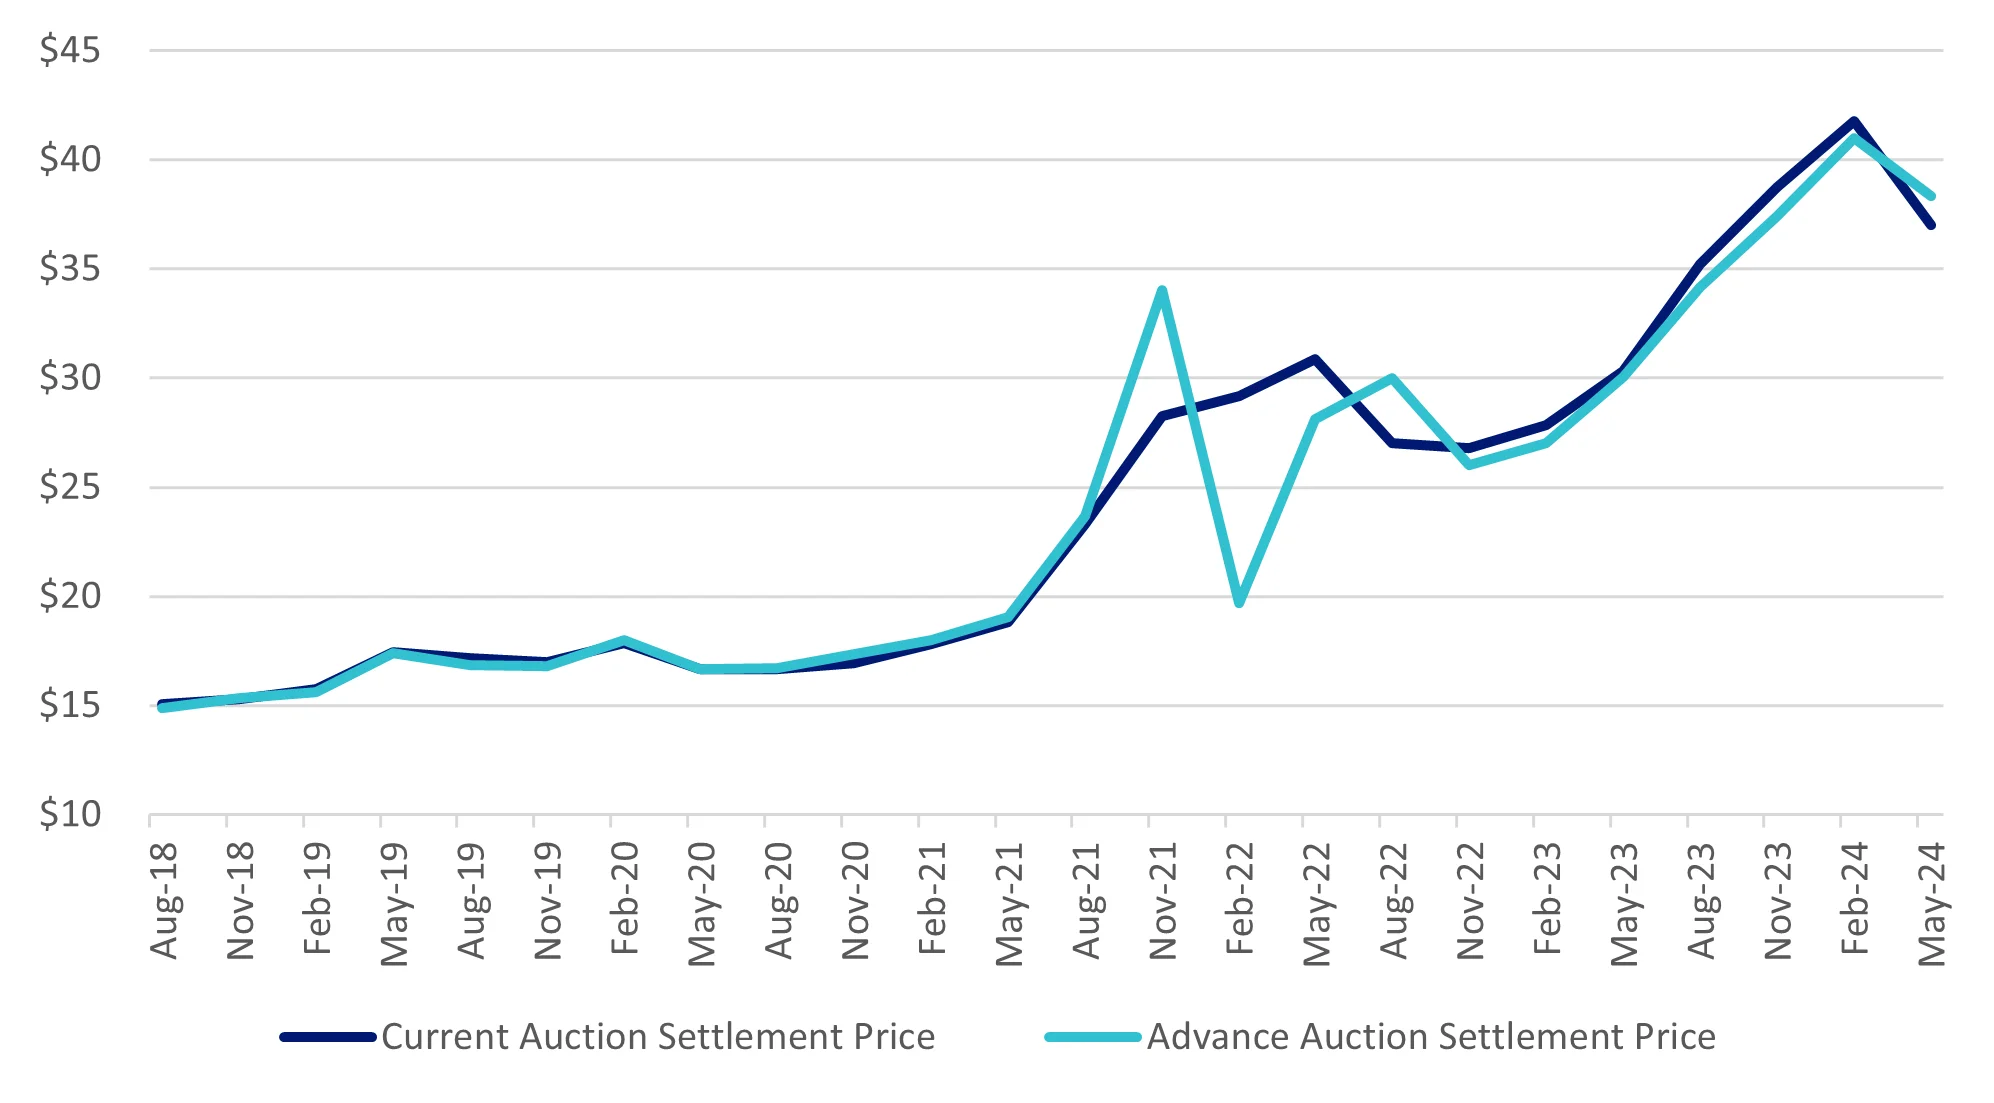
Source: CARB
VanEck Global Carbon Credits ETF (Synthetic) (ASX: XCO2) returned -5.64% for the month of June 2024.
Performance in AUD

Source: Bloomberg as at 28 June 2024
Abbreviation used: EUA = EU emission allowance futures; UKA = UK emission allowance futures; RGGI = Regional Greenhouse Gas Initiative; CCA = California Carbon Allowance.
*Global credits futures as represented by ICE Global Carbon Futures Index.
Key risks
An investment in VanEck Global Carbon Credits ETF (Synthetic) carries risks associated with: ASX trading time differences, market risk, concentration risk, futures strategy risk, cap and trade risk, currency risk, political, regulatory and tax risks, fund operations and tracking an index. See the VanEck Global Carbon Credits ETF (Synthetic) PDS for details.


Published: 09 July 2024
Any views expressed are opinions of the author at the time of writing and is not a recommendation to act.
VanEck Investments Limited (ACN 146 596 116 AFSL 416755) (VanEck) is the issuer and responsible entity of all VanEck exchange traded funds (Funds) trading on the ASX. This is general advice only and does not take into account any person’s financial objectives, situation or needs. The product disclosure statement (PDS) and the target market determination (TMD) for all Funds are available at vaneck.com.au. You should consider whether or not an investment in any Fund is appropriate for you. Investments in a Fund involve risks associated with financial markets. These risks vary depending on a Fund’s investment objective. Refer to the applicable PDS and TMD for more details on risks. Investment returns and capital are not guaranteed.