Rap rivalry revived in carbon credits
The carbon markets are summoning the ghosts of hip-hop’s past, with east coast-based Regional Greenhouse Gas Initiative steadily gaining on the west coast-based California Cap-and-Trade Program.
A similar east vs west rivalry is starting to emerge in the carbon credits market. The latest August numbers show there is only a small difference now in prices for carbon credits from the Regional Greenhouse Gas Initiative (RGGI) and California Cap-and-Trade Program (CCA). In fact, the gap has only been narrower once before, in November/December 2015, when CCAs were US$12.73 and RRGI was at US$7.50 per ton.
Chart 1: US carbon prices YTD (AUD)
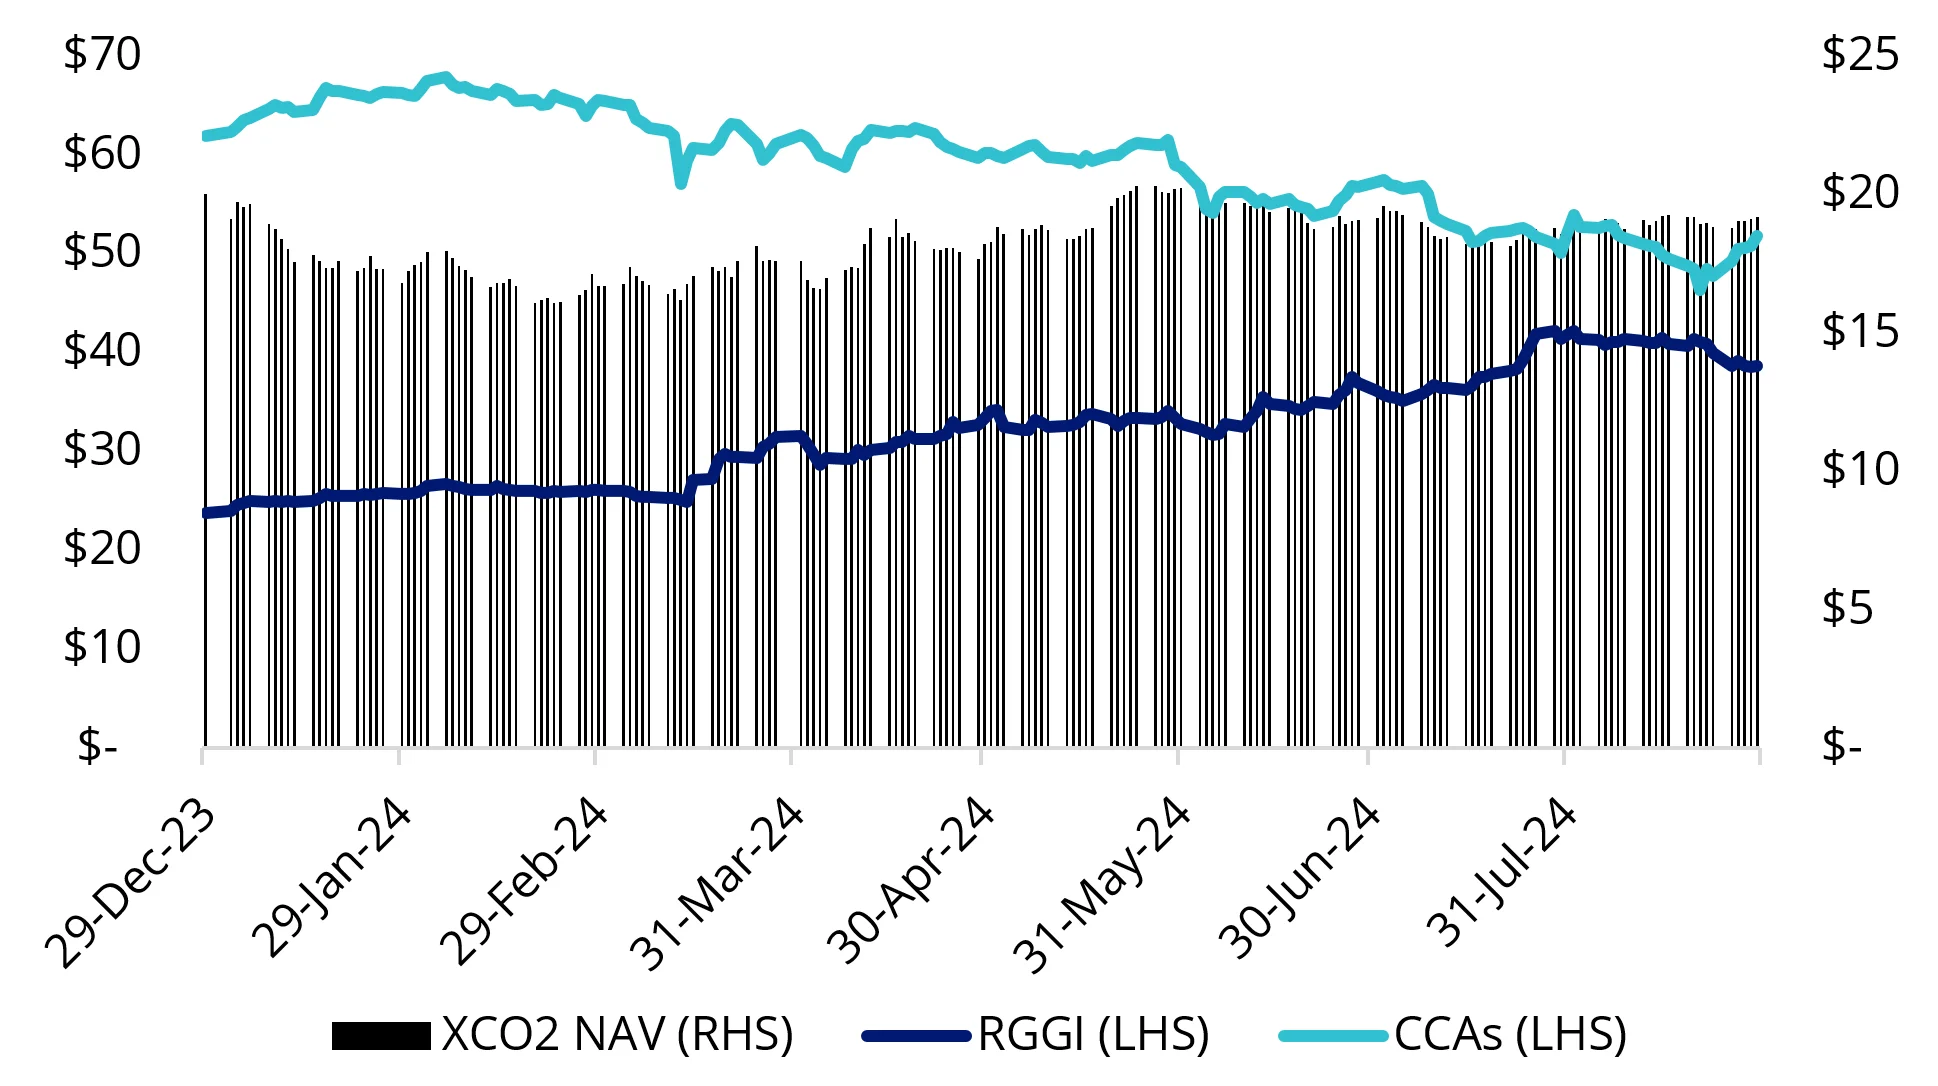
Source: Bloomberg as at 30 August 2024. Abbreviations used: XCO2 = VanEck Global Carbon Credits ETF (Synthetic); RGGI = Regional Greenhouse Gas Initiative; CCA = California Carbon Allowance.
This gap may disappear altogether next month, with potential for RGGI to continue its rally and surpass CCA prices for the first time.
East coast: Regional Greenhouse Gas Initiative (RGGI)
RGGI December 24 futures surged to an all-time high of US$27.85/short ton on 20 August 2024. While the price retracted by month end, it has still skyrocketed 62% in AUD this year to the end of August.
The auction coming up in September should be another tailwind for RGGI prices, as the auction volume allotment is scheduled to be lower than the previous quarter. As mentioned in a previous blog, auction prices for the rest of year will not have an upper limit, as the cost containment reserve (CCR) has been exhausted. By design, there will be no reserve allowances made available to the market to contain prices for the period.
The last couple of auction rounds show robust demand by the participants, as shown in the elevated cover ratio (ratio of bids to initial supply) chart below.
Chart 2: RGGI cover ratio
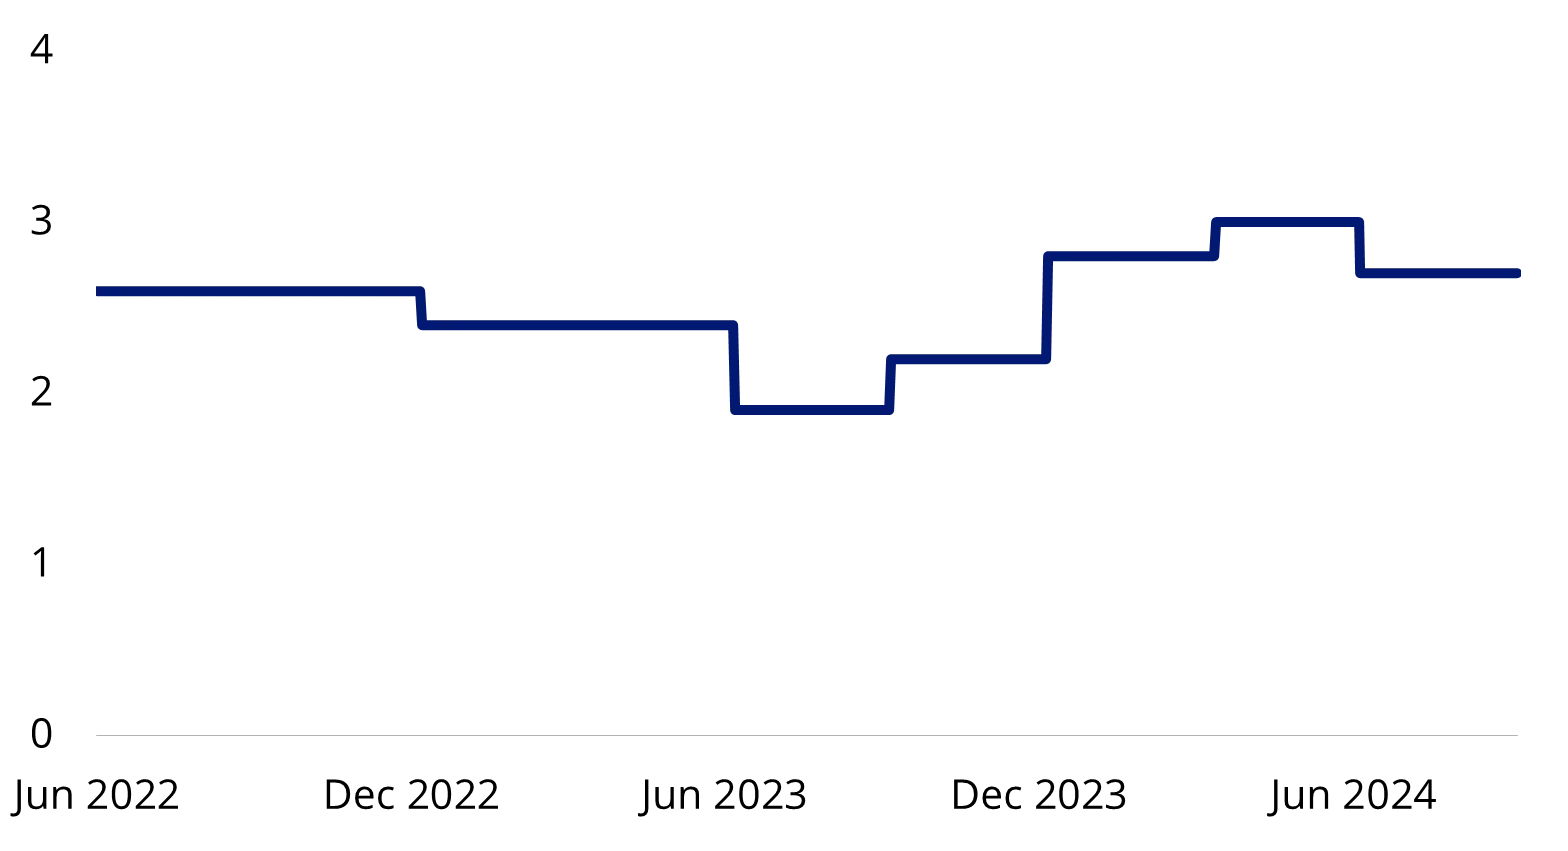
Source: RGGI as at 5 June 2024.
Looking at the secondary market flows, producers have ramped up their long positions while decreasing shorts. Producers are one of the biggest players in the secondary market and usually engage in the production of a physical commodity and utilise futures to hedge risks.
Chart 3: Net positions for futures contracts
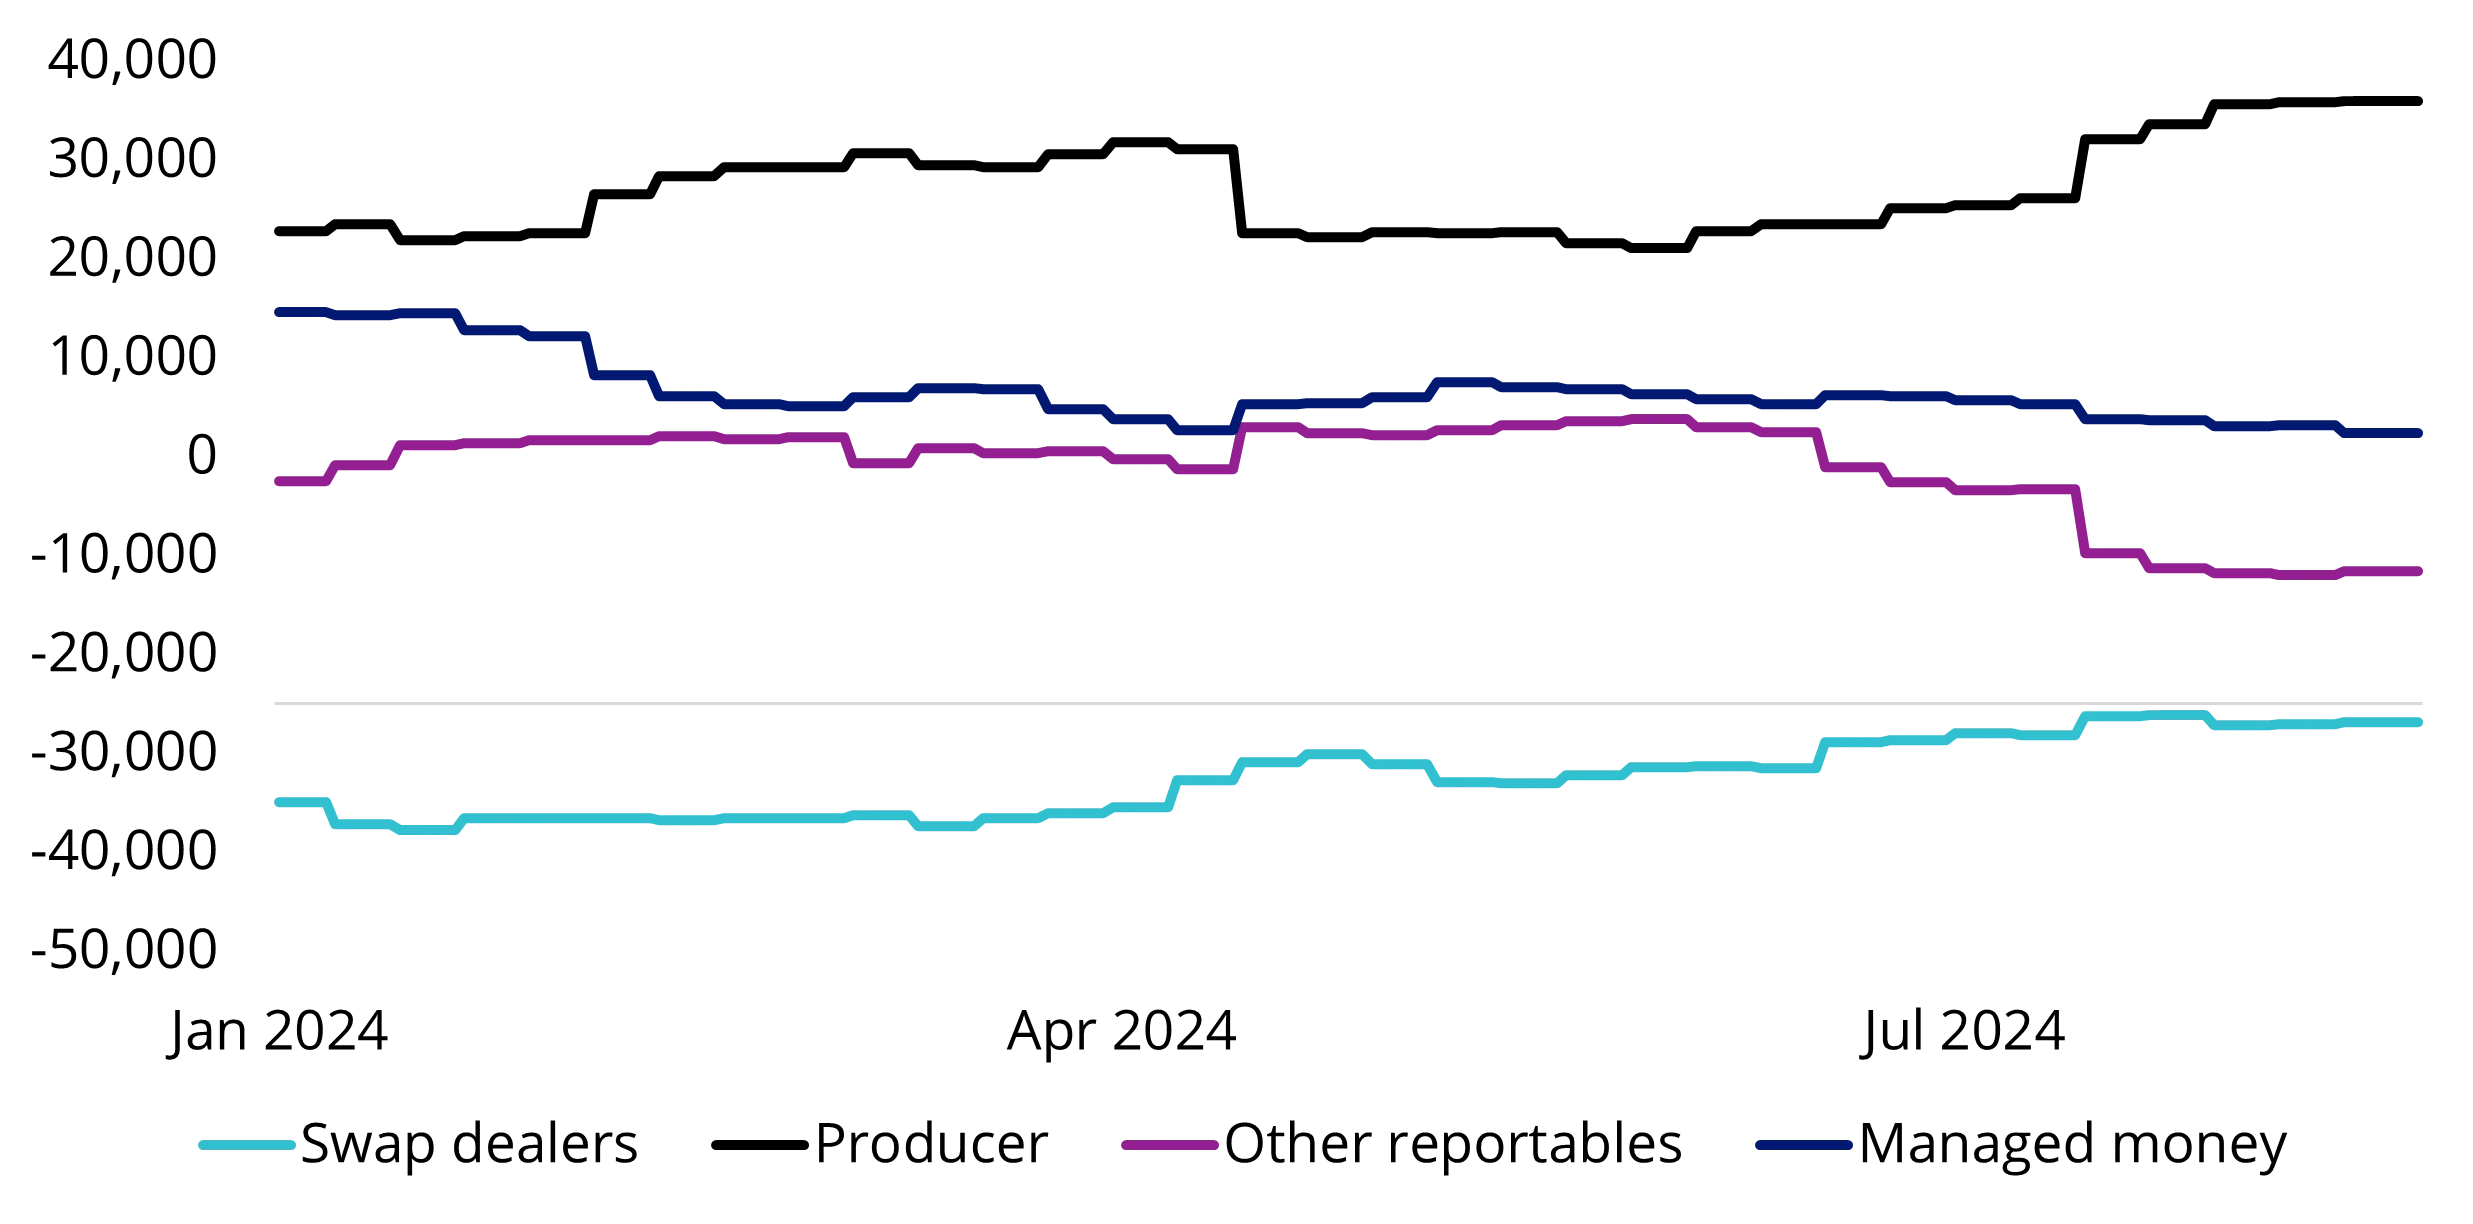
Source: BloombergNEF as at 3 September 2024.
West coast: California Cap-and-Trade Program (CCA)
CCA’s third quarterly auction was held in August, where we saw downward pressure in the clearing price ($30.24/Mt) again following the auction dip in May. It is now back to the Feb 2023 auction price level.
Despite auction volume being close to 1% lower quarter on quarter, it was insufficient to maintain the record price level we saw at the start of the year. The futures price also reflected the auction disappointment, but experienced a V-shape rebound towards the end of the month, closing only 0.34% lower in August in AUD.
Our view is that the bearish sentiment with regards to the delay of implementation of cap adjustment by the California Air Resources Board (CARB) could be an overreaction. However, we see a need for CARB to announce its decision on the future allowance supply sooner rather than later.
The recent price volatility may only be temporary. We expressed previously that the State’s long-term emission reduction goal remains intact, which could see the price pickup in the remaining months of the year.
Chart 4: CCA auction clearing price
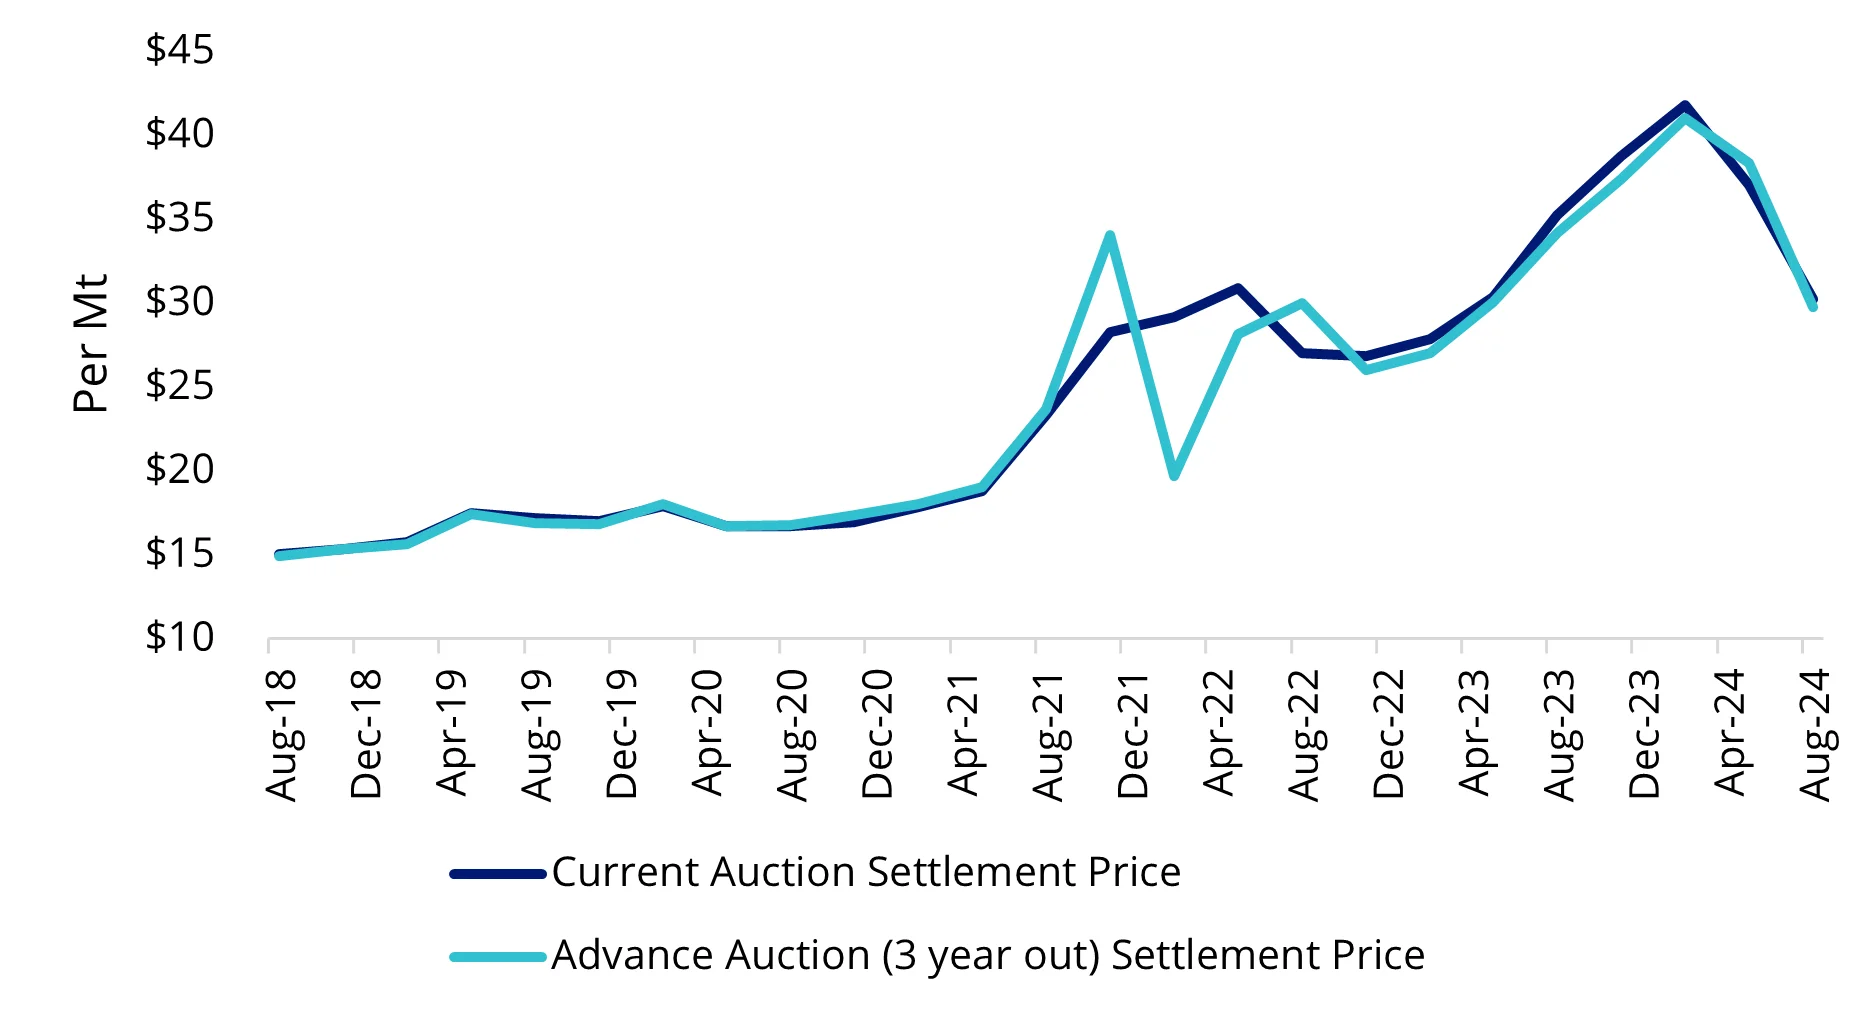
Source: California Air Resources Board, as at 3 September 2024.
While the legendary hip hop rivalry of the 90s ended in tragedy, the carbon credits market is far more amicable, and picking a side is not required. The VanEck Global Carbon Credits ETF (Synthetic) (ASX: XCO2) gives investors exposure to both carbon credit schemes in the US, as well as the emissions trading schemes in the EU and UK.
With carbon prices lowly correlated to conventional asset classes, a targeted exposure to the carbon price could potentially hedge the impact of increasing carbon prices on investor’s portfolios.
XCO2 returned +2.1% for the month of August 2024. For performance since the inception of XCO2, please refer to the website.
Key risks
An investment in VanEck Global Carbon Credits ETF (Synthetic) carries risks associated with: ASX trading time differences, market risk, concentration risk, futures strategy risk, cap and trade risk, currency risk, political, regulatory and tax risks, fund operations and tracking an index. See the VanEck Global Carbon Credits ETF (Synthetic) PDS and TMD for more details.


Published: 11 September 2024
Any views expressed are opinions of the author at the time of writing and is not a recommendation to act.
VanEck Investments Limited (ACN 146 596 116 AFSL 416755) (VanEck) is the issuer and responsible entity of all VanEck exchange traded funds (Funds) trading on the ASX. This information is general in nature and not personal advice, it does not take into account any person’s financial objectives, situation or needs. The product disclosure statement (PDS) and the target market determination (TMD) for all Funds are available at vaneck.com.au. You should consider whether or not an investment in any Fund is appropriate for you. Investments in a Fund involve risks associated with financial markets. These risks vary depending on a Fund’s investment objective. Refer to the applicable PDS and TMD for more details on risks. Investment returns and capital are not guaranteed.