Comparing EMKT to active peers in emerging markets
Many investors have been happy to pay higher fees to have a professional active manager to select their best emerging market opportunities. But there could be a more compelling opportunity.
It’s important your emerging markets approach, a) actually invests in emerging markets and b) takes advantage of the best opportunities. To help you assess yours, here we provide an analysis of our popular Multifactor Emerging Markets Equity ETF (EMKT) compared to some active funds.
Not all emerging market companies are desirable from an investment standpoint, many are state-owned enterprises and inefficiencies within these markets allow astute investors to take advantage of mispricing. Importantly, when investing in emerging markets there are other risks to consider such as currency, geopolitical, economic, market and sector risks. This is why many investors have been happy to pay higher fees for a professional active manager to select the best-emerging market opportunities.
Active managers aim to outperform the benchmark index. When it comes to emerging market equity investing, the widely used benchmark is the MSCI Emerging Markets Index, for ease of reading let’s call it the MSCI EM Index. Active emerging market managers are trying to outperform this index. If the MSCI EM Index rises 10%, investors would expect their active manager to return higher than 10%. Likewise, when the MSCI EM Index falls 10%, investors expect their fund manager to not fall by more than 10%.
Innovations in index design are also being used by investors to deliver above-market benchmark returns over the long term. It is this approach VanEck offers in emerging market equities, and savvy investors are using it as a substitute for both.
VanEck MSCI Multifactor Emerging Markets Equity ETF (ASX: EMKT) tracks the MSCI Emerging Markets Multi-Factor Select Index (EMKT Index) and it provides investors with diversified access to companies that demonstrate four factors: Value, Momentum, Low Size and Quality. Factors are identifiable, persistent drivers of risk and return.
We recently released a white paper supporting this approach. Taking a diversified approach across factors has been proven to produce outperformance over the long term compared to a benchmark market capitalisation approach in emerging markets.
So, let’s walk through EMKT, how it compares with active managers, and what we think investors should consider. We believe investors should assess performance, the costs and the exposure, i.e. are you truly getting emerging markets exposure?
Let’s get started.
EMKT vs active emerging markets – Performance
EMKT launched on ASX in April 2018 and has demonstrated strong outperformance since its inception, as highlighted by the table below. As always, it is important to note that past performance is not indicative of future performance.
Table 1: Performance as at 31 May 2024
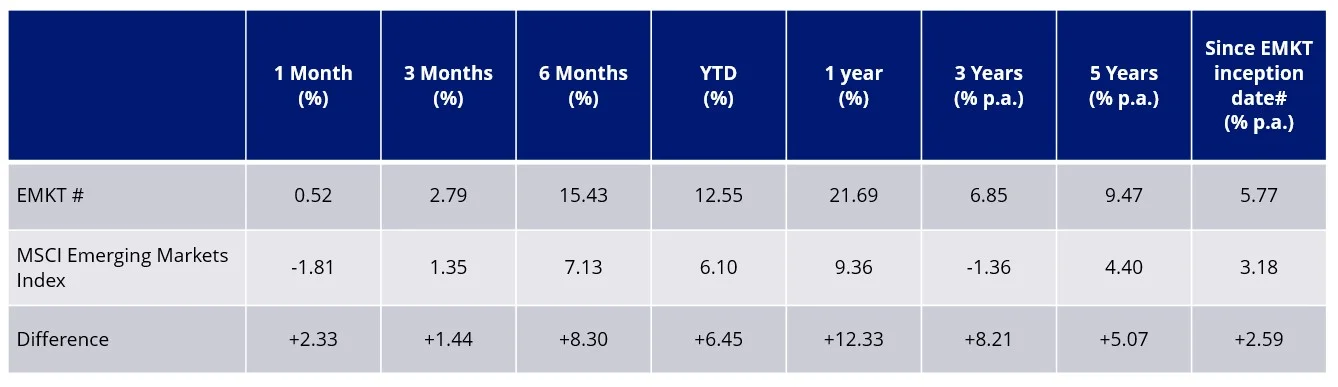
Source: VanEck, Morningstar Direct. #EMKT inception date is 10 April 2018 and a copy of the factsheet is here. Results are calculated to the last business day of the month and assume immediate reinvestment of distributions. EMKT Performance is calculated net of management fees and costs incurred in the fund, calculated daily but does not include brokerage costs or buy/sell spreads of investing in EMKT. Past performance is not a reliable indicator of future performance. Returns longer than one year are annualised. The MSCI Emerging Markets Index (“MSCI EMI”) is shown for comparison purposes as it is the widely recognised benchmark used to measure the performance of emerging markets large- and mid-cap companies, weighted by market capitalisation. EMKT’s index measures the performance of emerging markets companies selected on the basis of their exposure to value, momentum, low size and quality factors, while maintaining a total risk profile similar to that of the MSCI EMI, at rebalance. EMKT’s index has fewer companies and different country and industry allocations than MSCI EMI. Click here for more details
EMKT’s performance is impressive, relative to its index. It is worth considering its performance, relative to its peers. EMKT’s performance puts it in the top quartile of active peers over all the trailing periods noted in the table above. It is worth noting in Chart 1 below, that the MSCI Emerging Markets index has beaten more than 50% of active emerging market managers in all of those trailing periods except over one month. In other words over 50% of active managers are not achieving their objective, noted above.
Chart 1: Performance relative to active manager peer group
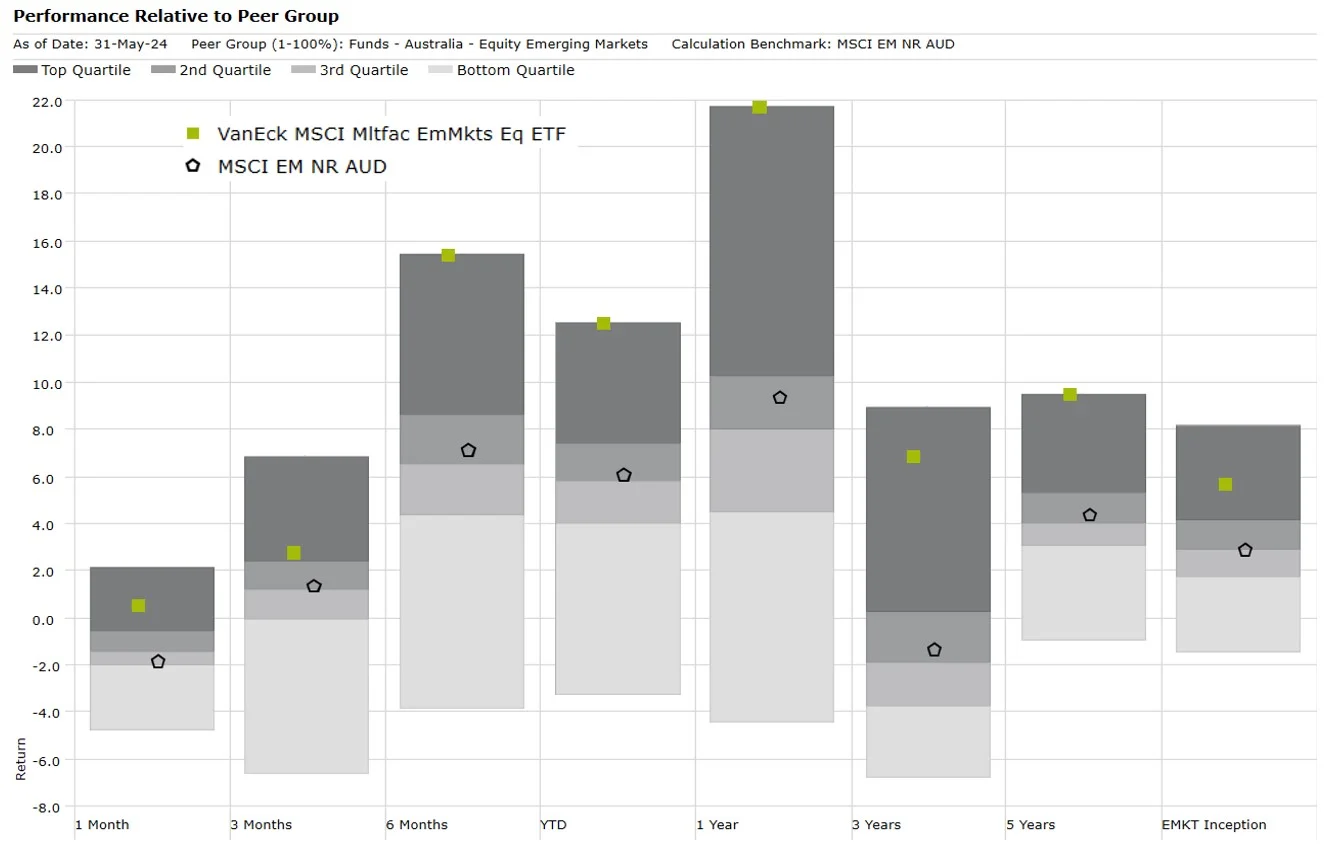
Source: Morningstar, to 31 May 2024. Past performance is not a reliable indicator of future performance. Results are calculated to the last business day of the month and assume immediate reinvestment of distributions. Results are net of management fees and other costs incurred in the fund, but before brokerage fees and bid/ask spreads. Returns for periods longer than one year are annualised. Peer group Equity Region Emerging Markets funds invest in companies listed in emerging markets from around the globe. Emerging market securities typically account for at least 75% of the portfolio.
The costs - top quartile performance for lower management fees
The impressive performance noted above has been achieved for a management fee of just 0.69% p.a. EMKT is one of the lowest-cost funds in its peer group.
As you can see below, EMKT's low management fee stands out among those managers who can boast outperformance over the past five years to the end of May 2024. It had the highest five-year return. You can see most actively managed funds charge much higher fees, generally between 1% and 1.5% p.a. What this means is that active managers must outperform EMKT by at least the difference between their total fees (including performance fees) and EMKT’s lower management fees to break even with EMKT every year. With the performance between active managers varying year-to-year, there is little wonder many advisers are allocating to EMKT to take advantage of the inefficiencies that exist within emerging markets and utilising their fee budget elsewhere.
Chart 2 – Emerging markets equity: Five- year performance (p.a.) versus management fees
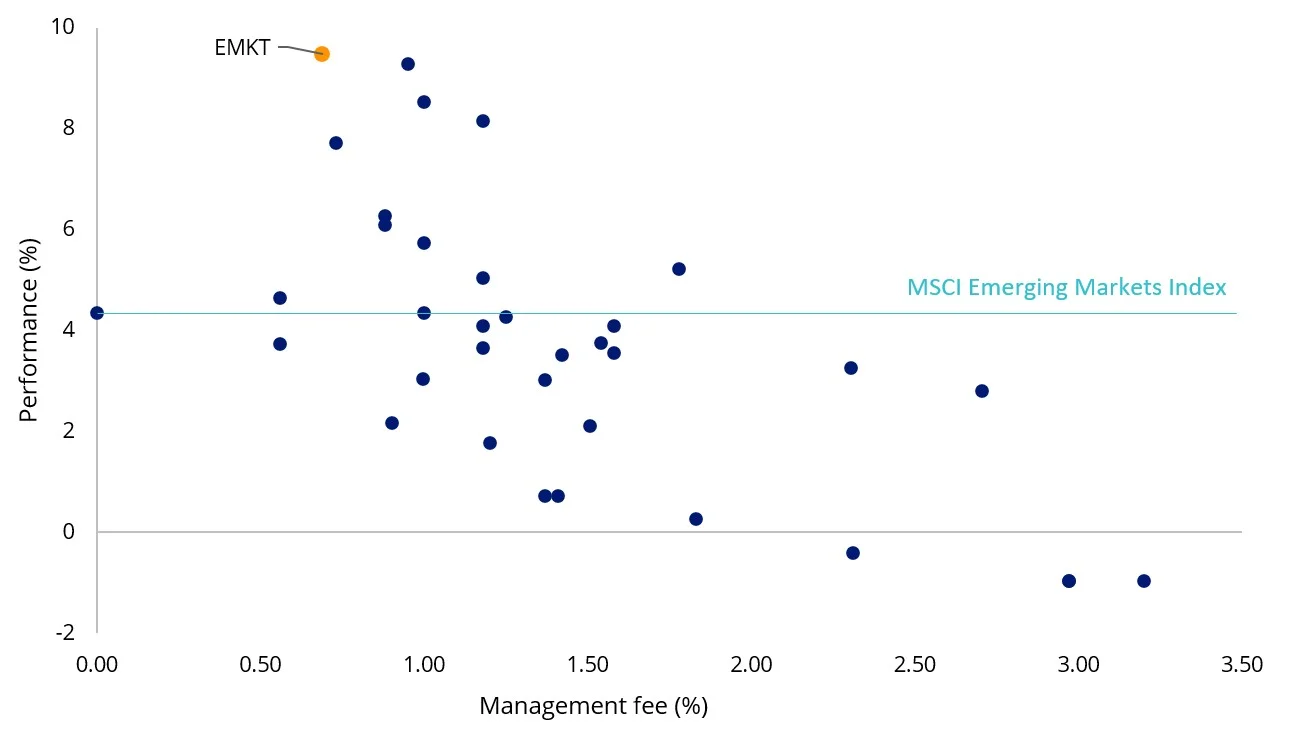
Source: Morningstar, to 31 May 2024. Past performance is not a reliable indicator of future performance. Results are calculated to the last business day of the month and assume immediate reinvestment of distributions. Results are net of management fees and other costs incurred in the fund, but before brokerage fees and bid/ask spreads. Returns for periods longer than one year are annualised. Peer group Equity Region Emerging Markets funds invest in companies listed in emerging markets from around the globe. Emerging market securities typically account for at least 75% of the portfolio. Management costs are Indirect Cost Ratio (ICR) in Morningstar Direct.
Holdings EMKT vs MSCI EM Index - Top 10 holdings
Below you can see the top 10 companies in EMKT. We put this beside an active emerging markets fund. EMKT’s top 10 holdings are listed on exchanges in countries MSCI has determined as emerging. What is interesting is the active fund has holdings listed in the US (in red), France (in blue) and the Netherlands (in orange). These are not emerging markets and while we think this is an extreme example, we believe that this is a risk that investors need to be aware of. It is likely your international equity allocation includes these companies, so you could be unknowingly doubling your concentration to these companies, despite your intention to diversify and access the growth of emerging markets.
Table 2: Top 10 holdings
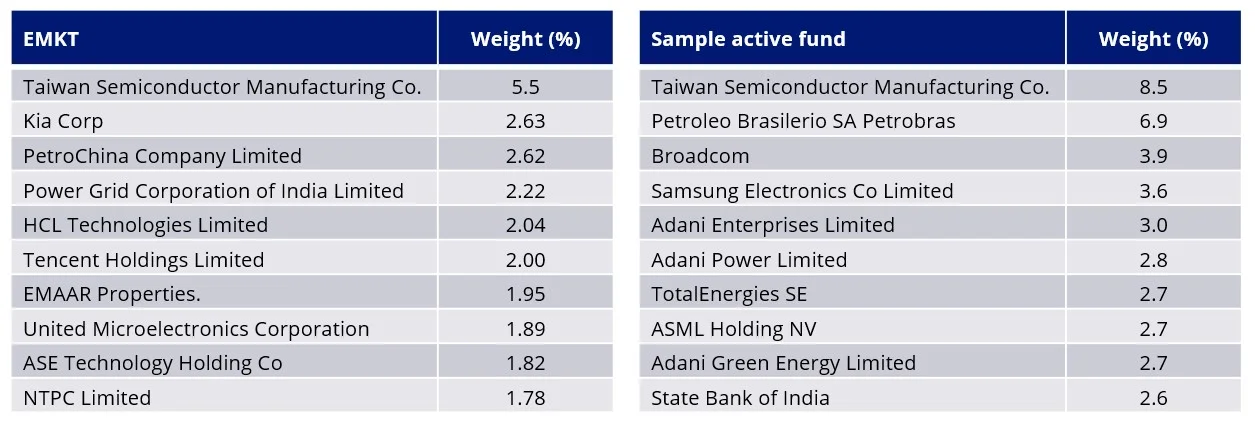
Source: EMKT holdings - Factset, VanEck, MSCI, as at 30 April 2024. Active fund manager’s 30 April Factsheet. Accessed 4 June 2024. Not a recommendation to act.
An added advantage of an ETF is full transparency. You can see all the holdings in EMKT and their weightings click here.
In summary, EMKT provides investors with a diversified portfolio of emerging markets equities (not developed) included on the basis of:
- value;
- low size;
- momentum; and
- quality.
EMKT has demonstrated outperformance since its inception against the MSCI Emerging Markets Index. EMKT’s performance has been achieved for around half of the cost of comparable active management strategies at a management fee of 0.69% p.a.
Past performance is no guarantee of future performance. The above is not a recommendation. Please speak to your financial adviser or stock broker.
For further information, you can email us or call us on +61 2 8038 3300.
Key risks: An investment EMKT carries risks associated with: ASX trading time differences, emerging markets, financial markets generally, individual company management, industry sectors, foreign currency, country or sector concentration, political, regulatory and tax risks, fund operations, liquidity and tracking an index. See the PDS for details.


Published: 11 June 2024
Any views expressed are opinions of the author at the time of writing and is not a recommendation to act.
VanEck Investments Limited (ACN 146 596 116 AFSL 416755) (‘VanEck’) is the issuer and responsible entity of all VanEck exchange traded funds (Funds) quoted on the ASX. This is general advice only and does not take into account any person’s financial objectives, situation or needs. The product disclosure statement (PDS) and the target market determination (TMD) for all Funds are available at vaneck.com.au. You should consider whether or not an investment in any Fund is appropriate for you. Investments in a Fund involve risks associated with financial markets. These risks vary depending on a Fund’s investment objective. Refer to the applicable PDS and TMD for more details on risks. Investment returns and capital are not guaranteed.
EMKT is indexed to a MSCI index. EMKT is not sponsored, endorsed or promoted by MSCI, and MSCI bears no liability with respect to EMKT or the MSCI Index. The PDS contains a more detailed description of the limited relationship MSCI has with VanEck and EMKT.