Emergence of the market leaders
Two of the world’s most underrated asset classes are shining particularly brightly in the wake of the ongoing Trump tariffs saga.
This past week, our Emerging Markets Bond team has been at the World Bank/IMF meetings.
With the Australian election and US politics dominating the local news cycle, you would be hard pressed to find an article in the local papers about the 2025 Spring meetings of the IMF's International Monetary and Financial Committee (IMFC) and the joint IMF-World Bank Development Committee (DC) in Washington that finished on 26 April.
Members of our Emerging Markets Bond team were in attendance, and they reported, as you would expect, that Trump’s tariffs dominated the conversations.
The recent shifts in US trade policy have markets on edge, and the consensus is that global growth will soften due to trade headwinds as the US dollar weakens and lower commodity prices create disinflation.
With the greenback falling by nearly 9% since Trump's inauguration, an extent not seen since the Nixon era, emerging markets local rate bonds have been outperforming developed market bonds, and we think this can continue.
What has come out of the meetings is that the tariffs might have the effect of lowering rates in emerging markets. Emerging market central banks are potentially more dovish in response to softer growth and inflation prospects, with many officials mentioning lower commodity prices, downside growth risks, and stronger emerging market foreign exchange – the JP Morgan’s EMFX index is re-testing this year’s highs (see chart below). The more benign inflation outlook could pave the way for policy easing in the coming months, supporting the strength of emerging market local debt relative to US dollar bonds.
Chart 1: Emerging market currencies are re-testing this year’s highs
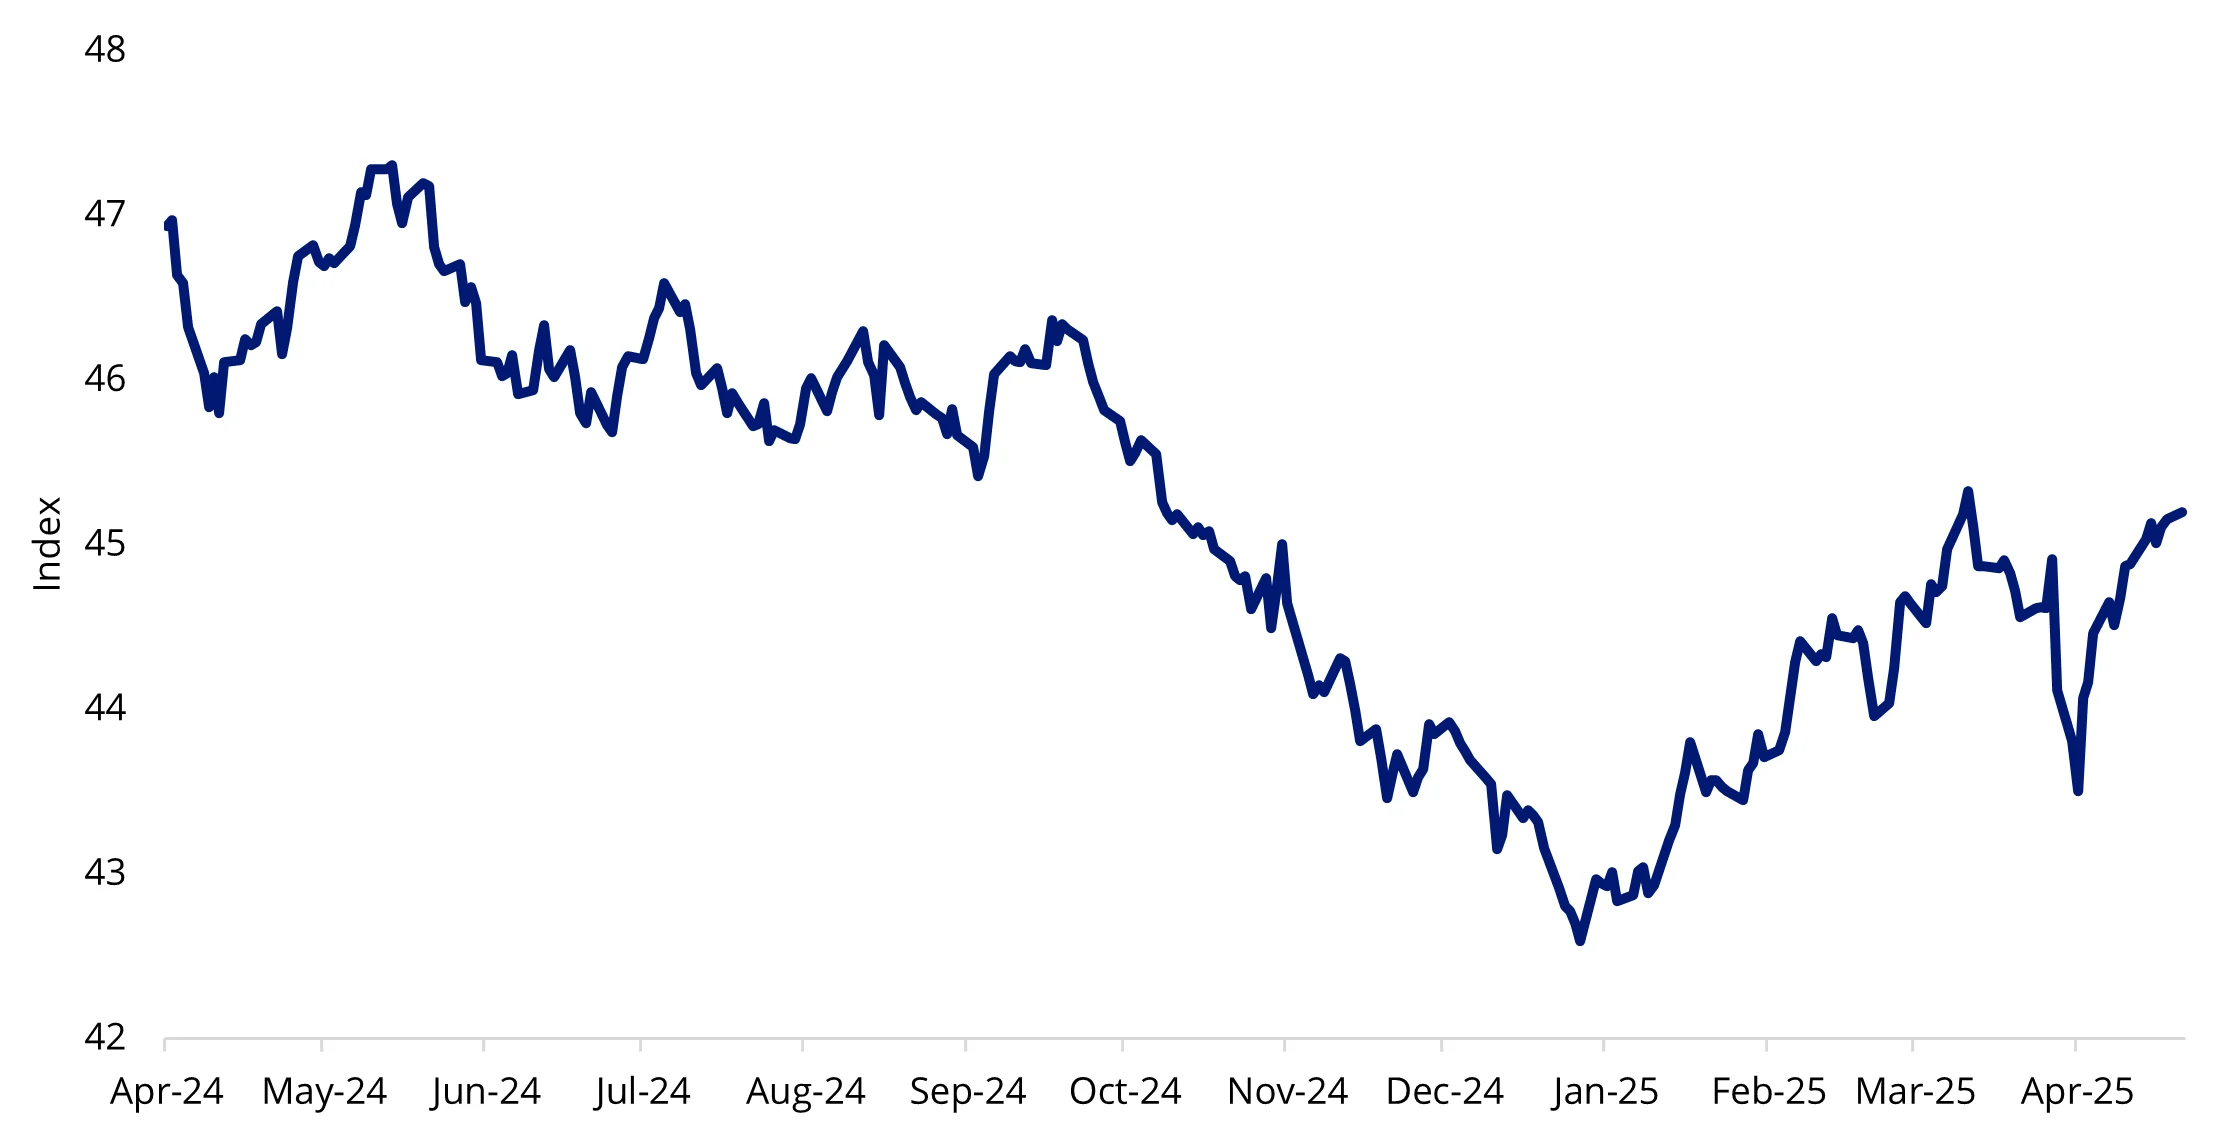
Source: Bloomberg. EMFX is JP Morgan EM Currency Index.
We think, though, it will still pay to be selective in emerging markets. As we have said many times, “Emerging markets are not a monolith.” For example, Brazil’s message might be getting more encouraging, including budget and inflation expectations, but there are now more questions about Colombia’s ability to reverse its fiscal course. Persistent fiscal slippages is a key reason why Colombia’s risk premium has gone up over the past two years, and now the IMF has decided to suspend Colombia’s Flexible Credit Line (FCL) until there is more clarity on the fiscal accounts.
Another takeaway from our team’s discussions is that China is in a different place than it was in the trade war of 2018, both domestically (authorities successfully lowered several negative tail risks in real estate and local government debt) and externally (re-routing trade away from the US and playing a more significant role as a lender and investor across emerging markets).
This is a reason why we think China can afford to be patient policy-wise. The “keep calm” vibes were on display in the Politburo’s memo released on 25 April, which included emergency measures to stabilise jobs and firms and promises of more policy support if necessary. Importantly, the central bank is keeping the exchange rate stable, anchoring many emerging market currencies.
For many emerging markets, the tariffs episode is evidence that years, and in some cases decades, of reforms and market discipline are bringing results. Real policy rates in emerging markets are still high, and successful reforms mean that many of these countries no longer require massive safety cushions to protect against external shocks.
Emerging market equities have been shining too
After the drawdown following the tariff announcements on Liberation Day, emerging market equities (which did not fall as far as developed market equities) have experienced a relief rally, triggered by the subsequent 90-day pause, and maintained their relative strength.
Chart 2: 2025 equity performance so far
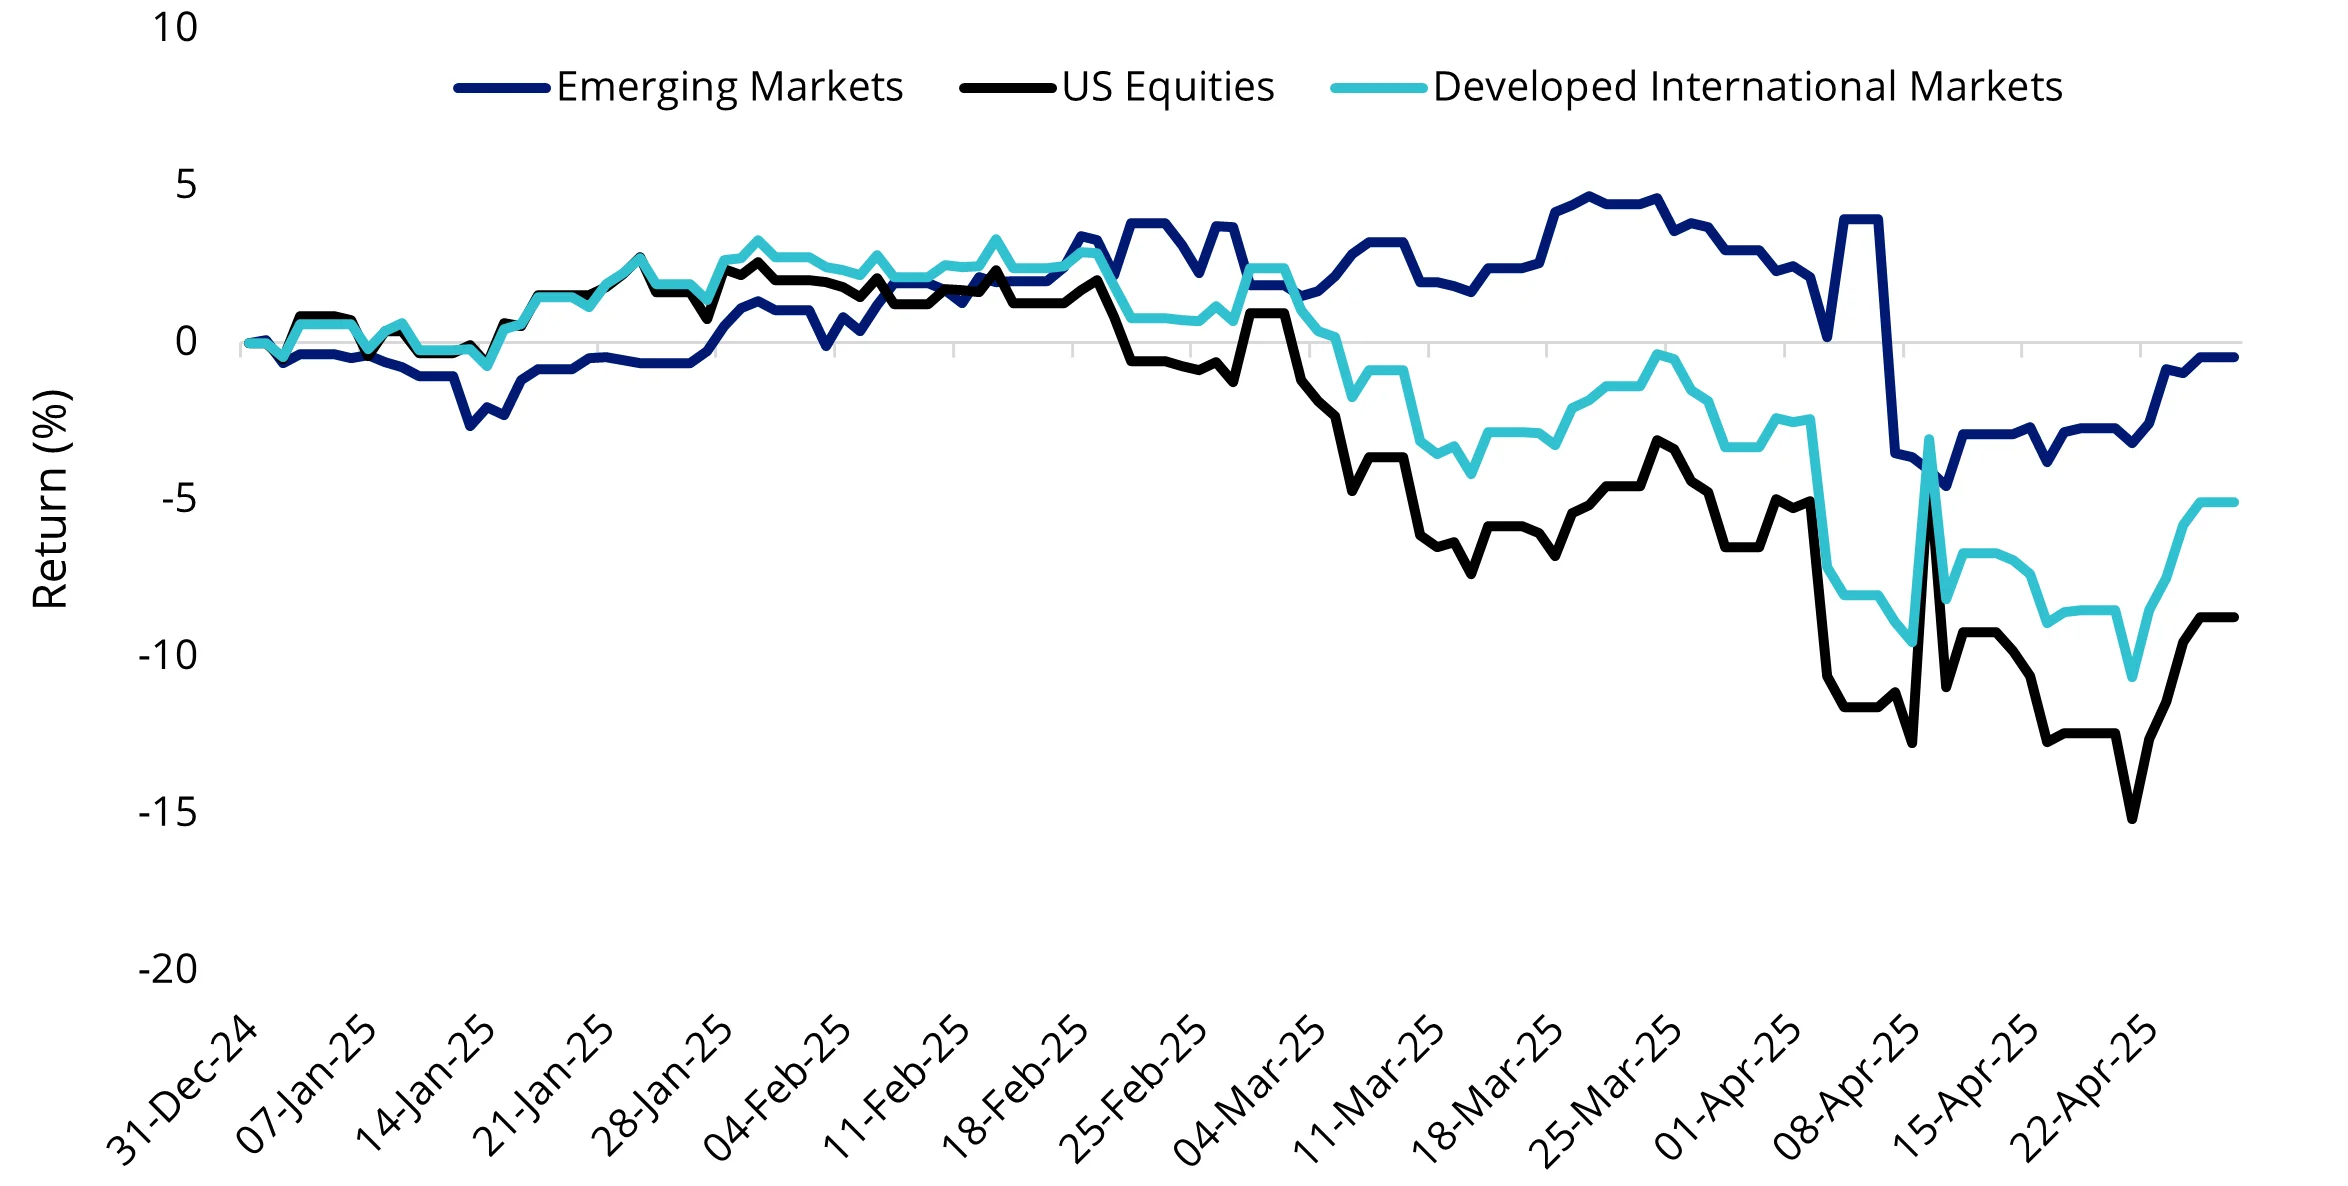
Source: Morningstar Direct, 31 December 2024 to 25 April 2025. Developed International Markets is MSCI World ex Australia Index, Emerging markets equities is MSCI Emerging Markets Index, US Equities is S&P 500 Index. Past performance is not indicative of future performance. You cannot invest directly in an index.
Valuations are compelling
Another case supporting emerging market equities is their valuations. We think the outperformance of emerging market equities could continue given their valuations and tailwinds from a weaker US dollar.
Emerging market equities, as represented by the MSCI Emerging Markets Index, are currently trading on a cheaper basis than developed markets, with a 29% discount on a price-to-earnings (P/E) and a 46% discount on a price-to-book (P/B) basis. The MSCI Emerging Markets Multi-Factor Select Index (EMKT Index) offers lower valuation ratios, so it potentially represents value.
Chart 3: P/E of developed markets and emerging markets
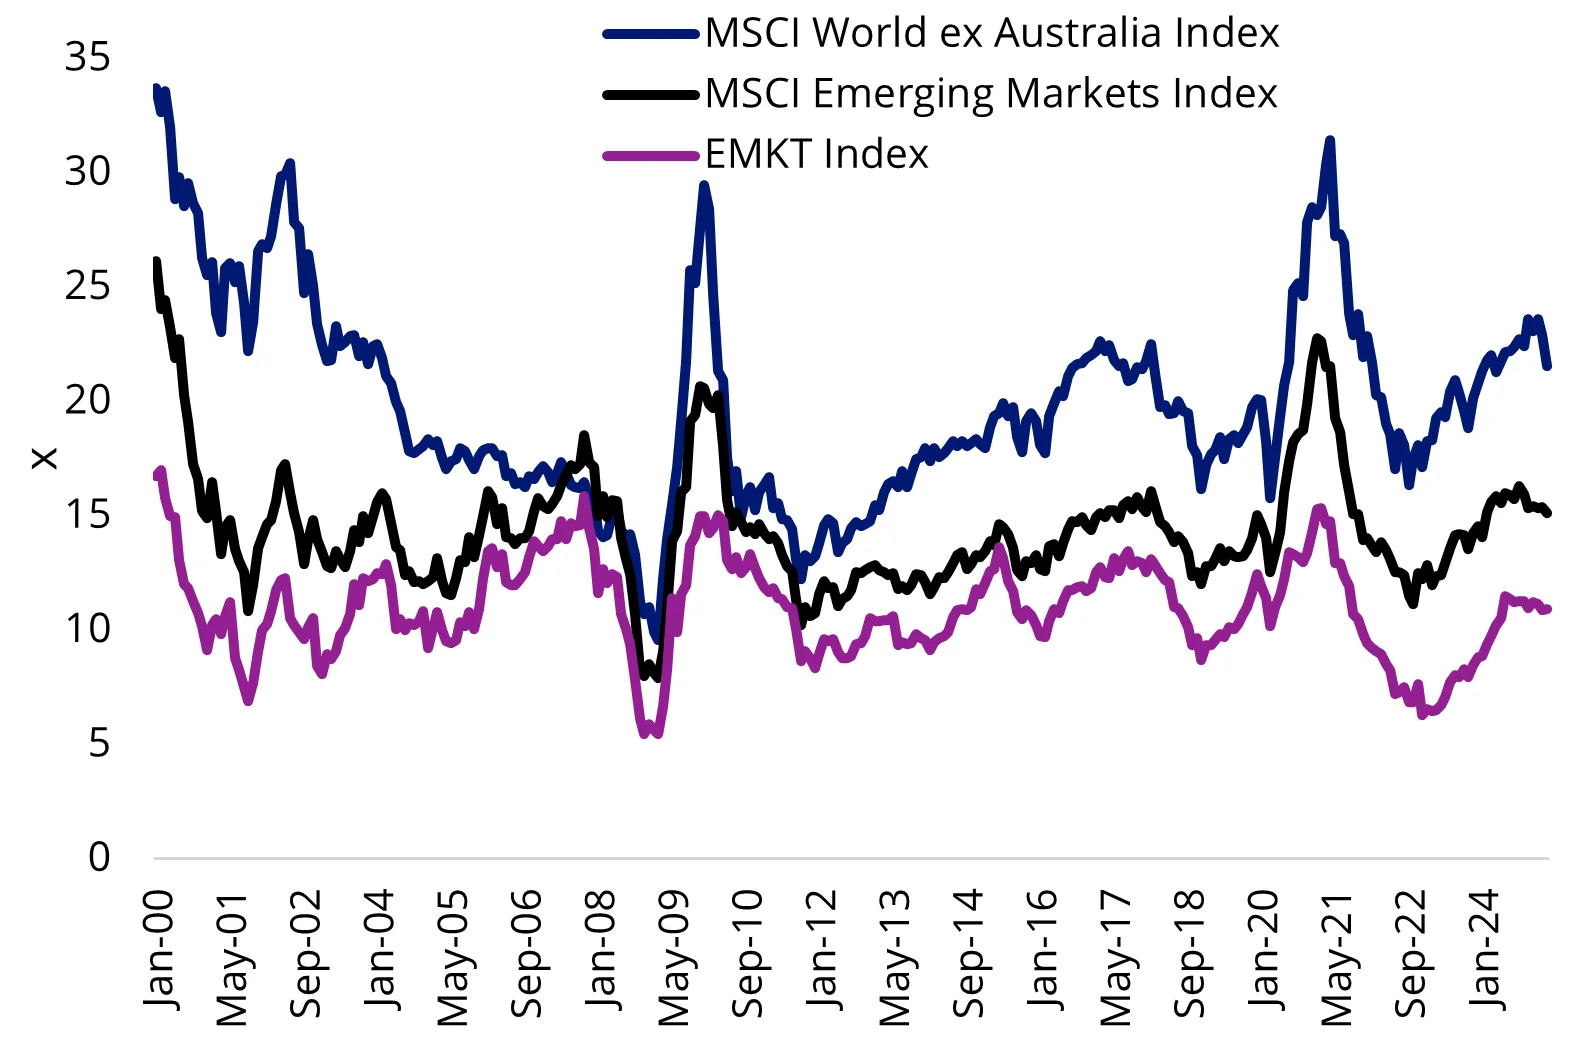
Source: MSCI, March 2005 to April 2025. EMKT Index is MSCI Emerging Markets Multi-Factor Select Index. You cannot invest in an index.
Chart 4: P/B of developed markets and emerging markets
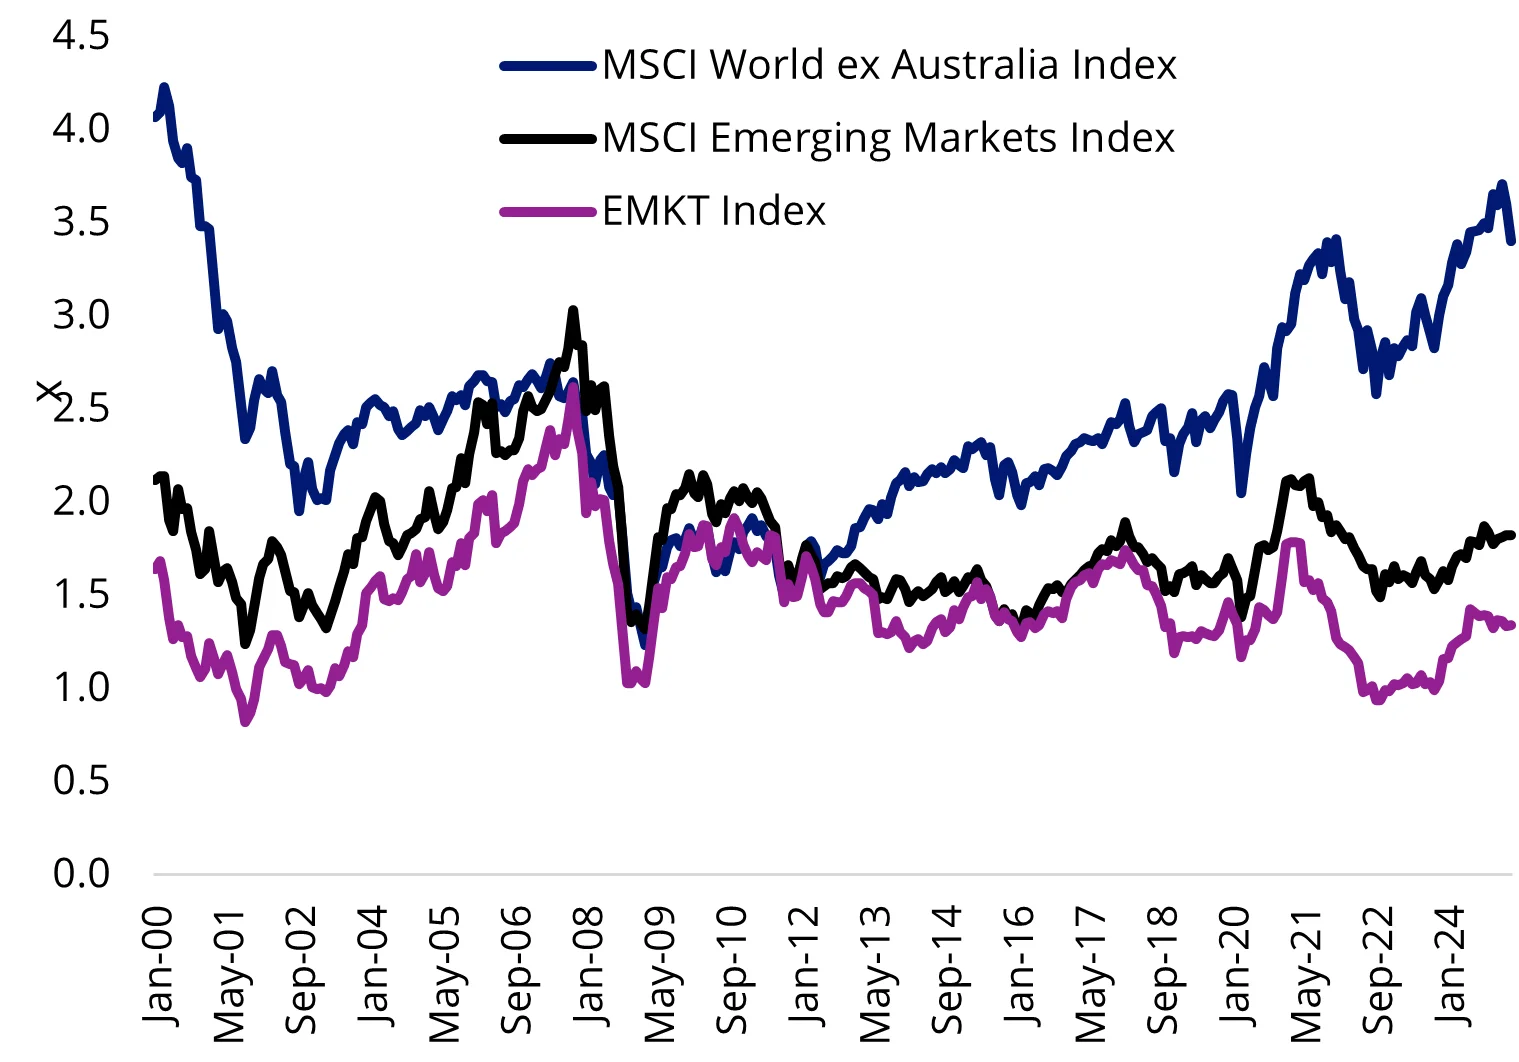
Source: MSCI, March 2005 to April 2025. You cannot invest in an index.
Not all companies in the MSCI Emerging Markets Index are desirable from an investment standpoint. Indeed, not all emerging market bonds are, either. This is where being selective can come to the fore.
VanEck has two ways investors can access emerging markets:
- Equities: VanEck MSCI Multifactor Emerging Markets Equity ETF (ASX: EMKT) provides investors with diversified access to companies that demonstrate four factors: Value, Momentum, Low Size and Quality, determined by global research giant, MSCI.
- Bonds: VanEck Emerging Income Opportunities Active ETF (ASX: EBND) takes an active, high conviction and benchmark agnostic approach to investing across the emerging market bond spectrum.
Both asset classes have outperformed their benchmarks over the long term.
Table 1: EMKT performance as at 30 April 2025
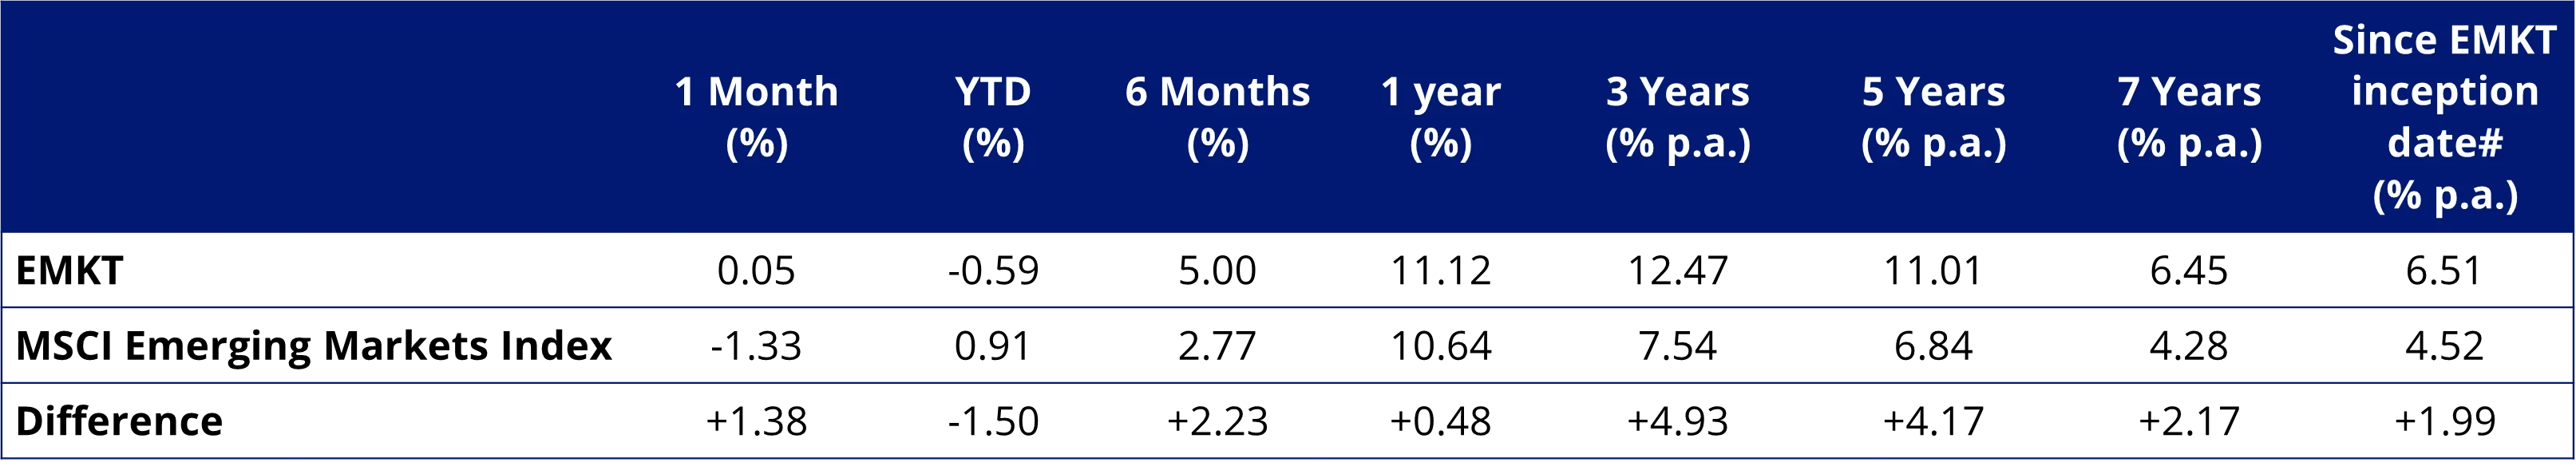
Source: VanEck, Morningstar Direct
#EMKT inception date is 10 April 2018, and a copy of the factsheet is here.
Performance is calculated net of management costs, calculated daily but does not include brokerage costs or buy/sell spreads of investing in EMKT. Past performance is not a reliable indicator of future performance. The MSCI Emerging Markets Index (“MSCI EMI”) is shown for comparison purposes as it is the widely recognised benchmark used to measure the performance of emerging markets large- and mid-cap companies, weighted by market capitalisation. EMKT’s index measures the performance of emerging markets companies selected on the basis of their exposure to value, momentum, low size and quality factors, while maintaining a total risk profile similar to that of the MSCI EMI, at rebalance. EMKT’s index has fewer companies and different country and industry allocations than MSCI EMI. Click here for more details
Table 2: EBND performance as at 30 April 2025
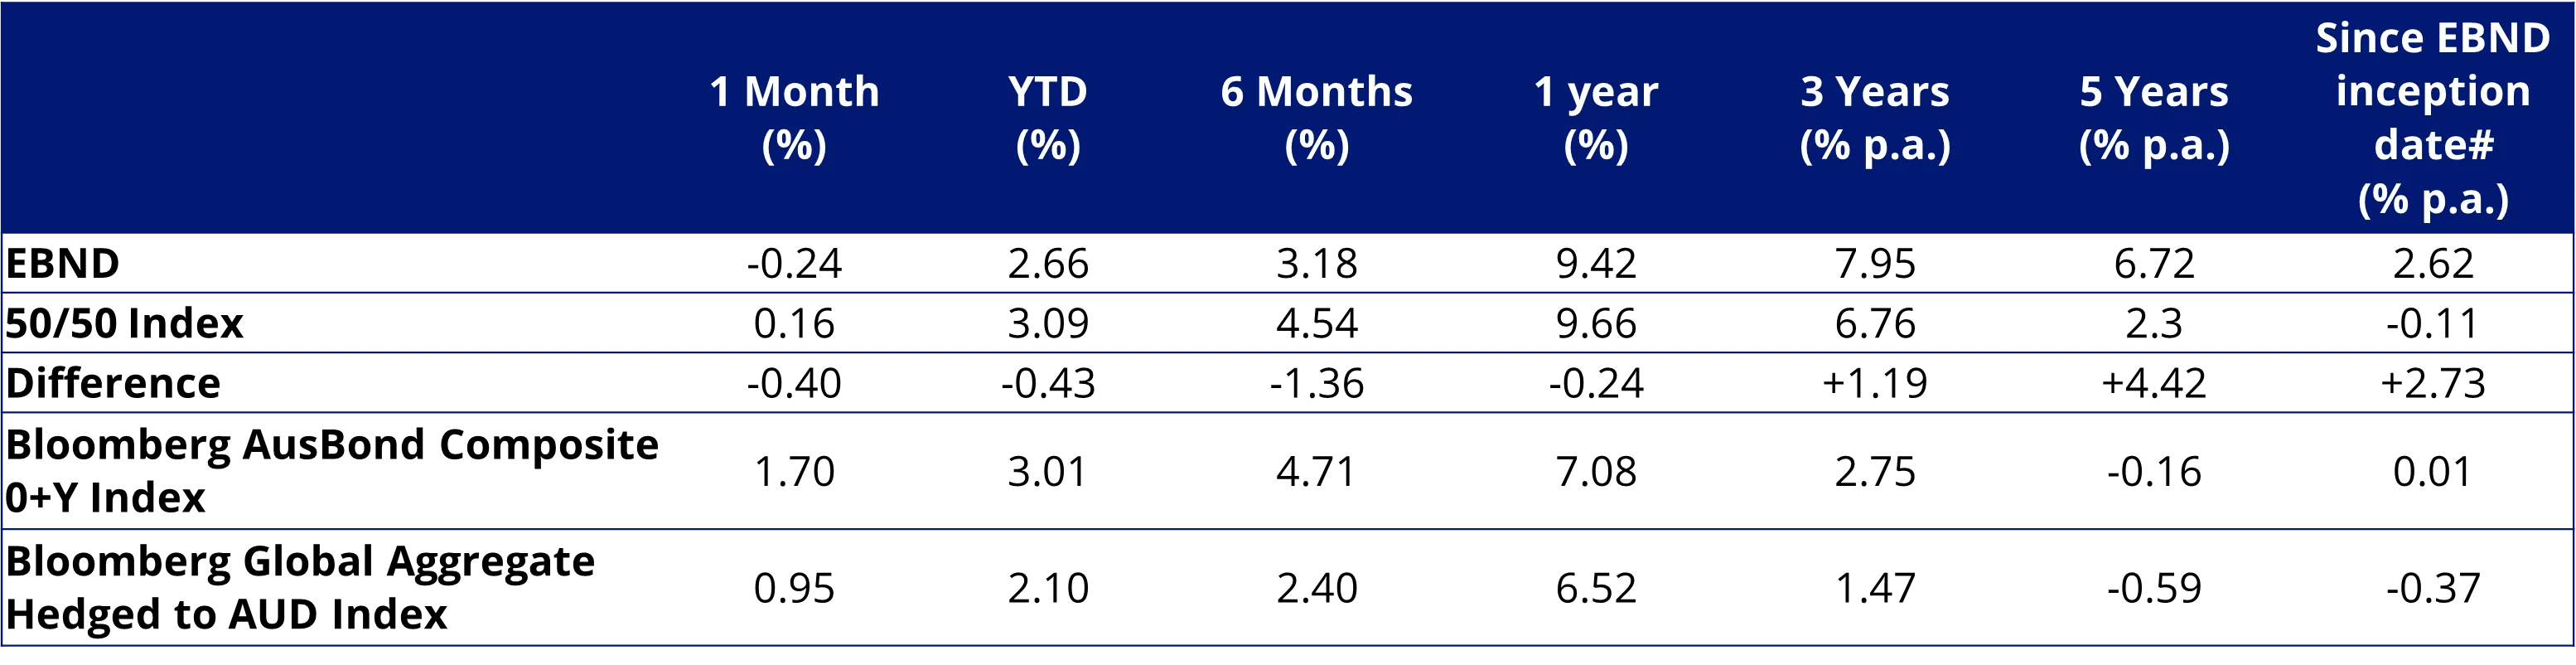
Source: VanEck, Morningstar Direct. The 50/50 Index is 50% J.P. Morgan Emerging Market Bond Index Global Diversified Hedged AUD and 50% J.P. Morgan Government Bond-Emerging Market Index Global Diversified.
#EBND inception date is 11 February 2020 and a copy of the factsheet is here.
Performance is calculated net of management costs, calculated daily but does not include brokerage costs or buy/sell spreads of investing in EBND. Past performance is not a reliable indicator of future performance. The Bloomberg AusBond Composite 0+Y Index and the Bloomberg Global Aggregate Hedged to AUD Index are shown for comparison purposes only and have been selected as they are the widely recognised benchmarks used to measure the performance of developed markets bonds that make up most Australian bond portfolios. EBND and the emerging markets 50/50 Index have a higher risk/return profile.
It is worth noting that EBND and its index have outperformed developed markets bonds as represented by the Bloomberg AusBond Composite 0+Y Index and the Bloomberg Global Aggregate Hedged to AUD Index over the past three and five years.
Key risks:
An investment in our Emerging Markets ETFs involves risks common to both funds, including: ASX trading time differences, emerging markets exposure, country and sector concentration, foreign currency risks, political, regulatory and tax risks, liquidity, and fund operations.
For EBND: Additional risks include those associated with bond markets, interest rate movements, issuer default, currency hedging, credit ratings, and active fund management.
For EMKT: Additional risks include equity market volatility, individual company performance, industry sector risks, and the risk of tracking an index.
Please refer to the relevant PDS and TMD for EBND and EMKT for full details.


Published: 06 May 2025
Any views expressed are opinions of the author at the time of writing and is not a recommendation to act.
VanEck Investments Limited (ACN 146 596 116 AFSL 416755) (VanEck) is the issuer and responsible entity of all VanEck exchange traded funds (Funds) trading on the ASX. This information is general in nature and not personal advice, it does not take into account any person’s financial objectives, situation or needs. The product disclosure statement (PDS) and the target market determination (TMD) for all Funds are available at vaneck.com.au. You should consider whether or not an investment in any Fund is appropriate for you. Investments in a Fund involve risks associated with financial markets. These risks vary depending on a Fund’s investment objective. Refer to the applicable PDS and TMD for more details on risks. Investment returns and capital are not guaranteed.
EMKT is indexed to a MSCI index. EMKT is not sponsored, endorsed or promoted by MSCI, and MSCI bears no liability with respect to EMKT or the MSCI Index. The PDS contains a more detailed description of the limited relationship MSCI has with VanEck and EMKT.