Investing wisely in emerging markets: If not now, when?
Whether looking at valuations, the macroeconomic outlook, or the structural traits of emerging markets, all three are in agreement, forging a compelling case for allocating to these markets.
Right now, emerging markets look compelling from a valuation standpoint, approaching historical lows relative to developed markets.
Chart 1: Forward P/E multiples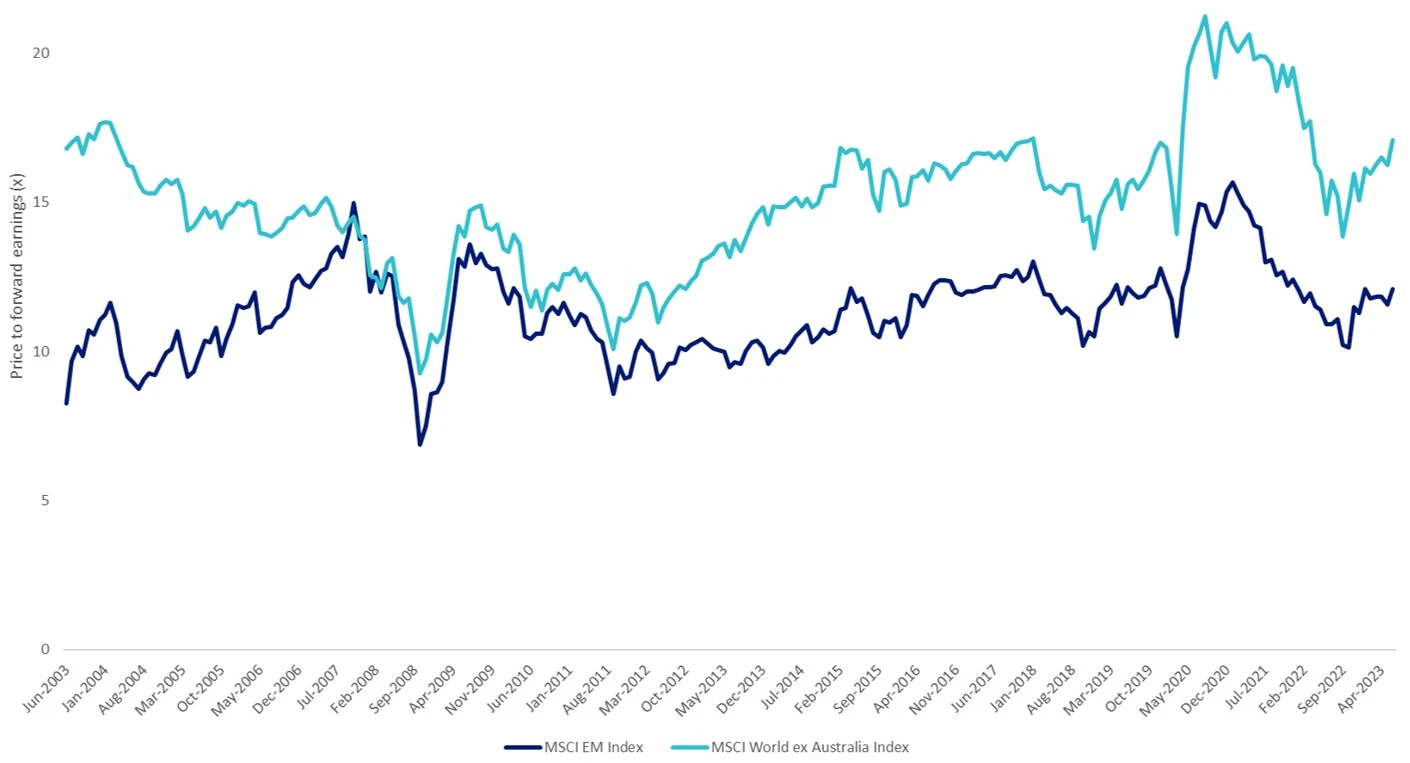
Source: MSCI, as at 30 June 2023. You cannot invest in an index.
Ahead of the inflation curve
At the moment, developed countries are dealing with inflation and rising rates. But many emerging markets have already dealt with this scenario over the past 20 years and learned important lessons which are now being utilised. Most emerging markets skillfully responded to post-COVID inflation pressures with early and aggressive rates hikes, which also gave a boost to their currencies.
Recent emerging markets inflation data has been a key driving factor in optimistic outlooks by investment banks such as Citi, JP Morgan, and UBS.
"EM has made quite substantial progress in bringing inflation down already, and going forward we expect this to continue," Manik Narain, a strategist at UBS recently told Reuters.
As you can see from the chart below, Citi's Emerging Market Inflation Surprise Index readings are undershooting estimates by a rate not seen since mid-2020 when demand fell off a cliff due to COVID-19.
Chart 2: CitiFX Emerging Market Inflation Surprise Index
Source: Refinitive, Reuters Graphics. The City Inflation Surprise Indices measure price surprises relative to market expectations. A positive reading means that inflation has been higher than expected and a negative reading means that inflation has been lower than expected.
According to Reuters, “Latin America's Brazil and Chile could soon join Uruguay in starting a rate-cut cycle, with Mexico and Colombia waiting in the wings. Hungary, the Czech Republic and others are seen following the same path, according to JP Morgan.”
If we look at the recent data from the Bank of International Settlements that highlights the significant fall in financial crises over the years. A key reason is that emerging markets did their homework, strengthening their institutional and policy frameworks.
Chart 3: Number of crises
Source: Bank for International Settlements (BIS)
Geared for growth
Emerging market economies continue to be strong, outgrowing developed markets by a significant margin on average. Consensus forecasts point to emerging market earnings outperforming developed market earnings over the next two years, with an EPS growth differential of 9% in 2024, according to research from CLSA, which was an increase from the 6% differential forecast from six months ago. The countries predicted to be driving this EPS growth is South Korea, Taiwan, India and China.
According to a recent article in the Financial Times, “Among the 25 largest emerging economies, three-quarters of those reporting data have beaten growth forecasts this year — some, including India and Brazil, by a wide margin. Forecasts for global growth in 2023 are rising and most of that uplift is coming from emerging economies.”
And while increasing interest rates did cause emerging world crises in the 1980s and 1990s, “many of the big emerging economies entered the pandemic of 2020 with repaired banking systems and heightened financial discipline. They borrowed less heavily for stimulus spending, and saw deficits rise on average by 15 per cent of gross domestic product from 2020 to 2022, half as much as the US. The old notion that “emerging” is another word for reckless no longer applies.”
Emerging markets are home to 87% of the world’s population1and 77% of the world’s “Gen Z” contingent. The countries that make up emerging markets are estimated to be responsible for ~60% of the world’s GDP by 20262, yet their equity markets only represent 13% of the market capitalisation of all international equities3. This mismatch creates a once-in-a-lifetime, long-term opportunity for global investors – we believe that as emerging markets grow, evolve and transform, the size of their capital markets will become more prominent over time as well.
Investing in emerging markets is no easy feat
Investing in emerging markets has traditionally been expensive and returns among active managers vary significantly from year-to-year because it is almost impossible for active managers to time factors in emerging markets.
As an Exchange Traded Fund (ETF), EMKT tracks the MSCI Emerging Markets Diversified Multiple-Factor Select Index (EMKT Index) which includes companies on the basis of four factors: Value, Momentum, Low Size and Quality. The four factors combined have demonstrated strong performance relative to the MSCI Emerging Markets Index.
Table 1: Performance as at 30 June 2023
|
|
1 Mth (%) |
3 Mths (%) |
6 Mths (%) |
1 Yr (%) |
3 Yr (% p.a.) |
5 Yr (% p.a.) |
Since inception (% p.a.) |
|
EMKT |
1.95 |
5.61 |
13.18 |
13.79 |
8.49 |
4.27 |
3.26 |
|
MSCI Emerging Markets Index |
0.91 |
1.52 |
6.86 |
5.11 |
3.48 |
3.06 |
1.83 |
|
Difference |
+1.04 |
+4.09 |
+6.32 |
+8.68 |
+5.01 |
+1.21 |
+1.43 |
Source: VanEck, Morningstar, Bloomberg.#EMKT inception date is 10 April 2018 and a copy of the factsheet is here.
* EMKT Index base date is 29 December 2000. EMKT Index results are net of EMKT’s 0.69% p.a. management fees, calculated daily but do not include brokerage costs or buy/sell spreads of investing in EMKT. You cannot invest in an index. EMKT Index performance prior to its launch on 17 March 2015 is simulated based on the current index methodology. Past performance is not a reliable indicator of future performance.
The MSCI Emerging Markets Index (“MSCI EMI”) is shown for comparison purposes as it is the widely recognised benchmark used to measure the performance of emerging markets large- and mid-cap companies, weighted by market capitalisation. EMKT’s index measures the performance of emerging markets companies selected on the basis of their exposure to value, momentum, low size and quality factors, while maintaining a total risk profile similar to that of the MSCI EMI, at rebalance. EMKT’s index has fewer companies and different country and industry allocations than MSCI EMI. ‘Click here for more details
EMKT’s performance puts it in the top quartile of active peers over one, two and three years.
Chart 4: Performance relative to active manager peer group
Source: Morningstar, to 30 June 2023. Past performance is not a reliable indicator of future performance. Results are calculated to the last business day of the month and assume immediate reinvestment of distributions. Results are net of management fees and other costs incurred in the fund, but before brokerage fees and bid/ask spreads. Returns for periods longer than one year are annualised. Peer group Equity Region Emerging Markets funds invest in companies listed in emerging markets from around the globe. Emerging market securities typically account for at least 75% of the portfolio.
Top quartile performance for lower management fees
The impressive performance above has been achieved for a management fee of just 0.69% p.a., making EMKT one of the lowest cost funds in its peer group. As you can see below, EMKTs low management fee stands out among those managers that can boast outperformance over the past three years to the end of June 2023. You can see most actively managed funds charge much higher fees, generally between 1% and 1.5%. What this means is that active managers have to outperform EMKT by at least the difference between their total fees (including performance fees) and EMKT’s lower management fees to just break even with EMKT every year.
Chart 5 – Emerging markets equity: Three- year performance (p.a.) versus management costs
Source: Morningstar, to 30 June 2023. Past performance is not a reliable indicator of future performance. Results are calculated to the last business day of the month and assume immediate reinvestment of distributions. Results are net of management fees and other costs incurred in the fund, but before brokerage fees and bid/ask spreads. Returns for periods longer than one year are annualised. Peer group Equity Region Emerging Markets funds invest in companies listed in emerging markets from around the globe. Emerging market securities typically account for at least 75% of the portfolio. Management costs are Indirect Cost Ratio (ICR) in Morningstar Direct.
Key risks:
All investments carry risk. An investment in EMKT carries risks associated with ASX trading time differences, emerging markets, financial markets generally, individual company management, industry sectors, foreign currency, country or sector concentration, political, regulatory and tax risks, fund operations, liquidity and tracking an index. See the PDS for details.


Published: 14 July 2023
1Source: Oxford Business Group, UN Youth Development and Participation. Data as of 2020.
2Source: IMF. Data as of April 2021.
3Source: MSCI. Data as of June 2021.
IMPORTANT NOTICE
VanEck Investments Limited (ACN 146 596 116 AFSL 416755) (‘VanEck’) is the issuer and responsible entity of all VanEck exchange traded funds (Funds) listed on the ASX. This is general advice only and does not take into account any person’s financial objectives, situation or needs. The product disclosure statement (PDS) and the target market determination (TMD) for all Funds are available at vaneck.com.au. You should consider whether or not any Fund is appropriate for you. Investments in a Fund involve risks associated with financial markets. These risks vary depending on a Fund’s investment objective. Refer to the applicable PDS and TMD for more details on risks. Investment returns and capital are not guaranteed.
EMKT is indexed to a MSCI index. EMKT is not sponsored, endorsed, or promoted by MSCI, and MSCI bears no liability with respect to EMKT or the MSCI Index. The PDS contains a more detailed description of the limited relationship MSCI has with VanEck and EMKT.