Party on, emerging markets?
A cooler US inflation print boosted the mood in emerging markets last week. Understand the current opportunity in emerging markets equities and what to consider.
Last week’s weaker-than-expected US CPI numbers positively impacted emerging markets, with many emerging markets’ currencies receiving a boost on Thursday morning. With many pundits now expecting a rate cut as soon as September, markets seemingly think the ‘peak’ US dollar is well behind us.
Historically, a weaker US dollar has generally correlated to strength in emerging markets because many trade in US dollars. In addition, falling US rates are a tailwind for many emerging markets companies because they are often forced to borrow in US dollars and thus commit to repaying the loan in US dollars. Therefore, the cost of repaying these loans is lower if the local currency appreciates, relative to the US dollar.
We believe, we may look back on 2024 as being an attractive entry point for emerging markets equities: Valuations are attractive relative to history and developed markets. In addition, many companies in emerging markets are now domestically focused instead of relying on overseas demand, as they have been in the past. Emerging markets make up around 12% of MSCI’s All Country World Index yet many Australian investors do not have a proportionate international equity exposure to this asset class, fearing volatility and geopolitics – we wrote an article on allocating to emerging markets here.
A cooler inflation print in the US lifted the mood in emerging markets on Thursday morning, giving a big boost to many emerging markets currencies (there were a few notable exceptions). The inflation numbers gave investors renewed hope that rate cuts could be coming sooner rather than later, and this has led to the belief that the US dollar could weaken into the rest of 2024, which is beneficial for emerging markets.
One region that could benefit is Asian emerging markets. Asian central banks did not hike as much as other emerging markets, so their currencies should be propped-up by lower Fed rates. This argument covers China as well. China’s economy has bottomed, and the recovery is still slow as evidenced by China’s below-consensus inflation print on Wednesday. Should China see positive results of its announced policy measures to revitalise its housing sector (by dealing with unsold and unfinished houses) China’s onshore consumer sectors could do well.
The Fed might be organising a ‘party’ for emerging markets, but not all companies or economies will be invited. You can see two emerging markets currencies that didn’t rally after the release of the US CPI numbers, the Mexican peso and the Brazilian real. These economies have unresolved domestic policy issues: fiscal risks in Brazil and Colombia and institutional risks in Mexico. So, the market is differentiating, and it is not happy about Brazil’s President Lula’s preference for a lower policy rate rather than lower spending and the prospect of Mexico’s institutional deterioration. This is why it pays to be selective in emerging markets.
Chart 1: 12 June 2024 emerging markets currency movements – the market is discerning
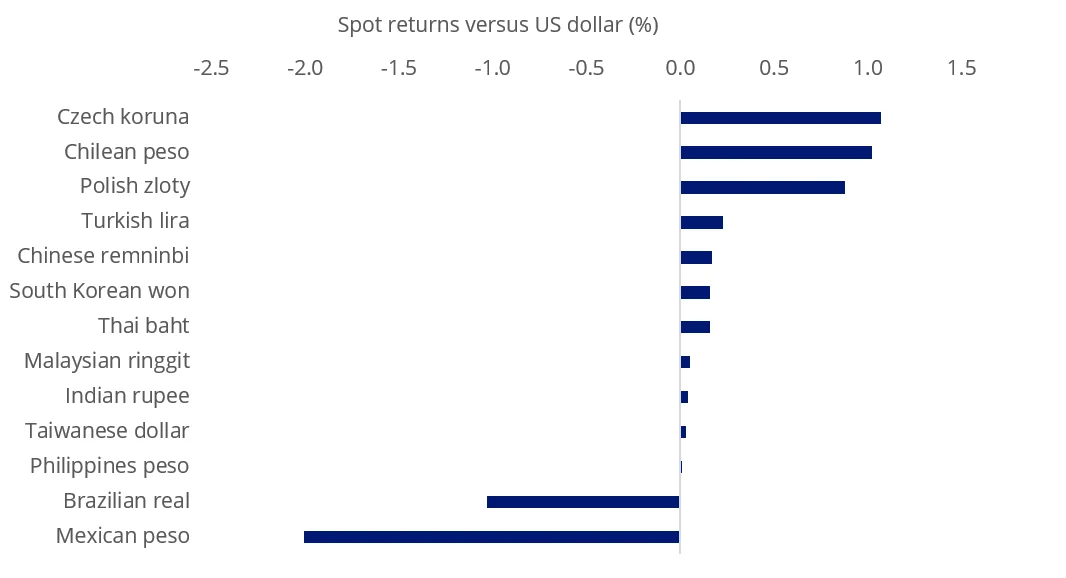
Source: Bloomberg
On a valuation basis emerging markets equities look compelling. While emerging markets have historically always traded at a discount to developed markets, on a forward price to earnings (P/E) basis, in 2024 emerging markets have been trading at multiples not seen since 2022.
Chart 2: Forward P/E of emerging markets indices and the developed market index
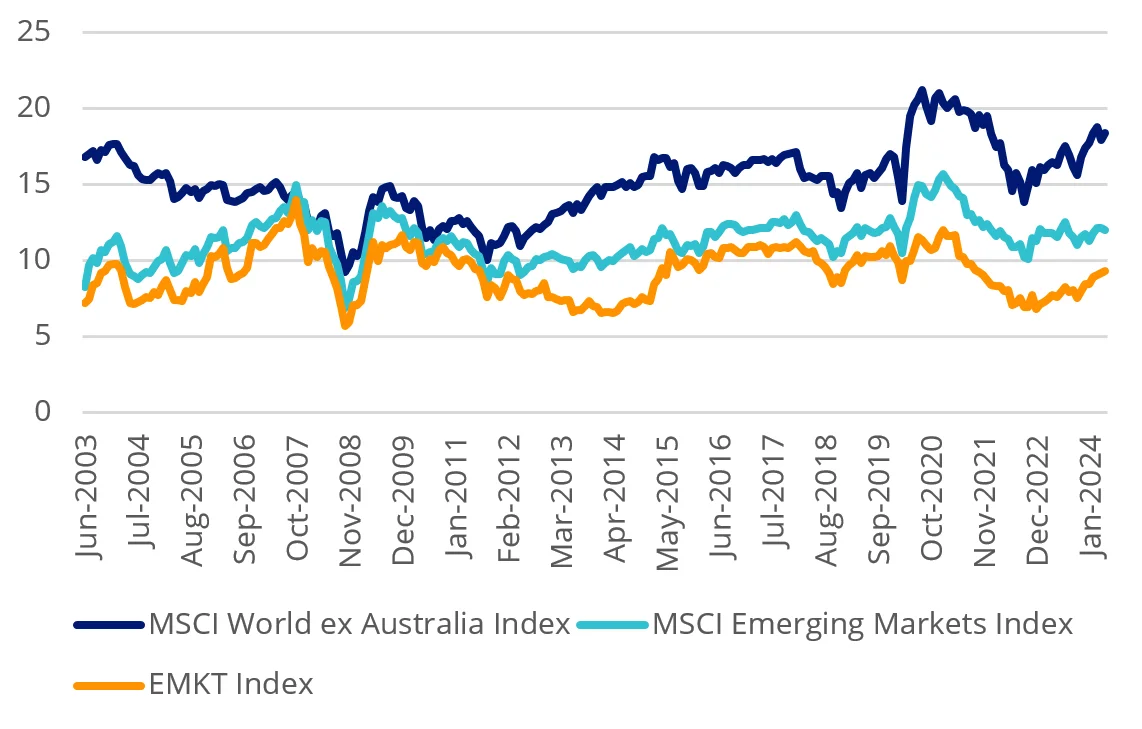
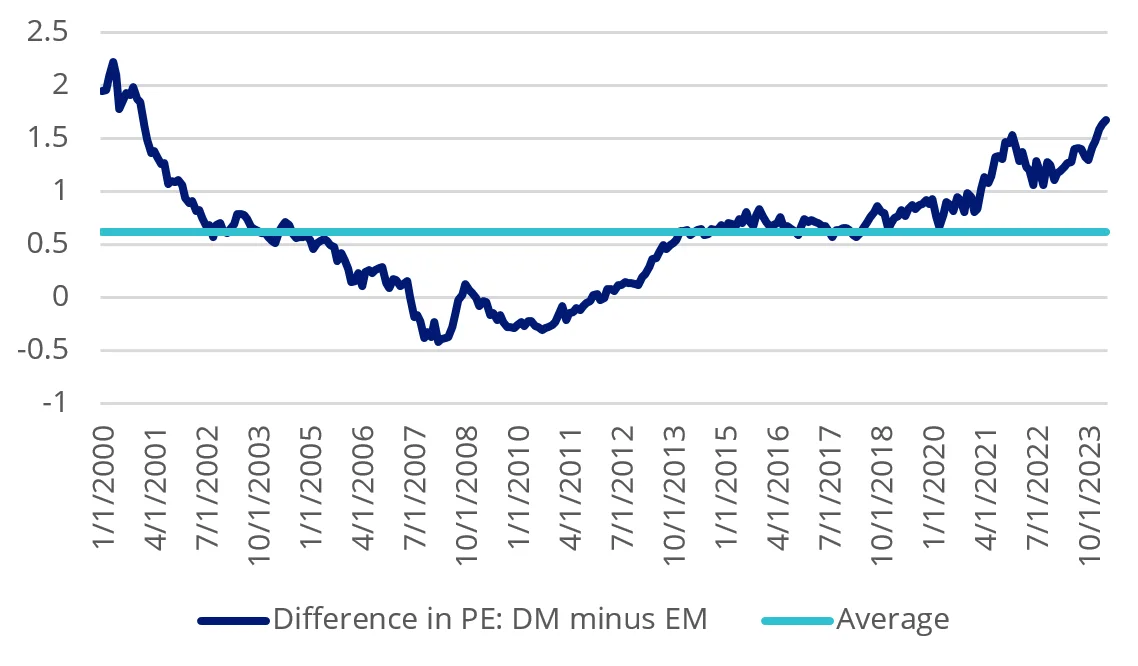
Chart 3: Forward P/E differential between developed markets (DM) and emerging markets (EM)
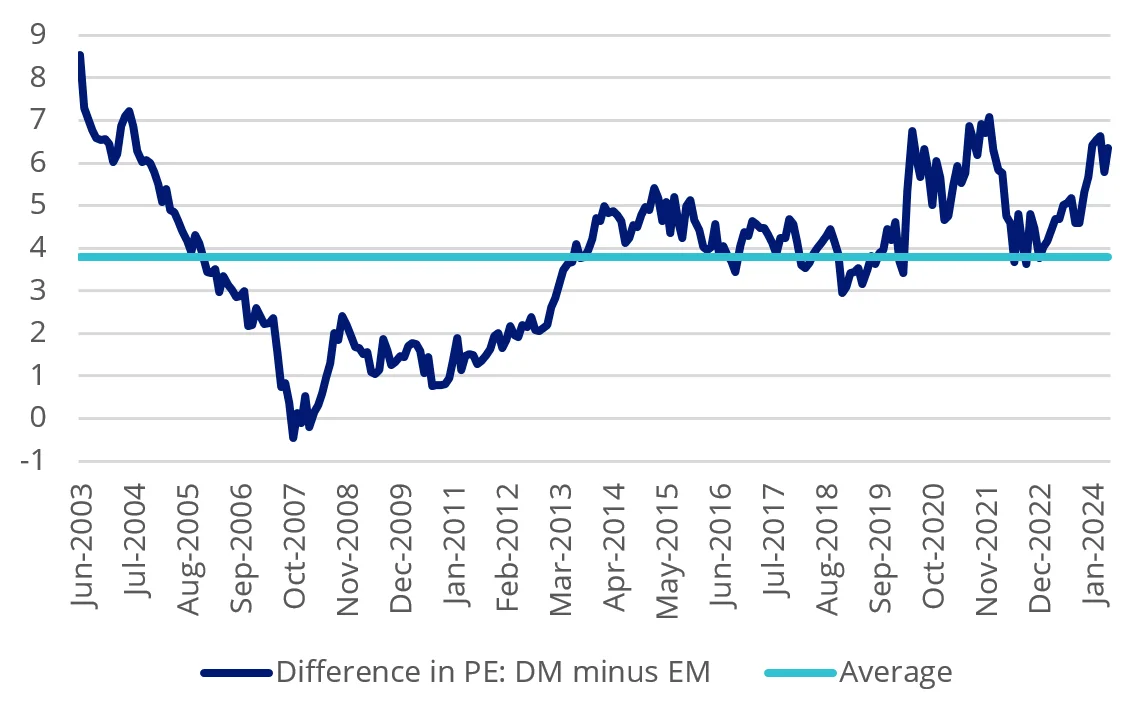
Charts 2 & 3: Source FactSet, MSCI to 31 March 2024. EMKT index is MSCI Emerging Markets Multi-Factor Select Index (AUD). Chart 3 shows the difference between the MSCI World ex Australia Index and the MSCI Emerging Markets Index
On a price-to-book basis, emerging markets in 2024 haven’t been this cheap, relative to developed markets, since 2001.
Chart 4: Price to book emerging markets indices and the developed market index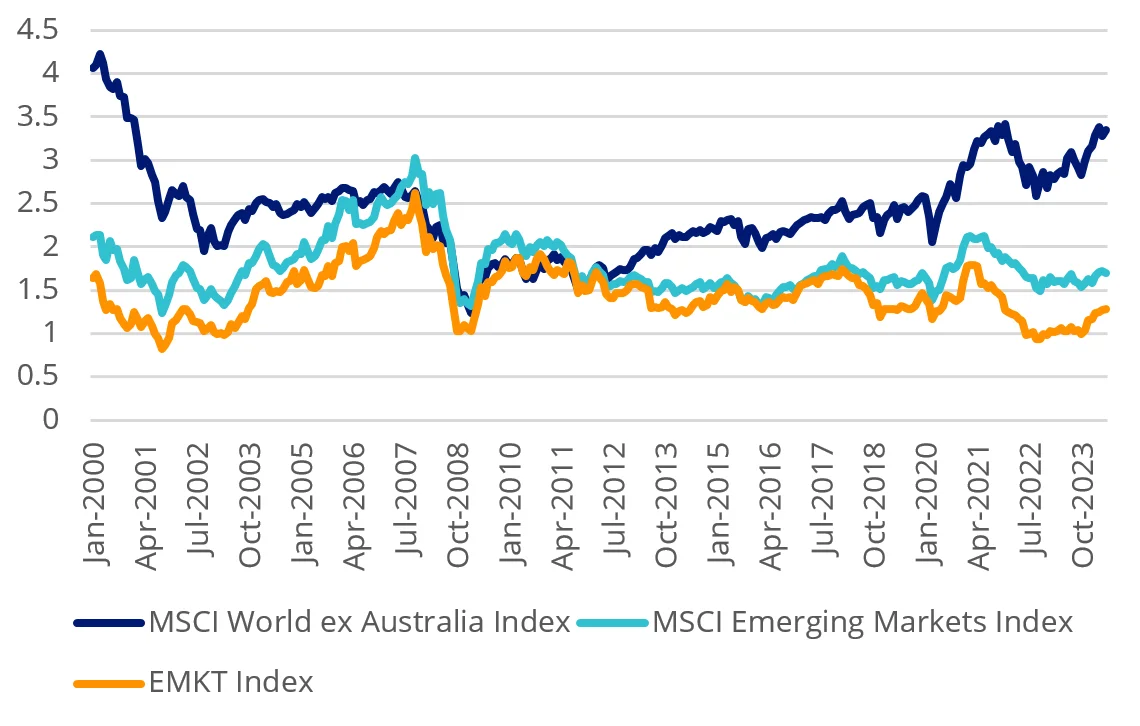
Chart 5: Price to book differential between developed markets (DM) and emerging markets (EM)
Charts 4 & 5: Source FactSet, MSCI to 31 March 2024. EMKT index is MSCI Emerging Markets Multi-Factor Select Index (AUD). Chart 5 shows the difference between the MSCI World ex Australia Index and the MSCI Emerging Markets Index
Being selective in EM
Emerging markets are known to be ‘inefficient’, so are ripe for active managers to add value. In addition to being expensive, returns among active managers vary significantly from year to year because it is almost impossible for them to time factors in emerging markets.
EMKT tracks the MSCI Emerging Markets Multi-Factor Select Index (EMKT Index) which includes companies on the basis of four factors: Value, Momentum, Low Size and Quality. The four factors combined have demonstrated strong performance relative to the MSCI Emerging Markets Index.
Table 1: Performance as at 31 May 2024
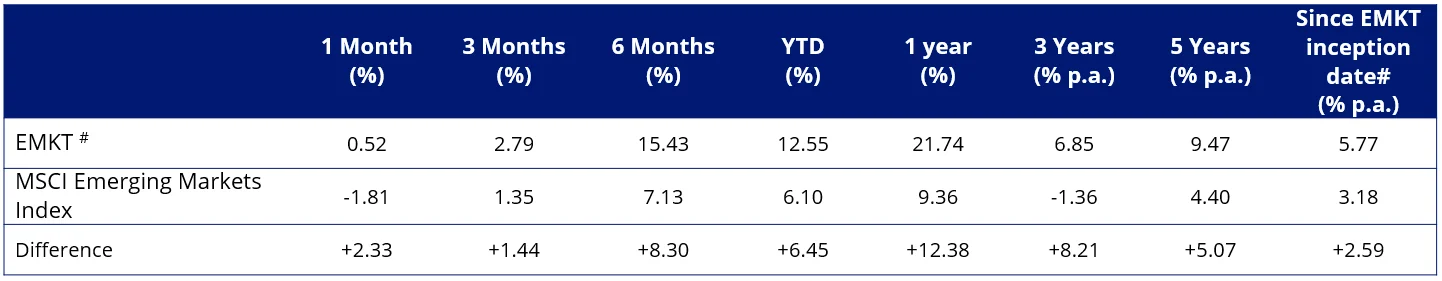
Source: VanEck, Morningstar Direct
#EMKT inception date is 10 April 2018 and a copy of the factsheet is here.
Results are calculated to the last business day of the month and assume immediate reinvestment of distributions. EMKT Performance is calculated net of management fees and costs incurred in the fund, calculated daily but does not include brokerage costs or buy/sell spreads of investing in EMKT. Past performance is not a reliable indicator of future performance. Returns longer than one year are annualised.
The MSCI Emerging Markets Index (“MSCI EMI”) is shown for comparison purposes as it is the widely recognised benchmark used to measure the performance of emerging markets large- and mid-cap companies, weighted by market capitalisation. EMKT’s index measures the performance of emerging markets companies selected on the basis of their exposure to value, momentum, low size and quality factors, while maintaining a total risk profile similar to that of the MSCI EMI, at rebalance. EMKT’s index has fewer companies and different country and industry allocations than MSCI EMI. Click here for more details
EMKT’s performance is impressive, relative to the market benchmark, MSCI Emerging Markets. It is also worth considering its performance relative to active peers. EMKT’s performance puts it in the top quartile of active peers over all the trailing periods noted in the table above. It is worth noting in Chart 6 below, that the MSCI Emerging Markets index has beaten more than 50% of active emerging market managers in those trailing periods, except over one month. In other words, over 50% of active managers are not adding value, after fees, despite the ‘inefficiency’ of emerging markets and the opportunities this may present.
Chart 6: Performance relative to active manager peer group
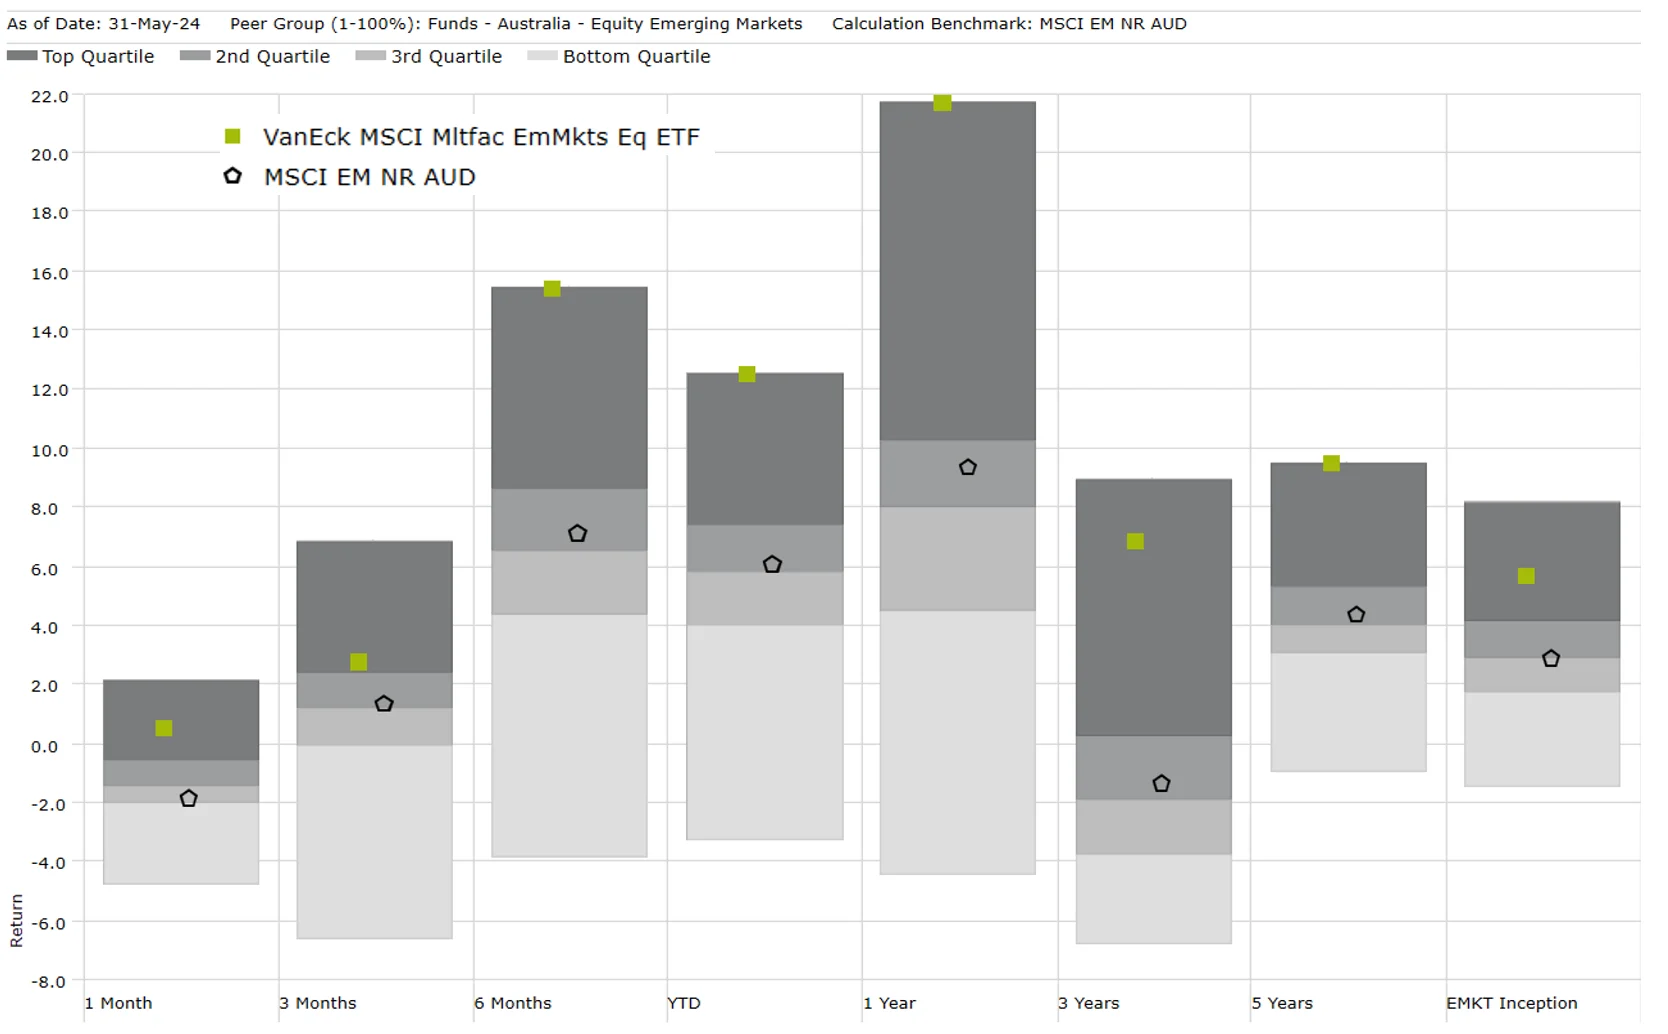
Source: Morningstar, to 31 May 2024. Past performance is not a reliable indicator of future performance. Results are calculated to the last business day of the month and assume immediate reinvestment of distributions. Results are net of management fees and other costs incurred in the fund, but before brokerage fees and bid/ask spreads. Returns for periods longer than one year are annualised. Peer group Equity Region Emerging Markets funds invest in companies listed in emerging markets from around the globe. Emerging market securities typically account for at least 75% of the portfolio.
The costs - top quartile performance for lower management fees
The impressive performance noted above has been achieved for a management fee of just 0.69% p.a. EMKT is one of the lowest-cost funds in its peer group.
As you can see below, EMKT's low management fee stands out among those managers who can boast outperformance over the past five years to the end of May 2024. It had the highest five-year return. You can see most actively managed funds charge much higher fees, generally between 1% and 1.5% p.a. What this means is that active managers must outperform EMKT by at least the difference between their total fees (including performance fees) and EMKT’s lower management fees to break even with EMKT every year. With the performance between active managers varying year-to-year, there is little wonder many advisers are allocating to EMKT to take advantage of the inefficiencies that exist within emerging markets and utilising their fee budget elsewhere.
Chart 7: Emerging markets equity: Five- year performance (p.a.) versus management fees
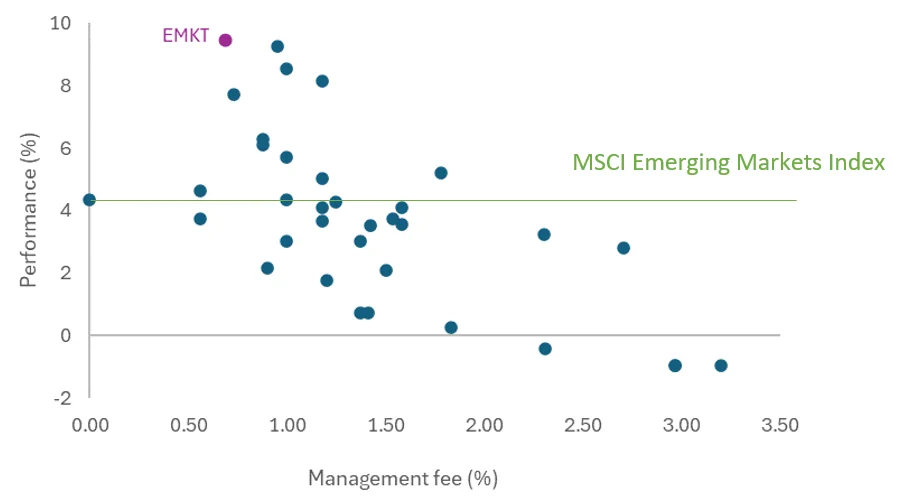
Source: Morningstar, to 31 May 2024. Past performance is not a reliable indicator of future performance. Results are calculated to the last business day of the month and assume immediate reinvestment of distributions. Results are net of management fees and other costs incurred in the fund, but before brokerage fees and bid/ask spreads. Returns for periods longer than one year are annualised. Peer group Equity Region Emerging Markets funds invest in companies listed in emerging markets from around the globe. Emerging market securities typically account for at least 75% of the portfolio. Management costs are Indirect Cost Ratio (ICR) in Morningstar Direct.
Key risks: All investments carry risk. An investment in EMKT carries risks associated with ASX trading time differences, emerging markets, financial markets generally, individual company management, industry sectors, foreign currency, country or sector concentration, political, regulatory and tax risks, fund operations, liquidity and tracking an index. See the PDS for details.
For large trade execution please contact our capital markets desk on 02 8038 3317 or call me for more insight about how EMKT can assist in achieving your client’s investment outcomes.


Published: 17 June 2024
Any views expressed are opinions of the author at the time of writing and is not a recommendation to act.
VanEck Investments Limited (ACN 146 596 116 AFSL 416755) (VanEck) is the issuer and responsible entity of all VanEck exchange traded funds (Funds) listed on the ASX. This is general advice only and does not take into account any person’s financial objectives, situation or needs. The product disclosure statement (PDS) and the target market determination (TMD) for all Funds are available at vaneck.com.au. You should consider whether or not an investment in any Fund is appropriate for you. Investments in a Fund involve risks associated with financial markets. These risks vary depending on a Fund’s investment objective. Refer to the applicable PDS and TMD for more details on risks. Investment returns and capital are not guaranteed.
EMKT is indexed to a MSCI index. EMKT is not sponsored, endorsed, or promoted by MSCI, and MSCI bears no liability with respect to EMKT or the MSCI Index. The PDS contains a more detailed description of the limited relationship MSCI has with VanEck and EMKT.