Dollar’s trouble could be gold’s triumph
Gold’s record highs and market drivers
Gold continued its upward trajectory in February, reaching a record high of US$2,951.73 per ounce on 24 February, driven by safe-haven demand amid concerns over US trade policy. The Trump administration’s policy induced uncertainty, combined with rising inflation expectations and diminished consumer confidence, and this weighed on major stock indexes, further boosting gold’s appeal as an alternative investment and portfolio diversifier.
A key factor behind gold’s latest rally was a surge in the holdings of gold bullion backed ETFs. Total known ETF holdings of gold increased by 2.49% in February, marking the largest monthly inflow since March 2022. However, profit-taking and a strengthening US dollar in the final week of February triggered a pullback, pushing gold down by approximately US$100 from its peak. Despite this decline, gold closed at US$2,857.83 per ounce on 28 February, securing a monthly gain of US$59.42, or 2.12%.
Performance and investor sentiment
The NYSE Arca Gold Miners Index gained 2.32% in February, outperforming broader equity markets. Gold miners’ recent mixed performance was a key topic at the annual BMO Metals and Mining conference in Florida this past month. Optimism about the sector was met with frustration, as rising cash balances, improved liquidity, lower debt ratios, higher dividends and significant buyback programs have failed to spark investor interest in the past years. That trend may be set to change in 2025, as growing investment demand for gold, evidenced by inflows into the bullion ETFs, should also lead to increased demand for gold equities. Anecdotally, companies at the conference reported an increased number of meetings with general investors eager to increase their near-zero exposure to gold.
Resilience amid global tariffs
The gold industry remains largely isolated from the negative impact of global tariffs. In fact, many gold producers could benefit from foreign currency depreciations triggered by these tariffs, as a significant portion of their cost base is denominated in local currencies. For example, Alamos Gold estimates that about 90-95% of its Canadian operational costs are Canadian dollar denominated, while about 40-45% of its Mexican mine expenses are denominated in pesos. While industry cost inflation is widely reported around the 3-5% range for 2025, the potential benefit of weaker local currencies and a rising gold price should more than offset inflationary pressures for the sector. This dynamic is expected to continue to drive margin expansion to new record levels.
The evolving role of the US dollar and emerging trends
For more than a century, the US dollar has been the cornerstone of the global financial system. Most trade is financed in US dollars, commodities are priced in US dollars and the US dollar has been used, coveted and hoarded by people and nations around the world. However, this is changing.
The US dollar’s strength against other currencies has traditionally been supported by the robustness of the US economy and its reputation as one of the safest jurisdictions in which to invest.
The chart below highlights a steady long-term upward trend of the US Dollar Index (DXY) amid fluctuations in recent years.
Chart 1: US dollar strength, 2008 to 2025
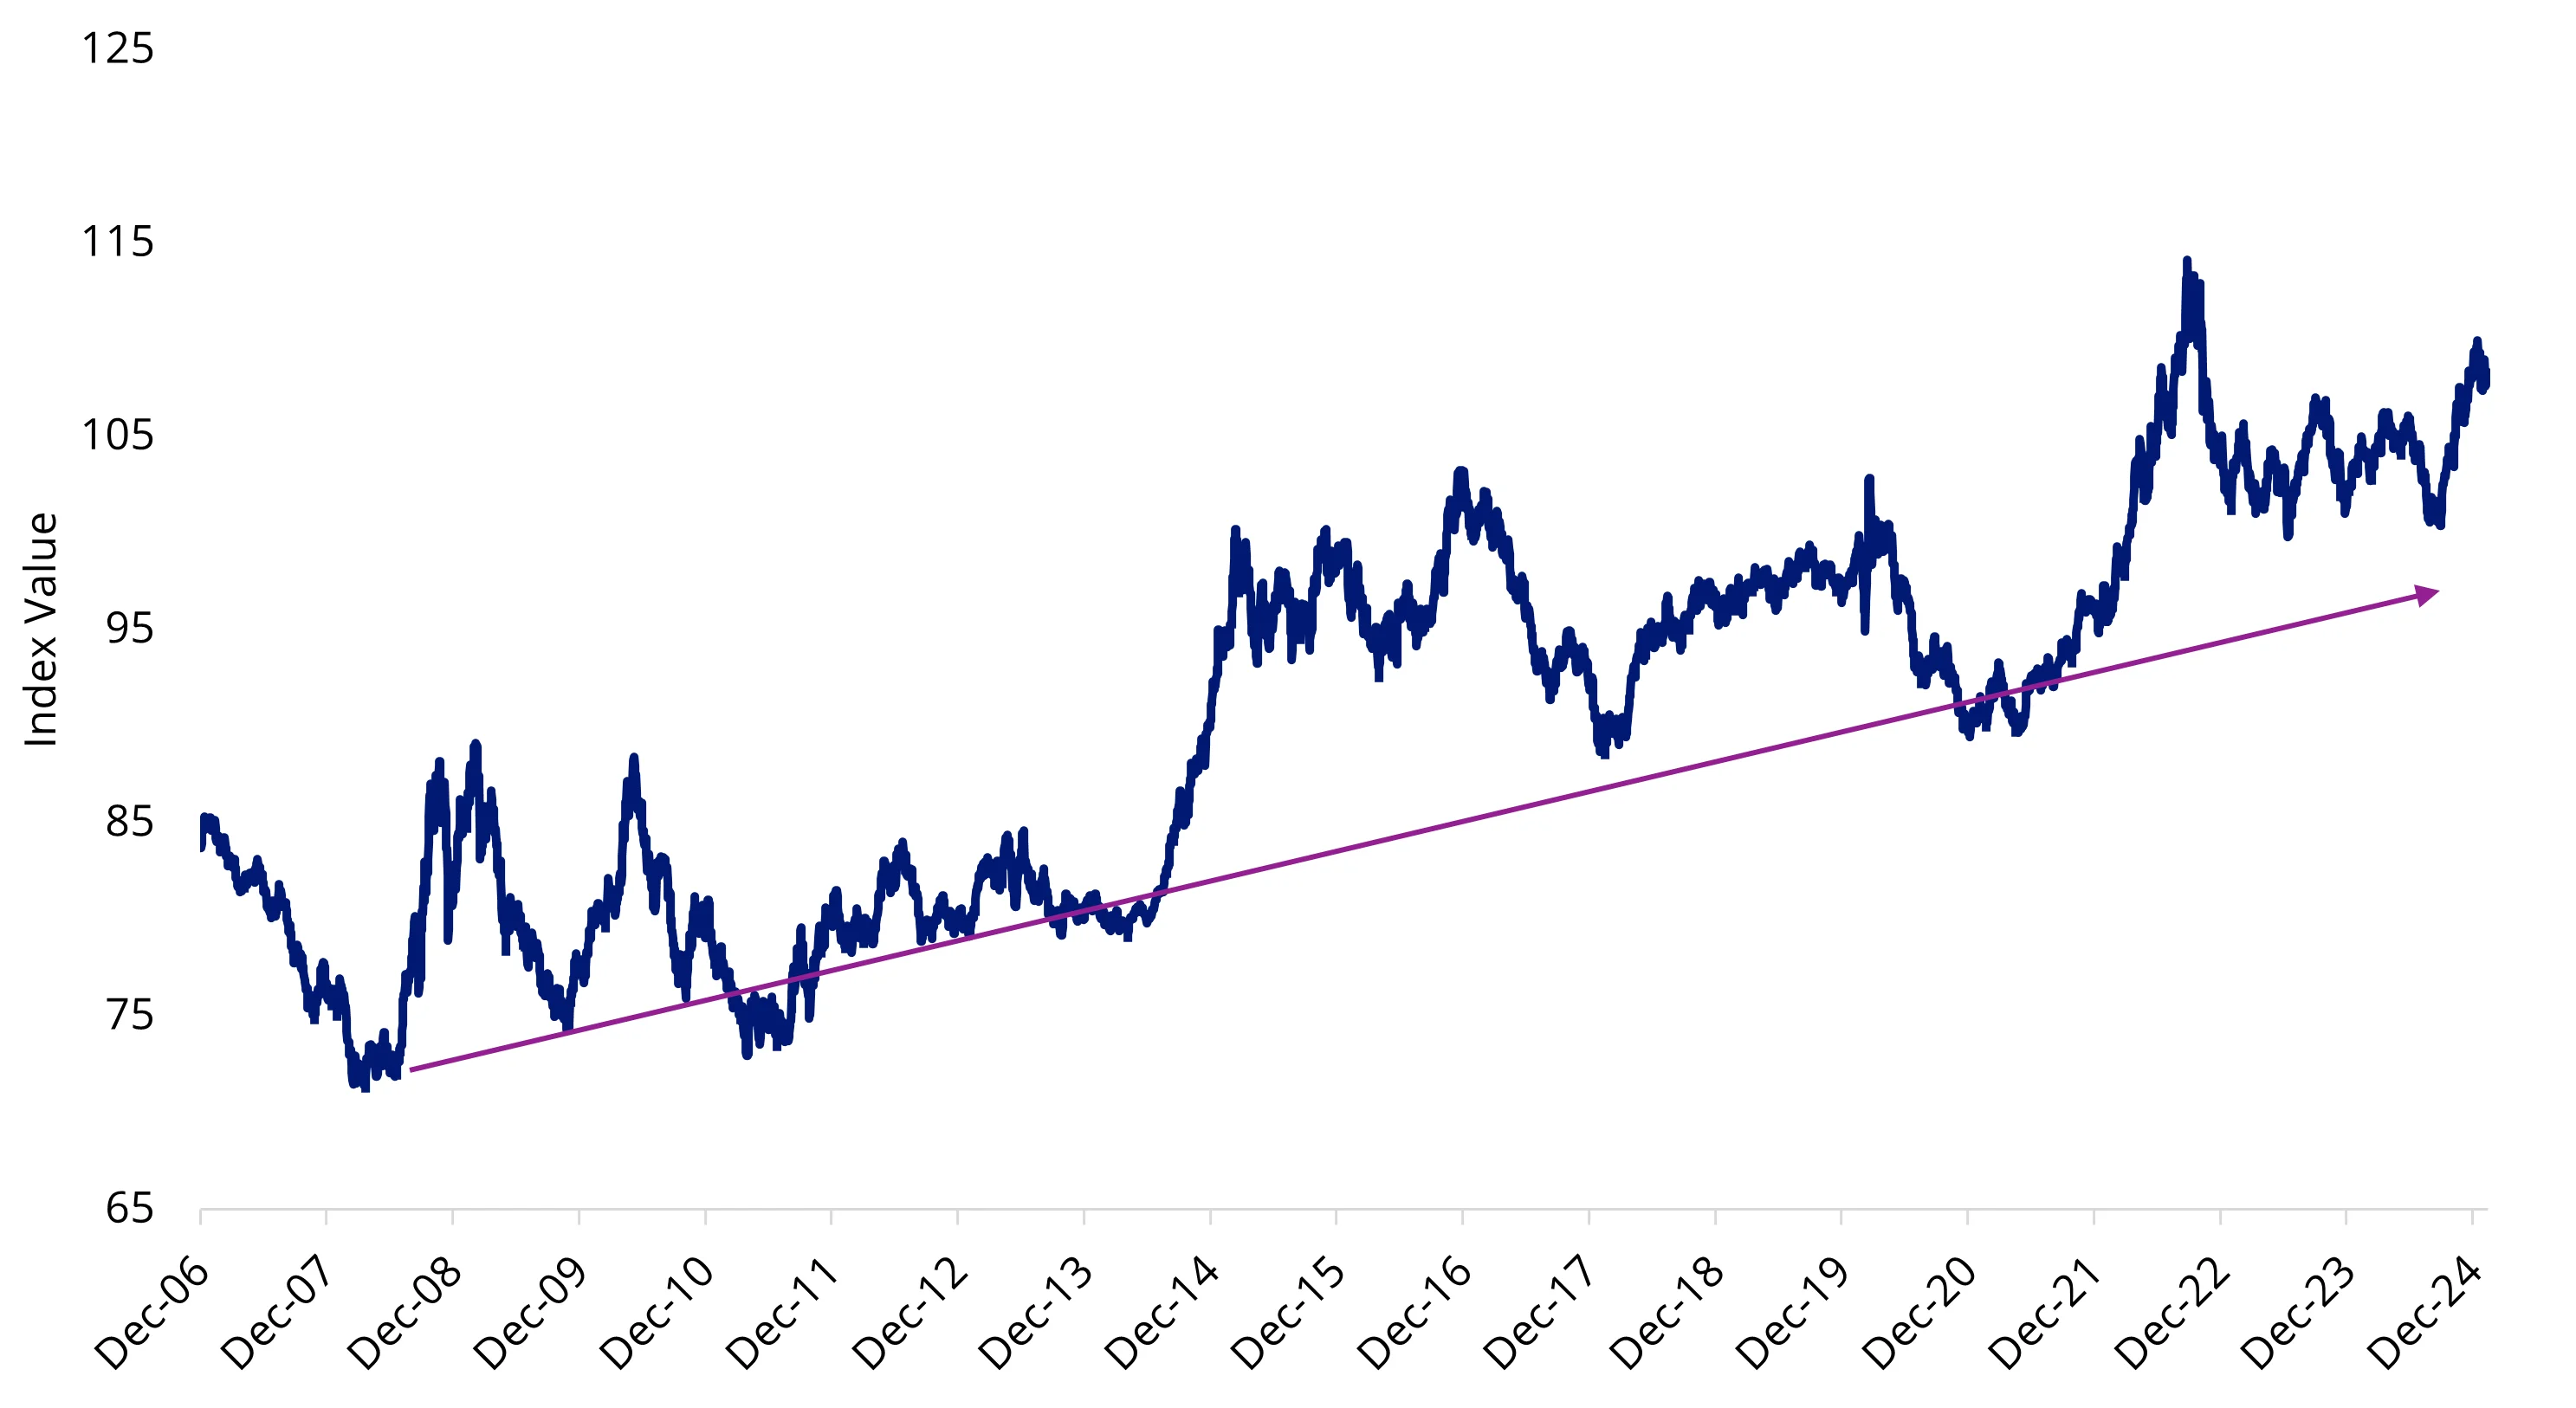
Source: FactSet. Data as of February 12, 2025. Past performance is no guarantee of future results. Index performance is not representative of strategy performance. It is not possible to invest in an index.
Despite its strength, the dollar has been devaluing relative to gold—an unprecedented trend that few view as a threat to the currency or sign of a precipitated crisis.
Historically, gold bull markets have been driven by three things:
- Runaway inflation – gold surged 1500% in the 1970s
- A failing dollar – gold climbed 302% from 2001 to 2008
- Financial crises – gold increased 134% from 2008 to 2011
The current gold bull market, which began in 2016, is remarkable because it is not accompanied by US dollar weakness or a global financial crisis. While the pandemic was a crisis, its financial impact was short-lived, thanks to massive government intervention.
Erosion of confidence in the dollar
Another driver has emerged: people and nations that have long used, coveted and hoarded the US dollar are now losing faith and trust in the currency as a store of wealth. This shift began in 2008 when the global financial crisis led many to question the efficacy of the banking system and western economic hegemony. It escalated with sanctions and freezing of assets imposed on Russia by the US. Other countries fear that similar retribution or “weaponisation of the dollar” is possible for lesser infractions than the hostile invasion of another country. Now tariffs have been weaponised. Gold has gained 275% since Lehman Brothers failed in 2008 and 50% since Russia invaded Ukraine in 2022. Additionally, irresponsible fiscal policies and political chaos in the US suggest that one or more of the traditional drivers of gold may reemerge. As a result, the world is slowly and methodically moving away from the dollar, a shift most evident in changes to currency reserves and increased central bank gold purchases.
China has been exiting US treasuries while increasing its gold reserves:
Chart 2: China’s US Treasury Holdings vs. Gold Reserves (2013-2024)
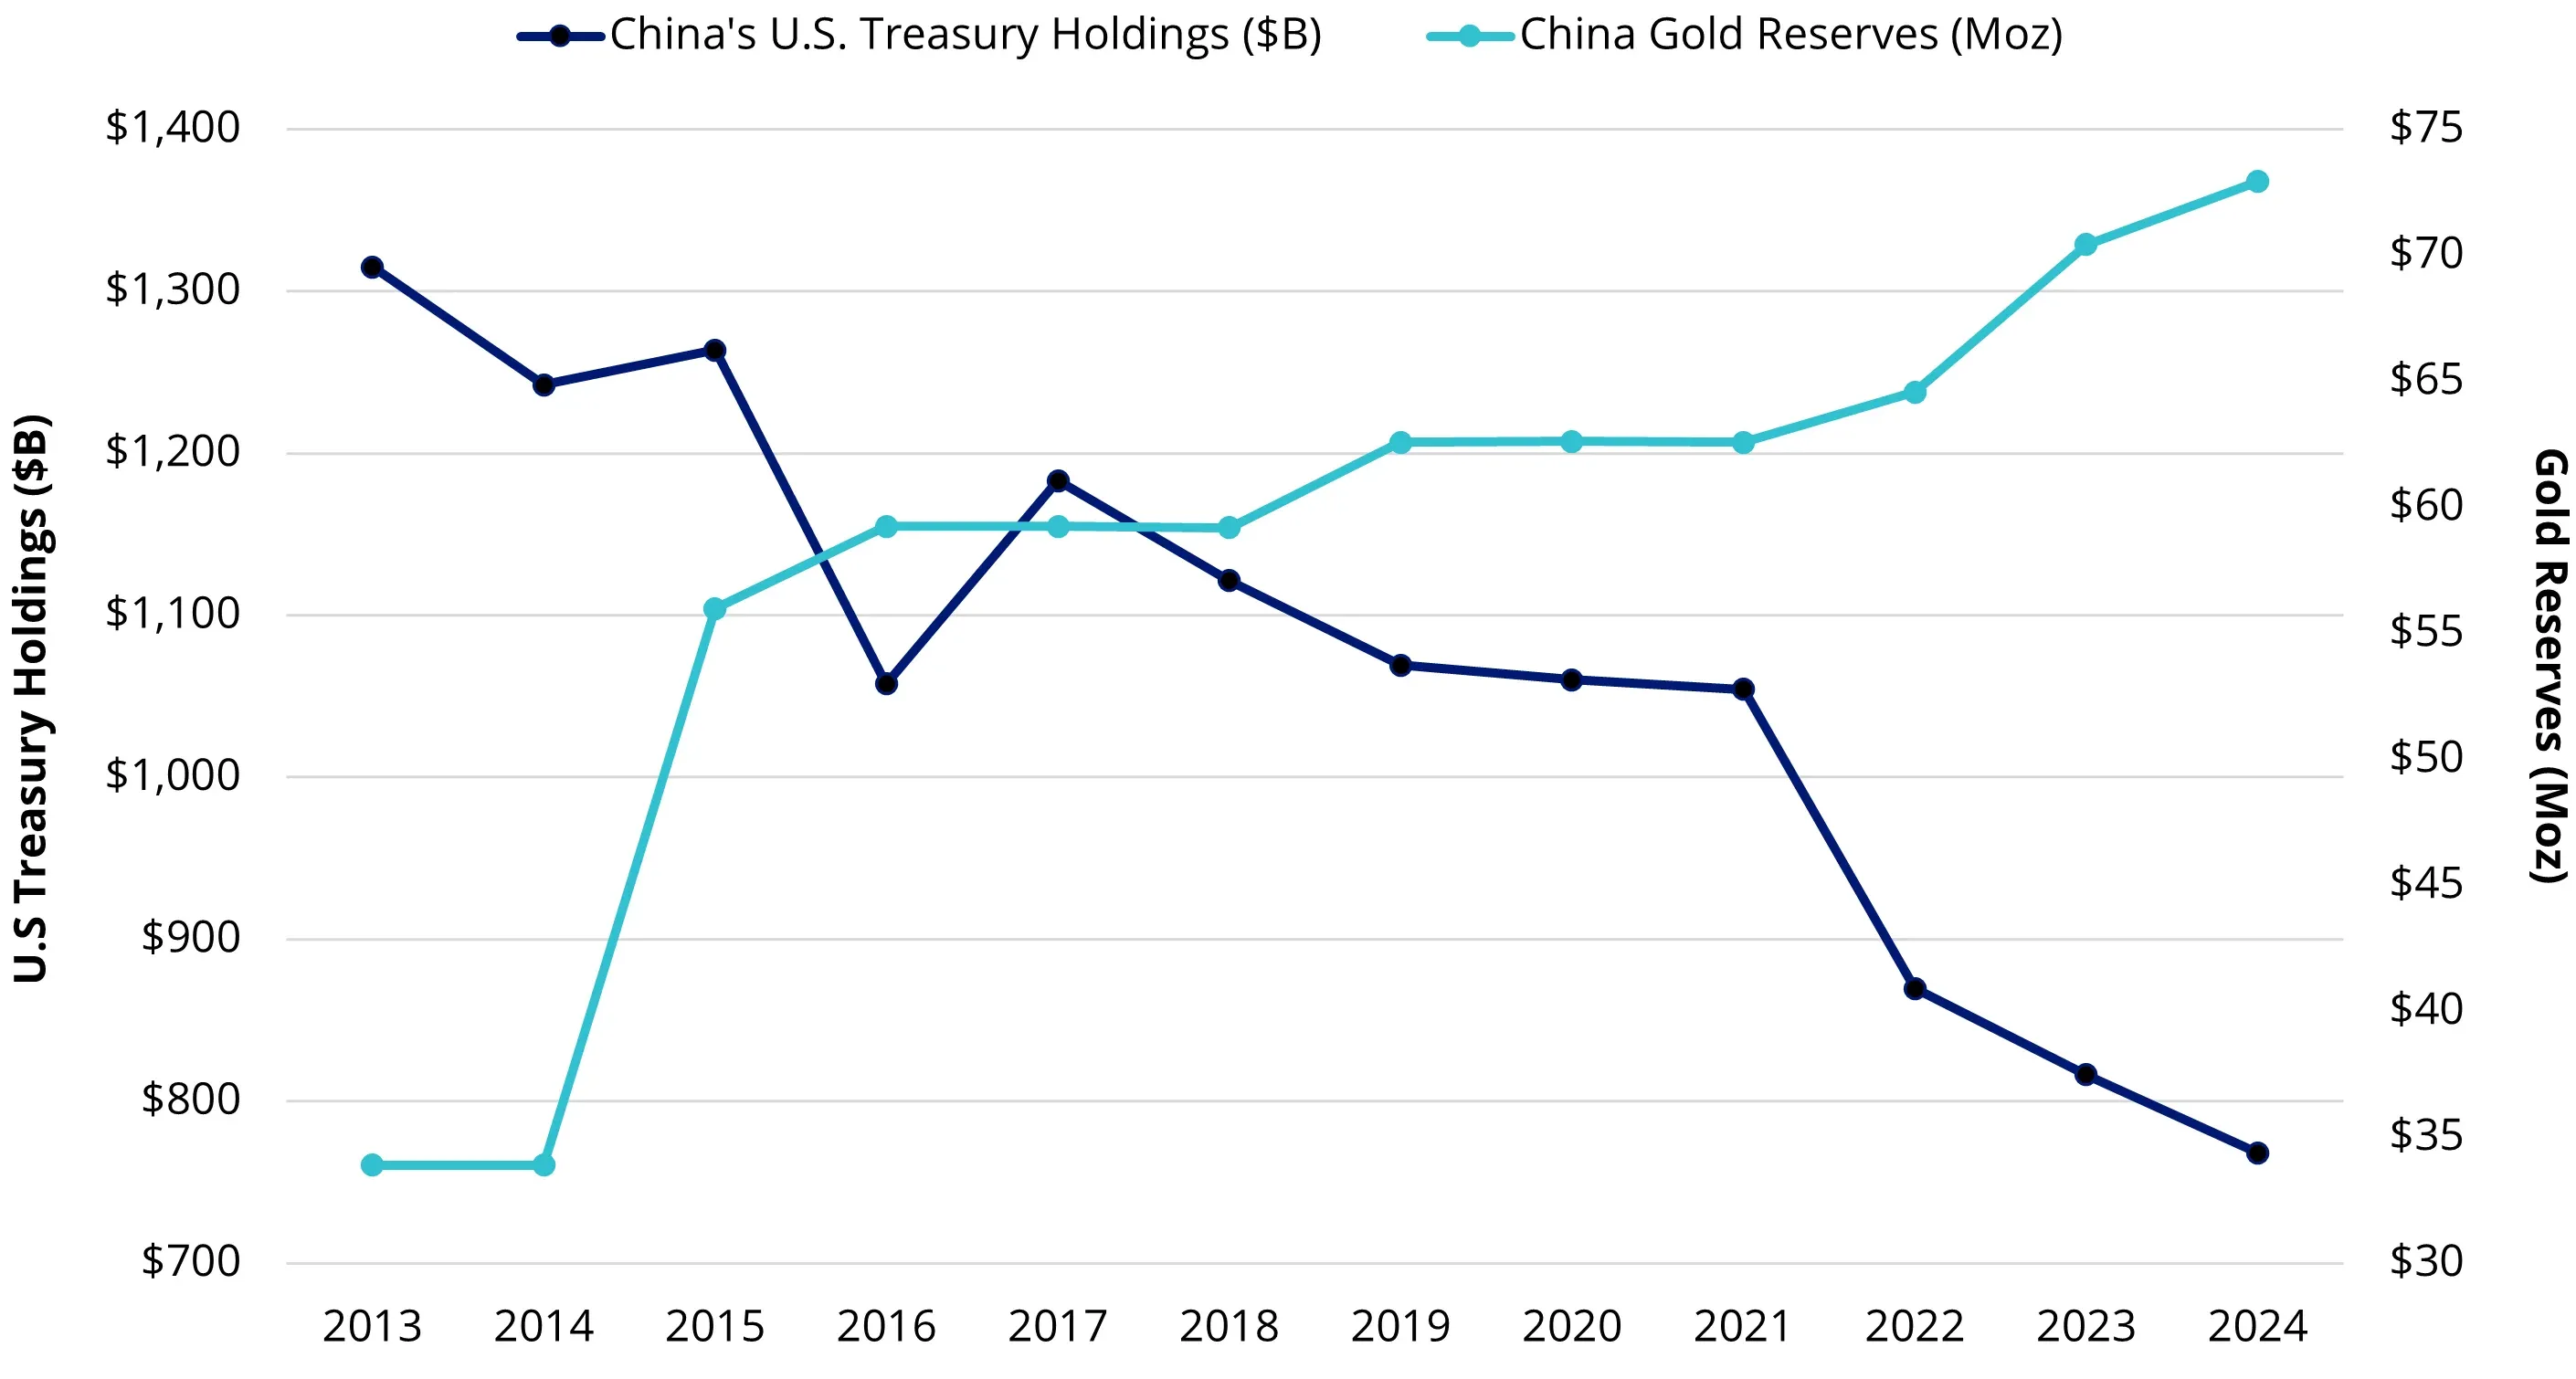
Source: Bloomberg. Data as of December 2024.
Central bank net purchases of gold began in earnest after the financial crisis and accelerated after the Ukraine invasion:
Chart 3: Gold demand trends Q4 and full year 2024 – Central banks have been net buyers for 15 years
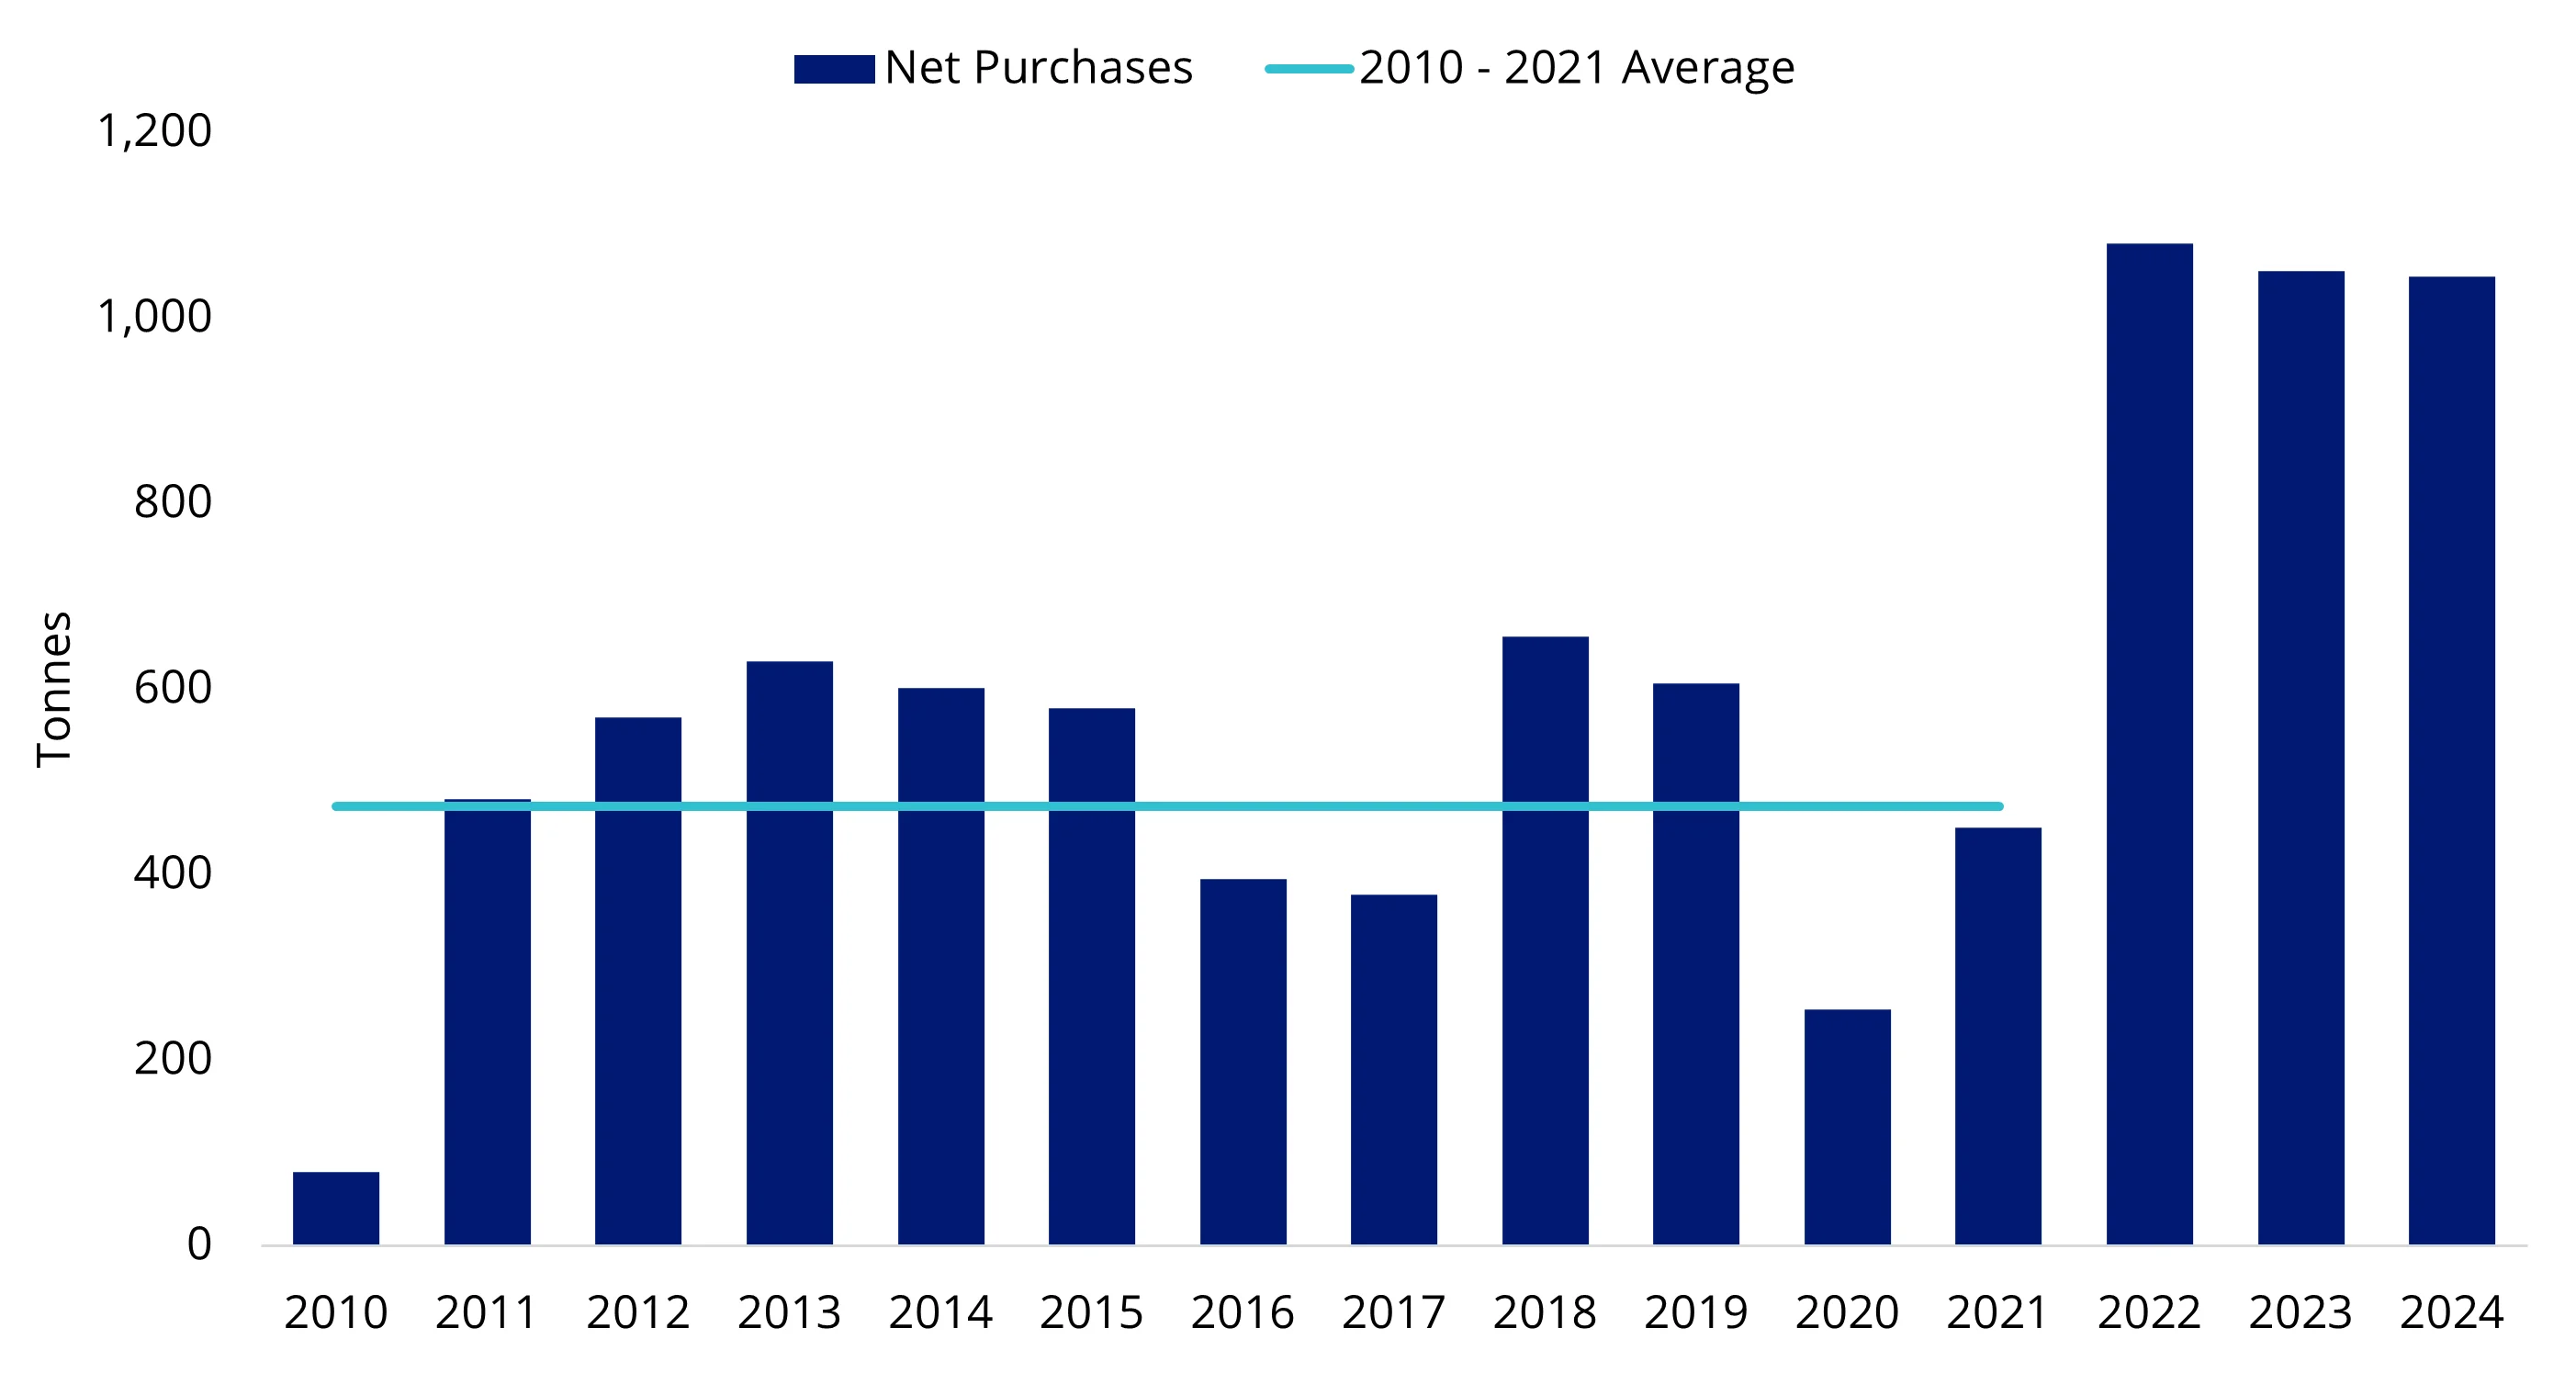
Source: Metals Focus, LSEG Data & Analytics (formerly Refinitiv), ICE Benchmark Administration, and World Gold Council. Data as of December 2024.
We believe this marks the start of longer-term trends that will become recognised as a crisis of confidence in the US dollar, potentially driving gold prices much higher than many expect. If a digital asset like bitcoin, created and residing within servers, can be valued at US$100,000, then surely an ounce of a tangible, reliable safe-haven asset like gold could reach a small fraction of that value.


Published: 09 March 2025
Any views expressed are opinions of the author at the time of writing and is not a recommendation to act.
VanEck Investments Limited (ACN 146 596 116 AFSL 416755) (VanEck) is the issuer and responsible entity of all VanEck exchange traded funds (Funds) trading on the ASX. This information is general in nature and not personal advice, it does not take into account any person’s financial objectives, situation or needs. The product disclosure statement (PDS) and the target market determination (TMD) for all Funds are available at vaneck.com.au. You should consider whether or not an investment in any Fund is appropriate for you. Investments in a Fund involve risks associated with financial markets. These risks vary depending on a Fund’s investment objective. Refer to the applicable PDS and TMD for more details on risks. Investment returns and capital are not guaranteed.
NYSE Arca Gold Miners Index is a service mark of ICE Data Indices, LLC or its affiliates (“ICE Data”) and has been licensed for use by Van Eck Associates Corporation (“VanEck”). VanEck products are not sponsored, endorsed, sold or promoted by ICE Data. ICE Data makes no representations or warranties regarding VanEck products or the ability of the NYSE Arca Gold Miners Index to track general stock market performance.
ICE DATA MAKES NO EXPRESS OR IMPLIED WARRANTIES, AND HEREBY EXPRESSLY DISCLAIMS ALL WARRANTIES OF MERCHANTABILITY OR FITNESS FOR A PARTICULAR PURPOSE WITH RESPECT TO THE NYSE ARCA GOLD MINERS INDEX OR ANY DATA INCLUDED THEREIN. IN NO EVENT SHALL ICE DATA HAVE ANY LIABILITY FOR ANY SPECIAL, PUNITIVE, INDIRECT, OR CONSEQUENTIAL DAMAGES (INCLUDING LOST PROFITS), EVEN IF NOTIFIED OF THE POSSIBILITY OF SUCH DAMAGES.