To US$3,500 and beyond
Gold’s remarkable rally goes beyond inflation and real yields. Here, we delve into the drivers behind its record run and what could propel prices even higher.
Earlier in the month, the gold price was well above US$3,100, rising almost US$500 since the start of the year. Capital markets in 2025 have been driven by uncertainty about global politics, and while many markets have fallen, gold has shone. Not for the first time in the recent past, gold is being used as a hedge against geopolitical uncertainty. It is also a hedge against inflation.
Gold up on the prospect of US rate cuts
Gold prices have hit record highs in the last six months. Year-to-date, it has gained about 18%. This surge has been driven, in part, by uncertainty about tariffs, as investors flocked to this ‘safe haven’ asset.
Chart 1: LBMA PM Gold Price: A year of records
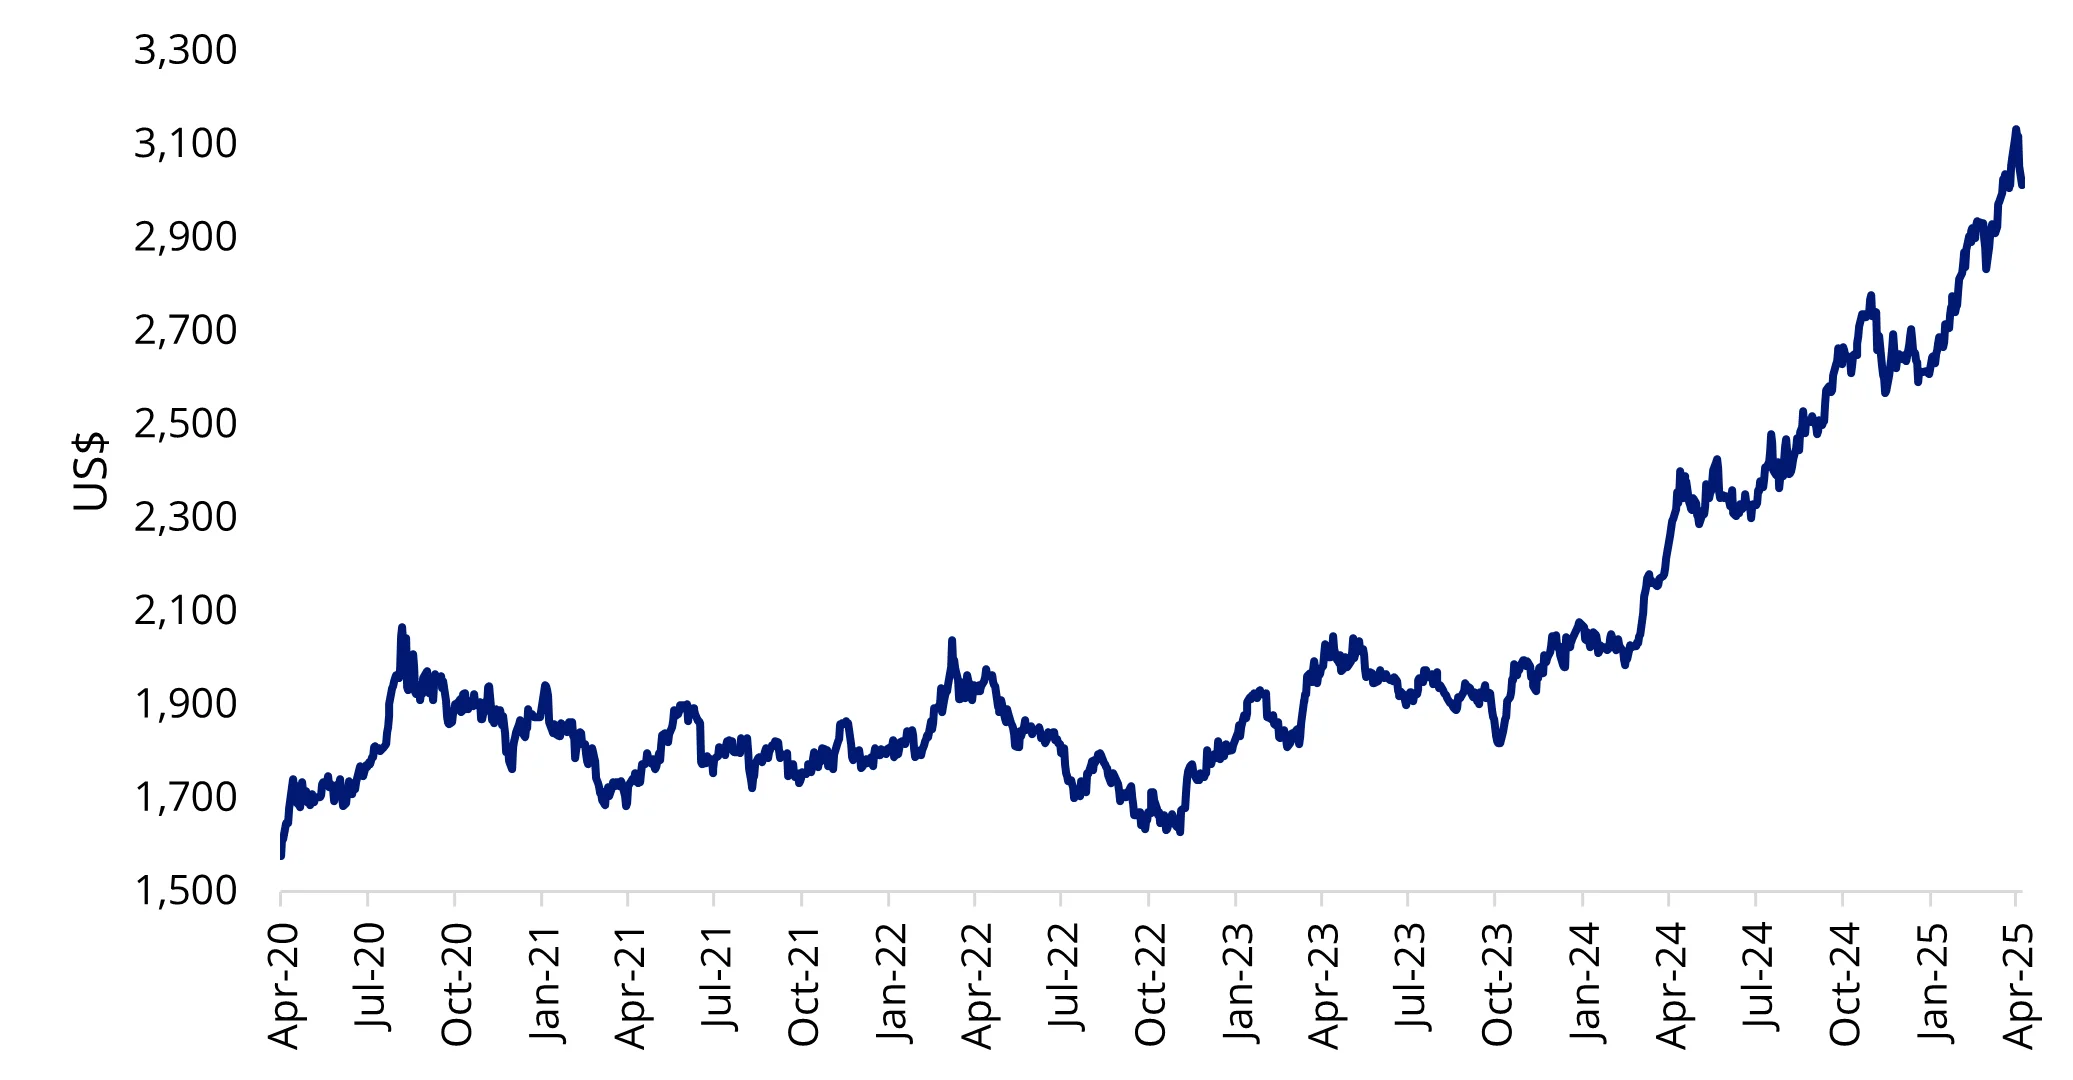
Source: LBMA, Bloomberg, 7 April 2025. Past performance is not indicative of future results.
While the bullion rally slowed down last week after the tariffs were announced, tailwinds are supporting the price of the yellow metal into the rest of 2025. These tailwinds include predicted rate cuts and increasing demand for gold.
The immediate impact of tariffs is inflation. And the market swiftly reacted, pricing in four Fed rate cuts during the rest of 2025 to combat recessionary risks.
Chart 2: Implied overnight rate & number of hikes/cuts for US Federal Reserve
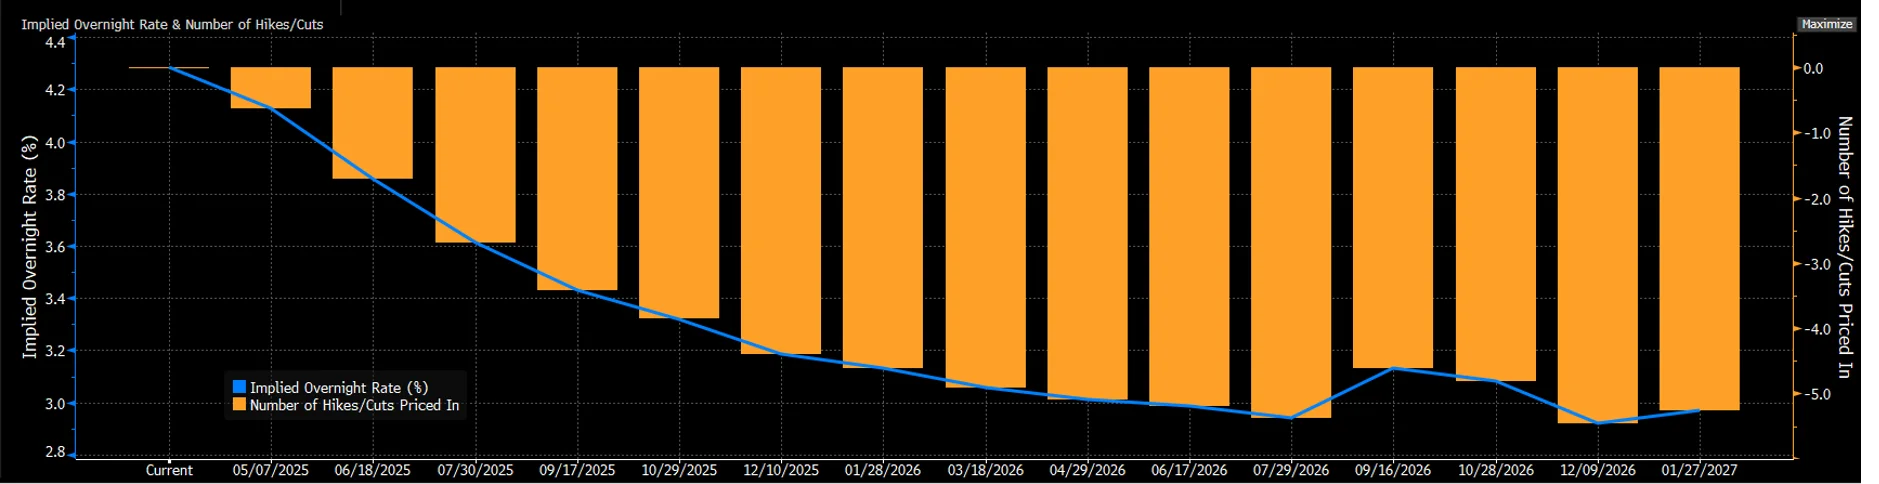
Source: Bloomberg, 9 April 2025
These cuts would be to rate levels that could be described as ‘emergency’. Gold tends to do well in a recession or weak economic environment, and with real yields so low, demand for the price of gold could continue to put upward pressure on its price.
The path of US monetary policy has a meaningful impact on gold prices over the near term. Historically, gold tends to perform well following the first Fed rate cuts. Over the last three rate-cutting cycles, gold has averaged a 25% return over 500 trading days.
Chart 3: Gold historically performs well following the first Fed rate cuts
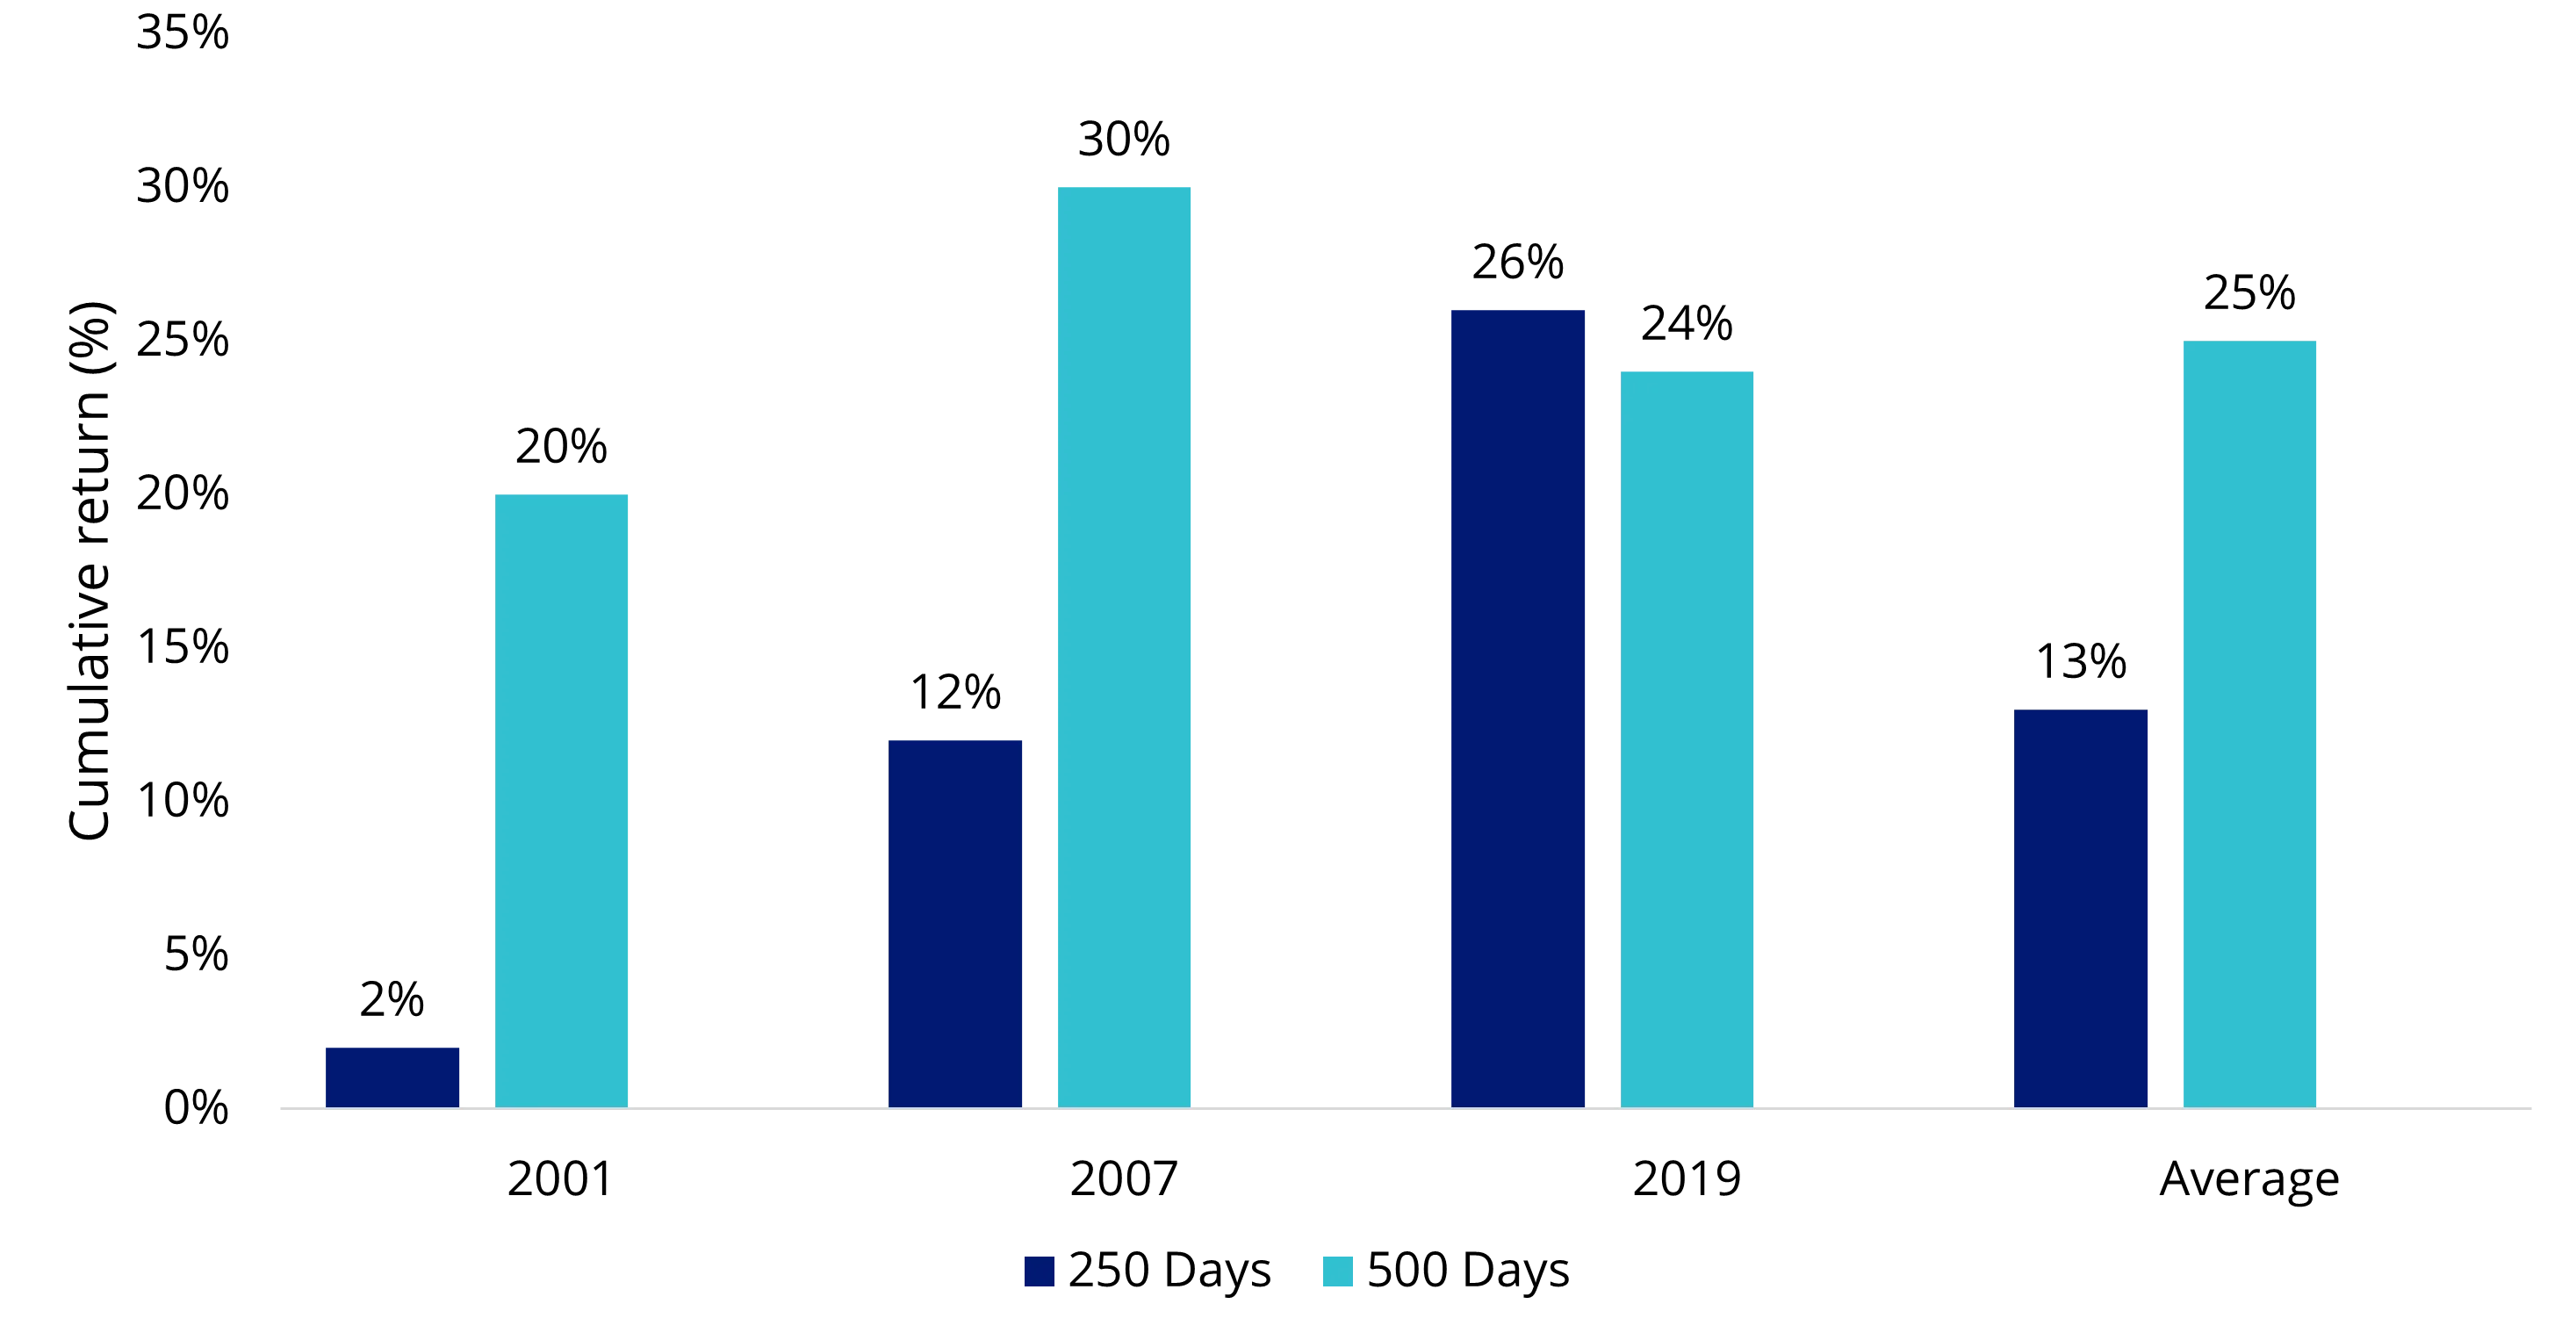
Source: JPMorgan, VanEck. Data as of 31 March, 2025. Past performance is not indicative of future results.
It’s not just inflation and real yields driving demand for gold
Many central banks have been buying gold bullion, potentially in anticipation of trade wars and economic sanctions.
Russia, the most sanctioned country in the world, has been reaping the rewards of its long-running gold accumulation strategy that began well before the Russia-Ukraine war.
Chart 4: The Bank of Russia was actively purchasing gold from 2014 through to 2020 when prices were low
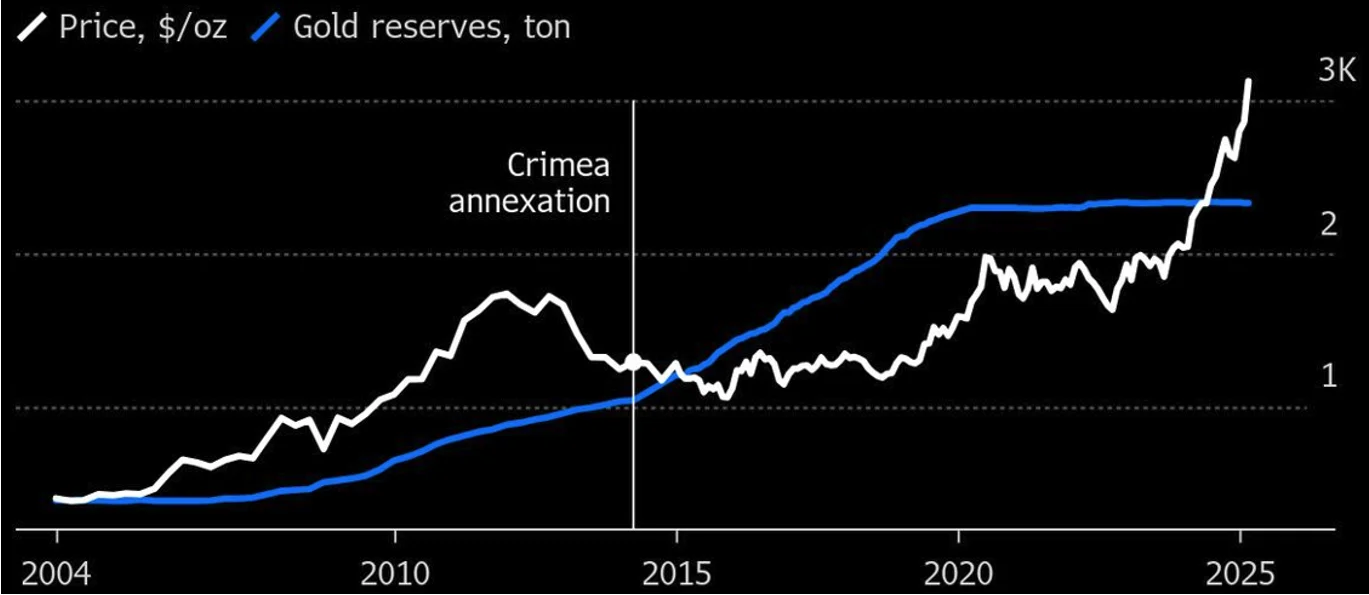
Source: Bank of Russia, Bloomberg. Past performance is not indicative of future results.
Russia has used gold to:
- Reduce reliance on foreign-held reserves exposed to political risk
- Boost ruble liquidity by swapping gold for local currency
- Sustain steady demand for domestic gold miners
The strategy worked. Since early 2022, Russia’s gold reserves have surged 72% in value. That’s roughly US$96 billion. This increase covers about a third of the country’s frozen foreign assets.
Chart 5: Soaring gold prices offset part of Russia’s central bank losses in FX reserves
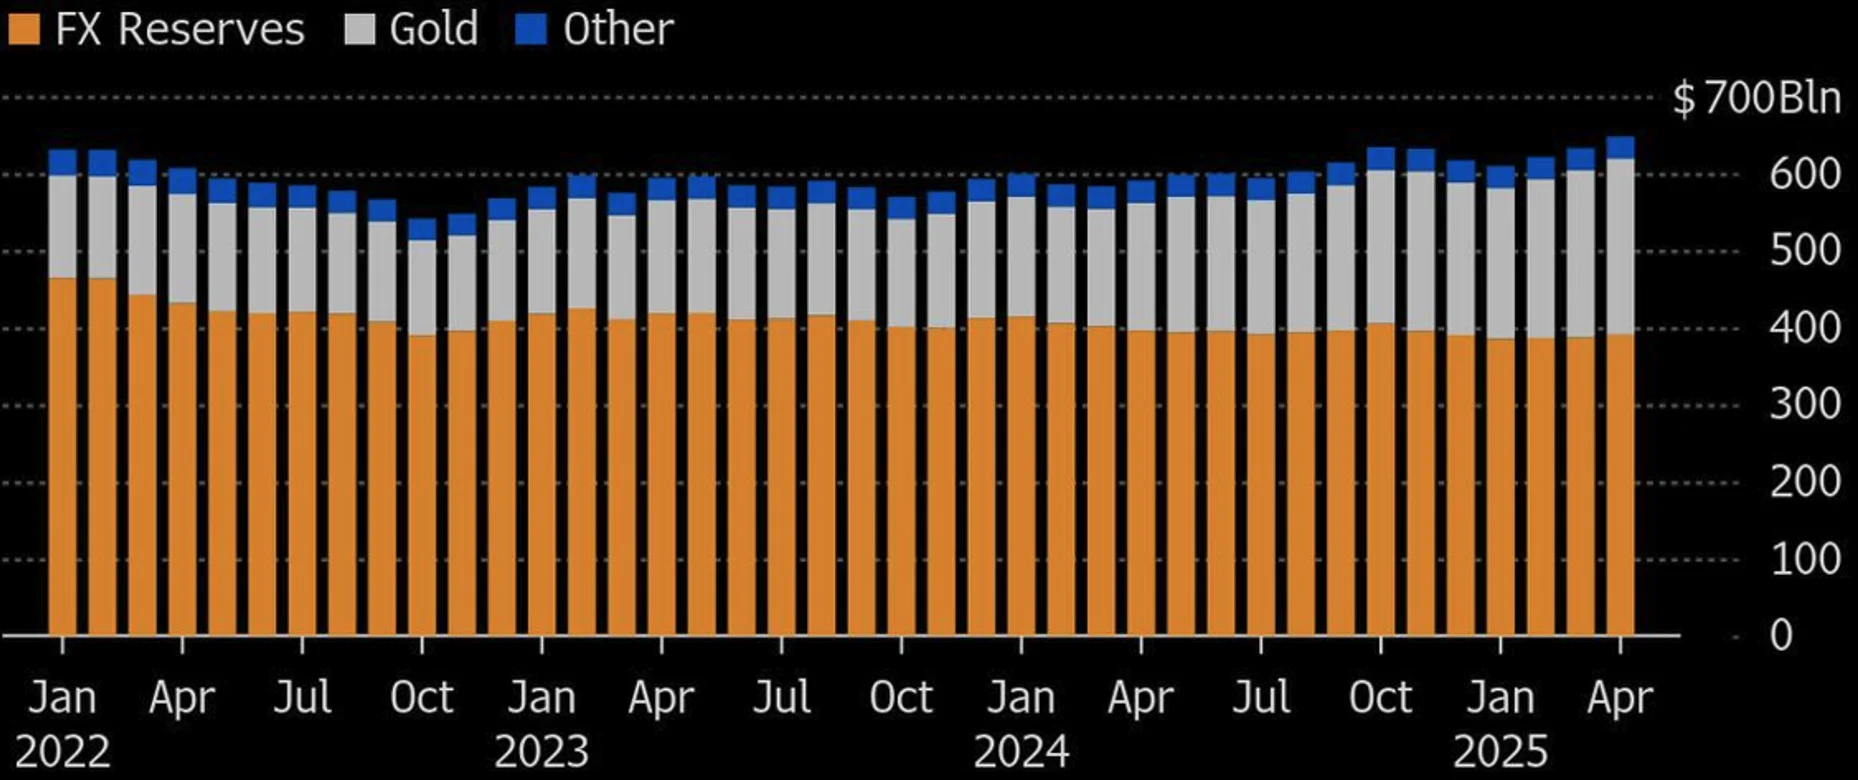
Source: Bank of Russia, Bloomberg
Gold has worked as a hedge against geopolitical risk. Now let’s look at what China has been doing in preparation for its trade war (we highlighted this in our recent ViewPoints).
Chart 6: China’s US Treasury holdings versus gold reserves (2013-2024)
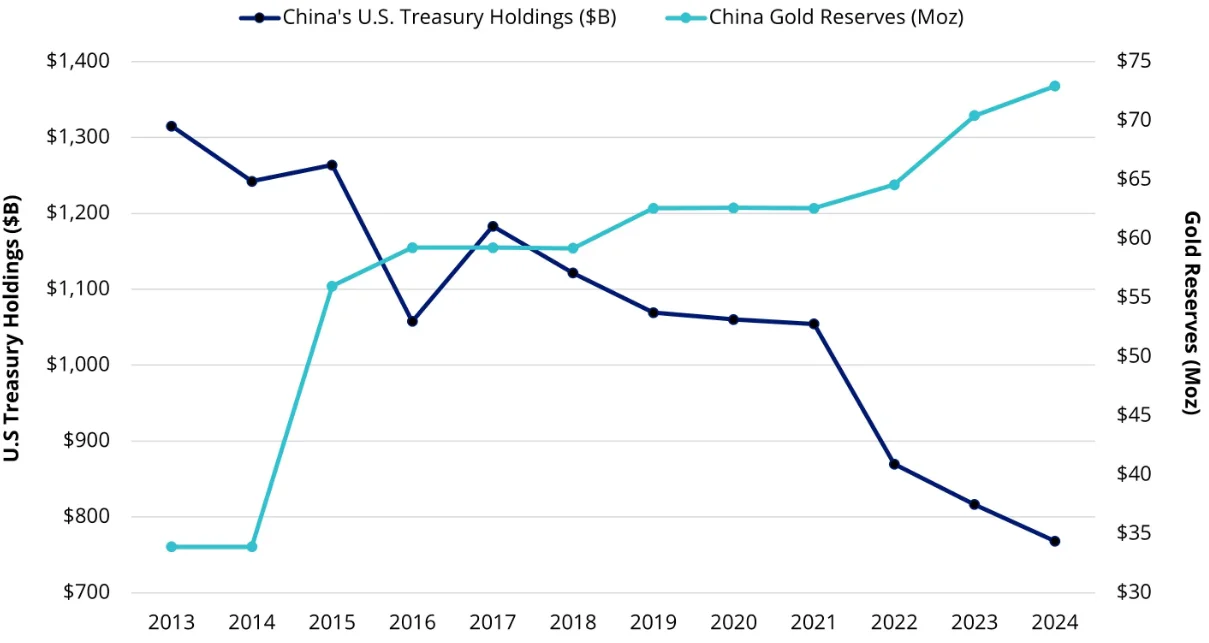
Source: Bloomberg. Data as of December 2024.
We think central banks around the world will continue to accumulate gold as a hedge against geopolitical risks. This demand is a tailwind for the price of gold.
The return of Western investors to gold and strong demand from central banks
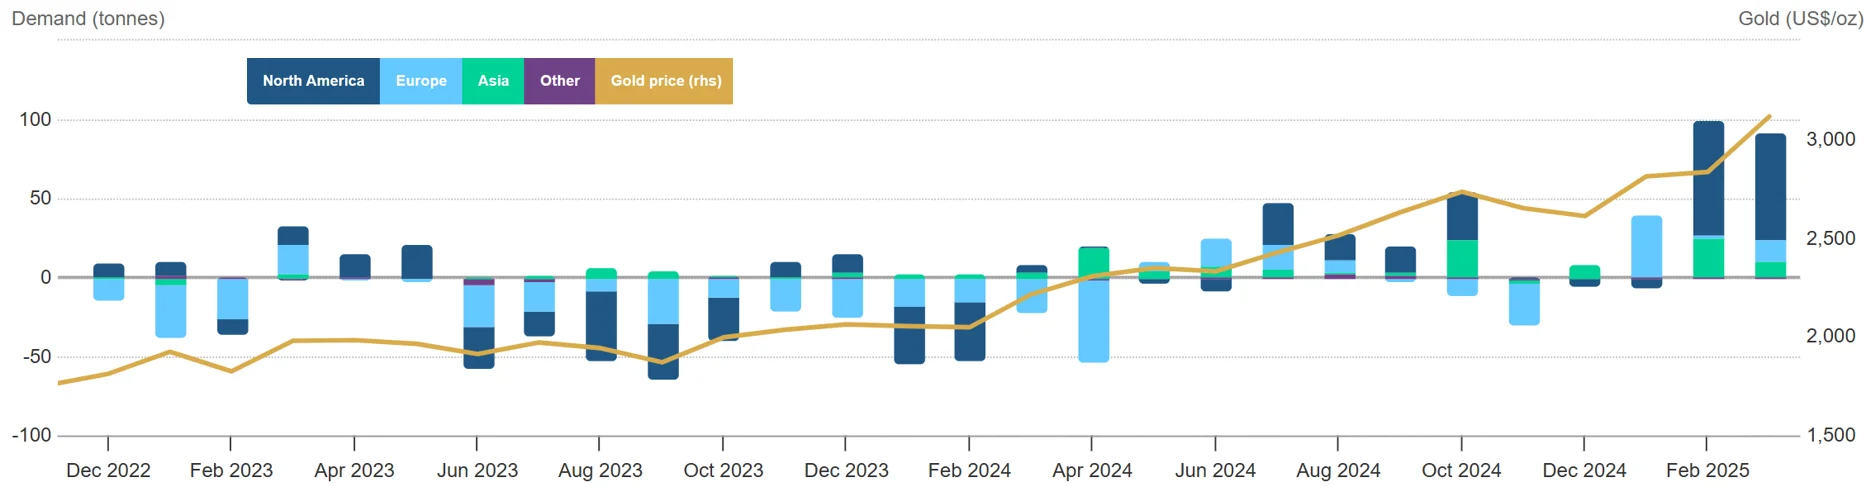
In our view, one of the largest opportunities for gold is the potential return of Western investors to gold. Investment demand, which traditionally has been the main driver of gold prices, has been relatively weak during the 2023 - 2024 gold rally. However, we are starting to see signs of returning investment demand.
According to the World Gold Council (WGC), global gold ETF funds added 92 tonnes of gold last month, worth US$8 billion. The WGC noted that “After four monthly inflows in a row, total AUM of global gold ETFs reached another month-end peak of US$345bn and holdings rose 3% to 3,445t.”
These flows into gold-backed ETFs could continue to pick up. These inflows, largely from Western investors concerned about US economic risks and geopolitics, could push gold prices toward US$3,500 per ounce.
Chart 7: Total ETF gold holdings vs. gold price
Western demand, coupled with central bank buying, and uncertainty about the outcome of the trade war, provides a good opportunity to consider investing in gold now.
Access gold through VanEck ETFs
VanEck Gold Bullion ETF (ASX: NUGG)
- Provides investors with direct, secure, and cost-effective exposure to physical gold bullion.
- NUGG’s gold is only sourced from Australian gold producers whose operations adhere to the LBMA Responsible Gold Guidance.
- Gold bullion is held by The Perth Mint with a registered gold bar list published daily.
- Tradeable on ASX and redeemable at the Perth Mint - investors can convert their NUGG holdings into physical gold bullion.
Key Risks
An investment in this gold bullion ETF carries risks associated with: Gold pricing risk, currency risk, custody risk, gold bullion risk, concentration risk, liquidity risk, operational risk and regulatory and tax risk. See the VanEck Gold Bullion ETF and PDS TMD for more details. show less.


Published: 10 April 2025
Any views expressed are opinions of the author at the time of writing and is not a recommendation to act.
VanEck Investments Limited (ACN 146 596 116 AFSL 416755) (VanEck) is the issuer and responsible entity of all VanEck exchange traded funds (Funds) trading on the ASX. This information is general in nature and not personal advice, it does not take into account any person’s financial objectives, situation or needs. The product disclosure statement (PDS) and the target market determination (TMD) for all Funds are available at vaneck.com.au. You should consider whether or not an investment in any Fund is appropriate for you. Investments in a Fund involve risks associated with financial markets. These risks vary depending on a Fund’s investment objective. Refer to the applicable PDS and TMD for more details on risks. Investment returns and capital are not guaranteed.