Gold responds in March
Risks rise, gold goes higher
Gold set a new high for the year on March 20, trading at US$2,009 per ounce. This represented a US$200 move from its monthly low of US$1,809 on March 8. Gold climbed its way higher as the markets tried to digest the news and assess the ripple effects of the rapid collapse of Silicon Valley Bank (SVB) and Signature Bank over the course of a weekend. The metal found further support as the risks spread to Europe, with Credit Suisse needing a rescue, which included the surprise wipeout of US$17 billion of the bank’s AT1 bonds. Panic and fear subsided as governments, regulators and central banks worldwide intervened and/or reassured investors in an effort to restore market confidence.
Next, attention turned to the Federal Open Market Committee (FOMC) rate decision on March 22. The US Federal Reserve (Fed) increased the federal funds rate by 0.25% to 5.0%. Rate increases are generally viewed as negative for gold. However, treasury rates, which fell following the banking turmoil, fell further after the Fed’s last hike, as did the US dollar. This was positive for gold, which managed to hang on to most of its gains, closing at US$1,969 on March 3 – a US$142 per ounce (7.8%) advance for the month.
The US dollar (DXY Index) fell 2.2%, while the 2-year and 10-year treasury rates dropped 0.79% and 0.45% respectively, during March. Gold stocks outperformed the metal. The NYSE Arca Gold Miners Index was up 19.4% during the month of March.
Effect of higher rates in full display
We continue to believe the market is ignoring the negative effect of sustained higher rates on the global financial system. We are already experiencing some of these effects, such as the recent defaults by two large office owners caused by the higher interest rate environment. There is potential for more problems from the record levels of debt held globally. The collapse of SVB was triggered by the banks’ need to recapitalise, as its large portfolio of treasury bonds declined in value due to rising rates. This past month’s events and gold’s performance proves that one should own gold in this volatile environment. Here are some of our observations:
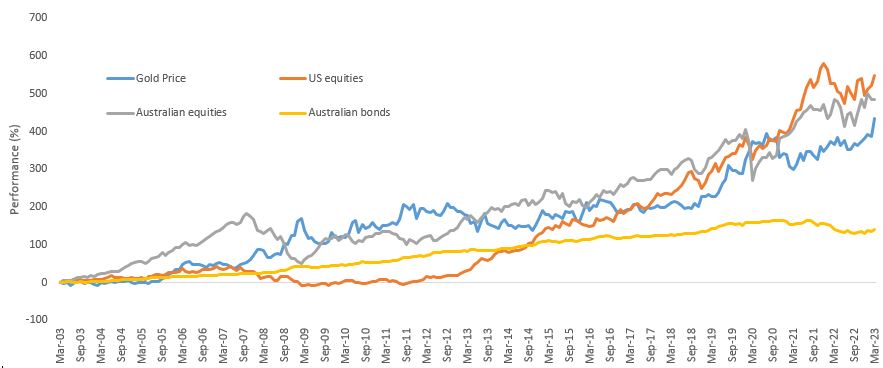
- Trying to time the gold market is futile. Because of its attributes, we believe that gold should enjoy a permanent allocation in any portfolio. In particular, its low correlation with most other asset classes make it an effective portfolio diversifier. Black swan events cannot be predicted, but investors can be proactive and maintain a gold allocation that offers some protection when these events do happen.
As shown below, gold’s performance over the past 20+ years has been favourable:

Source: Bloomberg. US equities is S&P® 500 Index. Gold price is LBMA PM Gold Price. Australian equities is S&P/ASX 200 Index. Australian Bonds is Bloomberg AusBond Composite 0+ years Index. All returns in Australian dollars. You cannot invest in an index. Past performance is not indicative of future results.
- In March, gold did what we would expect it to do in times of crisis. Gold outperformed the US dollar, the S&P 500, the NASDAQ, crude, copper and bonds.
Source: Morningstar. Data as of March 31, 2023. U.S. Stocks represented by S&P® 500 Index; Gold ($/oz) represented by LBMA PM Gold Price; U.S. Treasuries represented by the Bloomberg Barclays U.S. 1-3 Year Treasury Bond Index.
- Also, as expected, gold stocks demonstrated their leverage to the gold price by significantly outperforming the metal. It is worth mentioning that gold equities are coming from oversold levels relative to gold over the last two years. Despite the strong performance in March, gold equities still have more room to close that gap. For reference, when gold was last US$1,970 per ounce in April 2022, GDMNTR was approximately US$1,350 vs US$1,110 at present.
Source: Bloomberg. Data as of March 31, 2023. Gold Stocks represented by the NYSE Arca Gold Miners Index (GDMNTR).
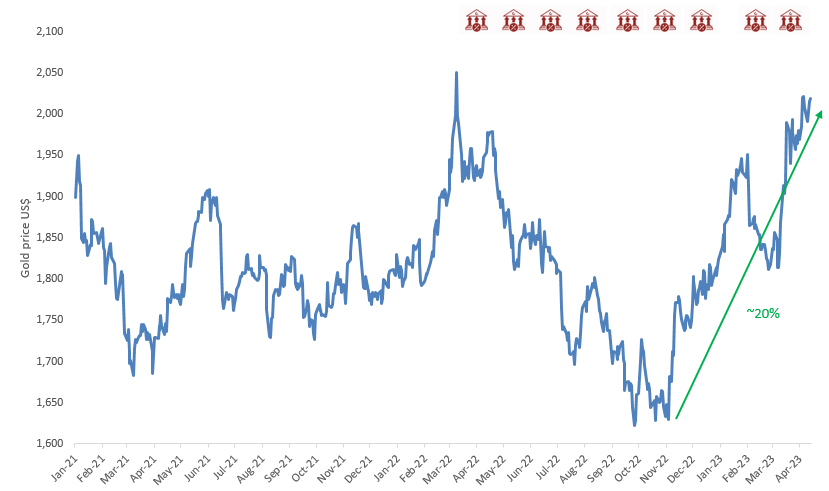
- Gold sustained its gains even as the Fed hiked one more time. Gold has increased more than 20% over the period of the last three rate hikes – rallying well ahead of a Fed pause or pivot, as it did during the previous rate hiking cycle.

Source: Bloomberg. Data as of 13 April, 2023.
- Global gold bullion ETF holdings, our best proxy for investment demand, finally registered their first month of net inflows since April 2022, with holdings up almost 1% in March. There is a strong positive correlation between the gold price and the holdings of gold ETFs. However, up until March, the recent strength in the gold price had been met with persistent outflows from the gold bullion ETFs. March inflows signaled an improved gold market sentiment, but current holdings still are well below historical levels. The last time gold was $1,970 per ounce, in April of 2022, global gold ETF holdings were more than 12% higher than they are today.
- Gold COMEX net long positioning also picked up. As of March 31, 2023, COMEX net long positions stood at approximately 482 tonnes, according to the World Gold Council. This compares with approximately 819 tonnes in April 2022.
Performance reaffirms its role as a safe haven
Gold and gold stocks have performed as expected in this environment. We think this performance reaffirms gold’s role as a safe haven investment and a legitimate form of portfolio insurance. Last month’s developments should act as a wakeup call to those lacking exposure to the gold sector. And the entry point isn’t terrible either. Despite the heightened level of risk in March, gold didn’t hit its all-time highs.
We don’t believe the market is fully reflecting the risks ahead. The Fed came to the rescue once again. The crisis seems contained for now. Consumer confidence ticked up in March, and the US stock market managed to finish the month with gains. Complacency set in. This market action would suggest the equity market party isn’t over yet. Now could be a good time to invest in gold, due to its safe haven properties.
Financial stresses still remain
We were assured time and again of the strength and resilience of the banking system after the improved regulatory and supervisory regimes that followed the 2008 financial crisis, and yet here we are facing the biggest US banking failure in more than a decade. The resulting banking crisis exposed the fragility and risks facing the global financial system. We believe this is supportive of higher gold prices in the longer term. These risks include (in both the US and globally) persistent and elevated inflation, a weakening economy, debt service strains, elevated geopolitical risks and black swan events.
Last year, we posed these questions:
- Rising rates bring significant risks to the financial system. The liability-driven investing (LDI) market crisis in the UK is a clear example of this. Could there be more cracks in the system that start to show under the stress of higher rates, increased volatility and market weakness?
- The world has been operating in a zero-rate environment for a long time, what do higher and rising rates mean to a world consumed in debt?
- How do we service that debt at the same time as we are dealing with slowing growth and high levels of inflation?
These questions are more relevant today than ever. They were reasonable questions to ask in 2022 as the Fed embarked on its aggressive rate hiking cycle. There were and there likely continue to be more cracks in the system—something else could break. A black swan event is generally described as having three main attributes: it is unpredictable; it results in severe and widespread consequences; and after its occurrence, people and markets will rationalise the event as having been predictable, known as “hindsight bias”. One example is the failure of SVB. No one saw it coming, it had severe consequences and, now everyone is wondering how management and regulators could have missed it. There may be more black swans out there.
Market’s underestimating a hard landing?
Worsening financial conditions are expected to lead to the end of the Fed’s rate hiking cycle. The market is already pricing in cuts in 2023. This is positive for gold. However, we believe the market has yet to price in the negative impact of a policy change in the fight against inflation and the increasing likelihood of a hard landing or recession. Gold’s appeal increases under these scenarios. As evidenced by the gold ETF and Comex positioning, investors have yet to come back in full force to benefit from gold’s role as an inflation hedge, as a safe haven in periods of economic, financial and geopolitical volatility, and importantly, as a portfolio diversifier. What happened in March should crystallise the need to add gold exposure to every portfolio.
Published: 13 April 2023
Any views expressed are opinions of the author at the time of writing and is not a recommendation to act.
VanEck Investments Limited (ACN 146 596 116 AFSL 416755) (‘VanEck’) is the issuer and responsible entity of all VanEck exchange trades funds (Funds) listed on the ASX. This is general advice only and does not take into account any person’s financial objectives, situation or needs. The product disclosure statement (PDS) and the target market determination (TMD) for all Funds are available at vaneck.com.au. You should consider whether or not an investment in any Fund is appropriate for you. Investments in a Fund involve risks associated with financial markets. These risks vary depending on a Fund’s investment objective. Refer to the applicable PDS and TMD for more details on risks. Investment returns and capital are not guaranteed.
NYSE Arca Gold Miners Index is a service mark of ICE Data Indices, LLC or its affiliates (“ICE Data”) and has been licensed for use by VanEck ETF Trust (the “Trust”) in connection with VanEck Gold Miners ETF (the “Fund”). Neither the Trust nor the Fund is sponsored, endorsed, sold or promoted by ICE Data. ICE Data makes no representations or warranties regarding the Trust or the Fund or the ability of the NYSE Arca Gold Miners Index to track general stock market performance.
ICE DATA MAKES NO EXPRESS OR IMPLIED WARRANTIES, AND HEREBY EXPRESSLY DISCLAIMS ALL WARRANTIES OF MERCHANTABILITY OR FITNESS FOR A PARTICULAR PURPOSE WITH RESPECT TO THE NYSE ARCA GOLD MINERS INDEX OR ANY DATA INCLUDED THEREIN. IN NO EVENT SHALL ICE DATA HAVE ANY LIABILITY FOR ANY SPECIAL, PUNITIVE, INDIRECT, OR CONSEQUENTIAL DAMAGES (INCLUDING LOST PROFITS), EVEN IF NOTIFIED OF THE POSSIBILITY OF SUCH DAMAGES.


