As gold hits high, miners remain an opportunity
Here comes the volatility
August 2024 was a month of volatility in global financial markets. On 5 August, a sharp sell-off in equities spread across the globe. The primary trigger appeared to have been a surprise rate hike from Japan's central bank after decades of near-zero rates, which led to a sudden unwinding of carry trades and a dramatic sell-off in global equities. TOPIX (Tokyo Stock Price Index) saw its largest one-day drop since 1987, falling by 12%. In the United States, the S&P 500 and Nasdaq Composite indices also experienced significant declines. The turbulence was exacerbated by fears that the US economic expansion may be coming to an end, following a weaker than expected July jobs report. Meanwhile many of the world’s economies are struggling
Not immune, but resilient…
Gold and gold equities were not immune to the turmoil, but like the rest of the markets, managed to bounce back after the panic subsided. Supported by expectations of lower interest rates, financial markets stabilised towards month end.
During his Jackson Hole speech, U.S. Federal Reserve Chairman Jerome Powell said, “the time has come for policy to adjust”, reaffirming expectations for a rate cut in September. The gold price set new records once again in August, trading above the US$2,500 per ounce level by mid-month, and reaching an all-time high of US$2,524.64 at the close on 27 August. The gold price was up US$55.79 (2.28%) during the month of August, closing at US$2,503.39 per ounce on 30 August.
Gold miners finished the month down (in Australian dollar terms) with the NYSE Arca Gold Miners Index falling 1.41% during the month.
Where’s the leverage?
Gold miners didn’t outperform gold bullion in August. This is surprising considering that gold reached new highs, and that the cash flow generation and the valuations of these companies have improved. We estimate that, on average for the sector, margins expanded by about 8% in August compared to July. This is based on average all-in sustaining costs for the sector of around US$1,400 per ounce and average gold spot prices for July and August of US$2,392 and US$2,470, respectively. Similarly, for those companies not yet in production (smaller caps), the value of their estimated gold in the ground has increased with the higher spot price, yet their valuations were unchanged during the month.
This suggests that the market is not yet valuing in these record gold prices. In its most recent Gold Monthly Statistics, Scotiabank estimates that the gold price reflected in the gold mining equities is on average about a 23% discount to current spot gold price. Scotiabank’s report also contains historical data for a variety of valuation metrics for the sector which show that current valuations are at historical lows. Today, the adjusted market capitalisation of Scotiabank’s universe per ounce of reserves in the ground is at the lowest multiple to the gold price as it has ever been.
Replacing gold reserves is getting harder
Yet, replacing these reserves is harder today than it has ever been before, which, in theory, should render each ounce more valuable. BofA Global Research (via S&P Global Market Intelligence data), estimates a sharp decline in the number of new gold discoveries, from an average of about 18 discoveries annually from 1990-1999, to 12 annual discoveries in the 2000s, to just 4 in the 2010s. They estimate there have been only 5 major gold discoveries from 2020 to 2023. Finding large, economic gold deposits is becoming harder.
Chart 1: Global gold discoveries & exploration budgets
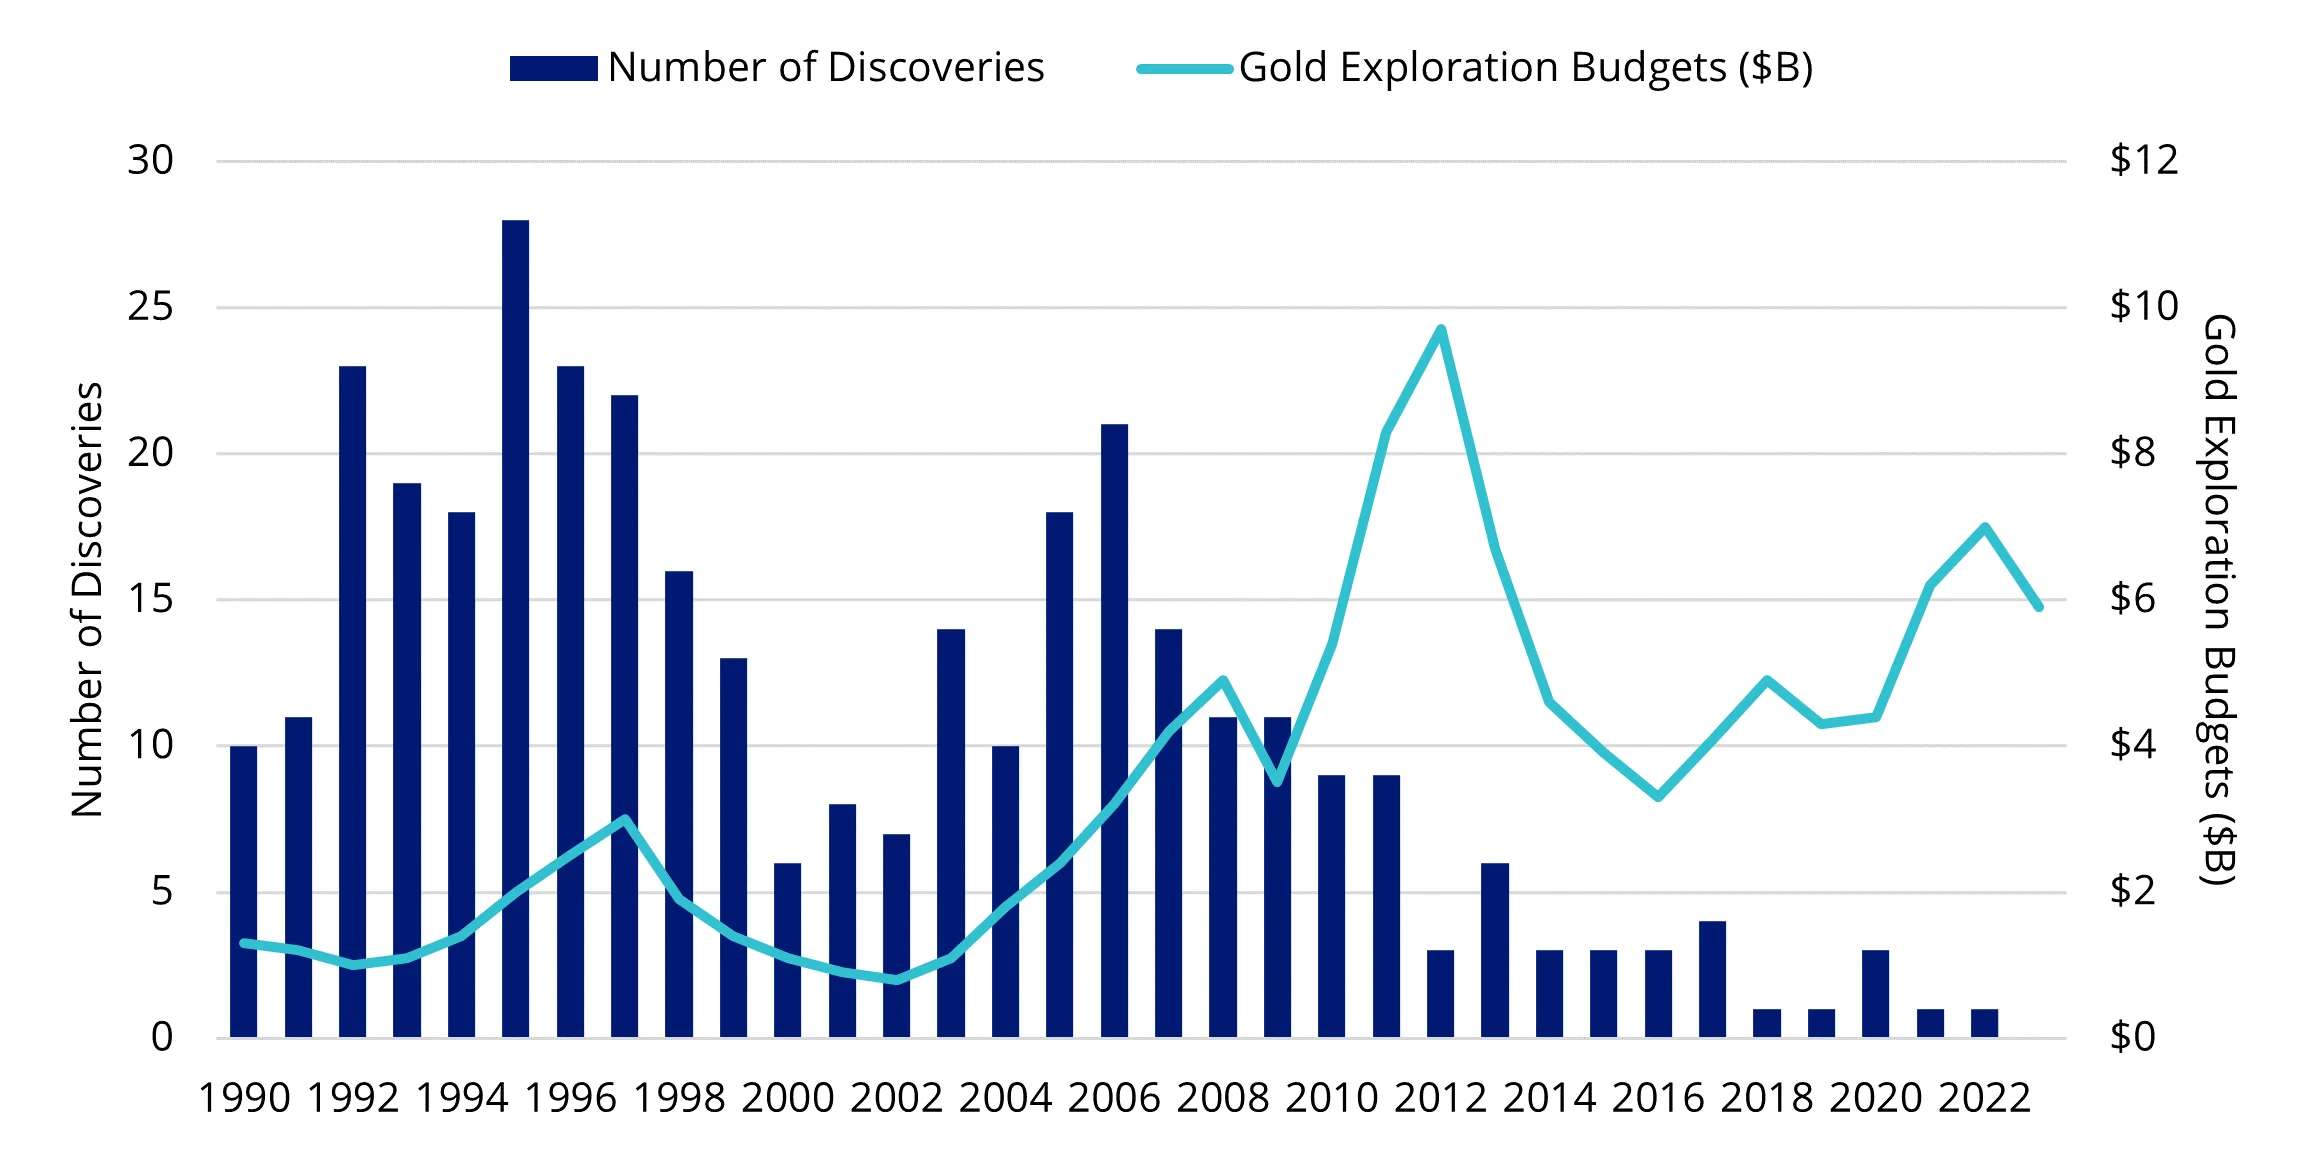
Source: BofA Global Research (via S&P Global Market Intelligence). Data as of August 2024.
We expect the gold price to remain supported around current levels with potential to go higher when Western investors decide it is time to search for the benefits gold has historically offered being a defensive opportunity, agnostic to economic conditions and a hedge against uncertainty. This should lead to more appetite for gold stocks and a re-rating of the sector to reflect valuation multiples more in-line with those observed in previous gold bull markets.
Chart 2: Adjusted market cap per ounce of reserve (divided by gold price)
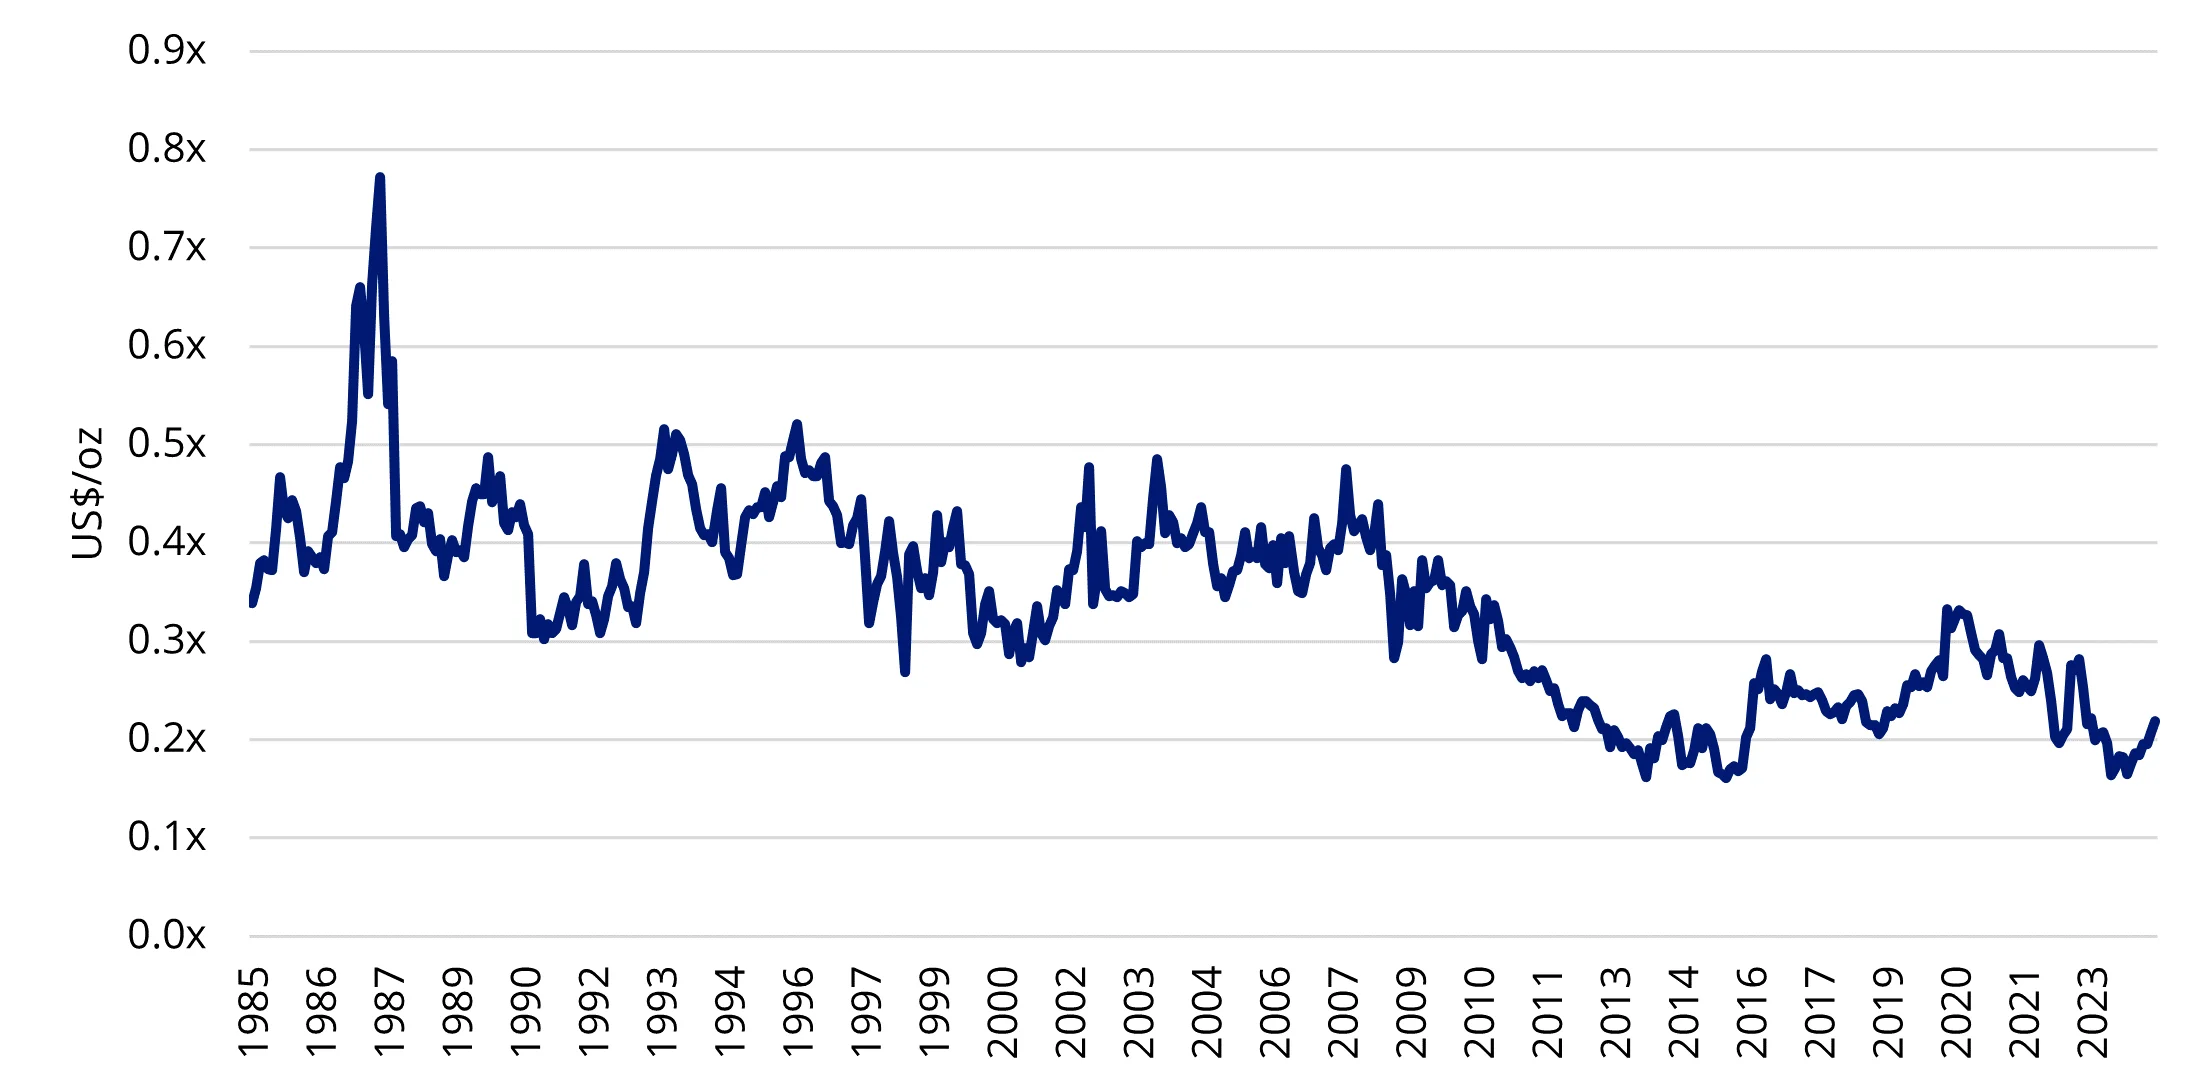
Source: Scotiabank. Data as of August 2024. Figures represent the average of Scotiabank’s North American coverage.
Will we see a rebound in Western investment demand?
Western investors have not yet jumped into the gold markets in full force. However, the World Gold Council reported estimated positive fund flows into the North American gold bullion ETF products during July and August and into the European products since May. This is an important reversal in the persistent trend of outflows global gold bullion ETFs have experienced since mid-2022. this could be the initial stages of returning investment demand.
The early August, and early September, equity markets’ weakness is signaling increasing concern about the health of the US economy and the risk of a recession. Investors looking for more defensive, recession resistant opportunities or a place to hide during periods of heightened uncertainty and volatility, may finally turn to the gold sector. The historically cheap, financially strong gold mining equities should stand out as an attractive play to gain gold exposure.
Chart 3: Gold ETF flows by region (tonnes)
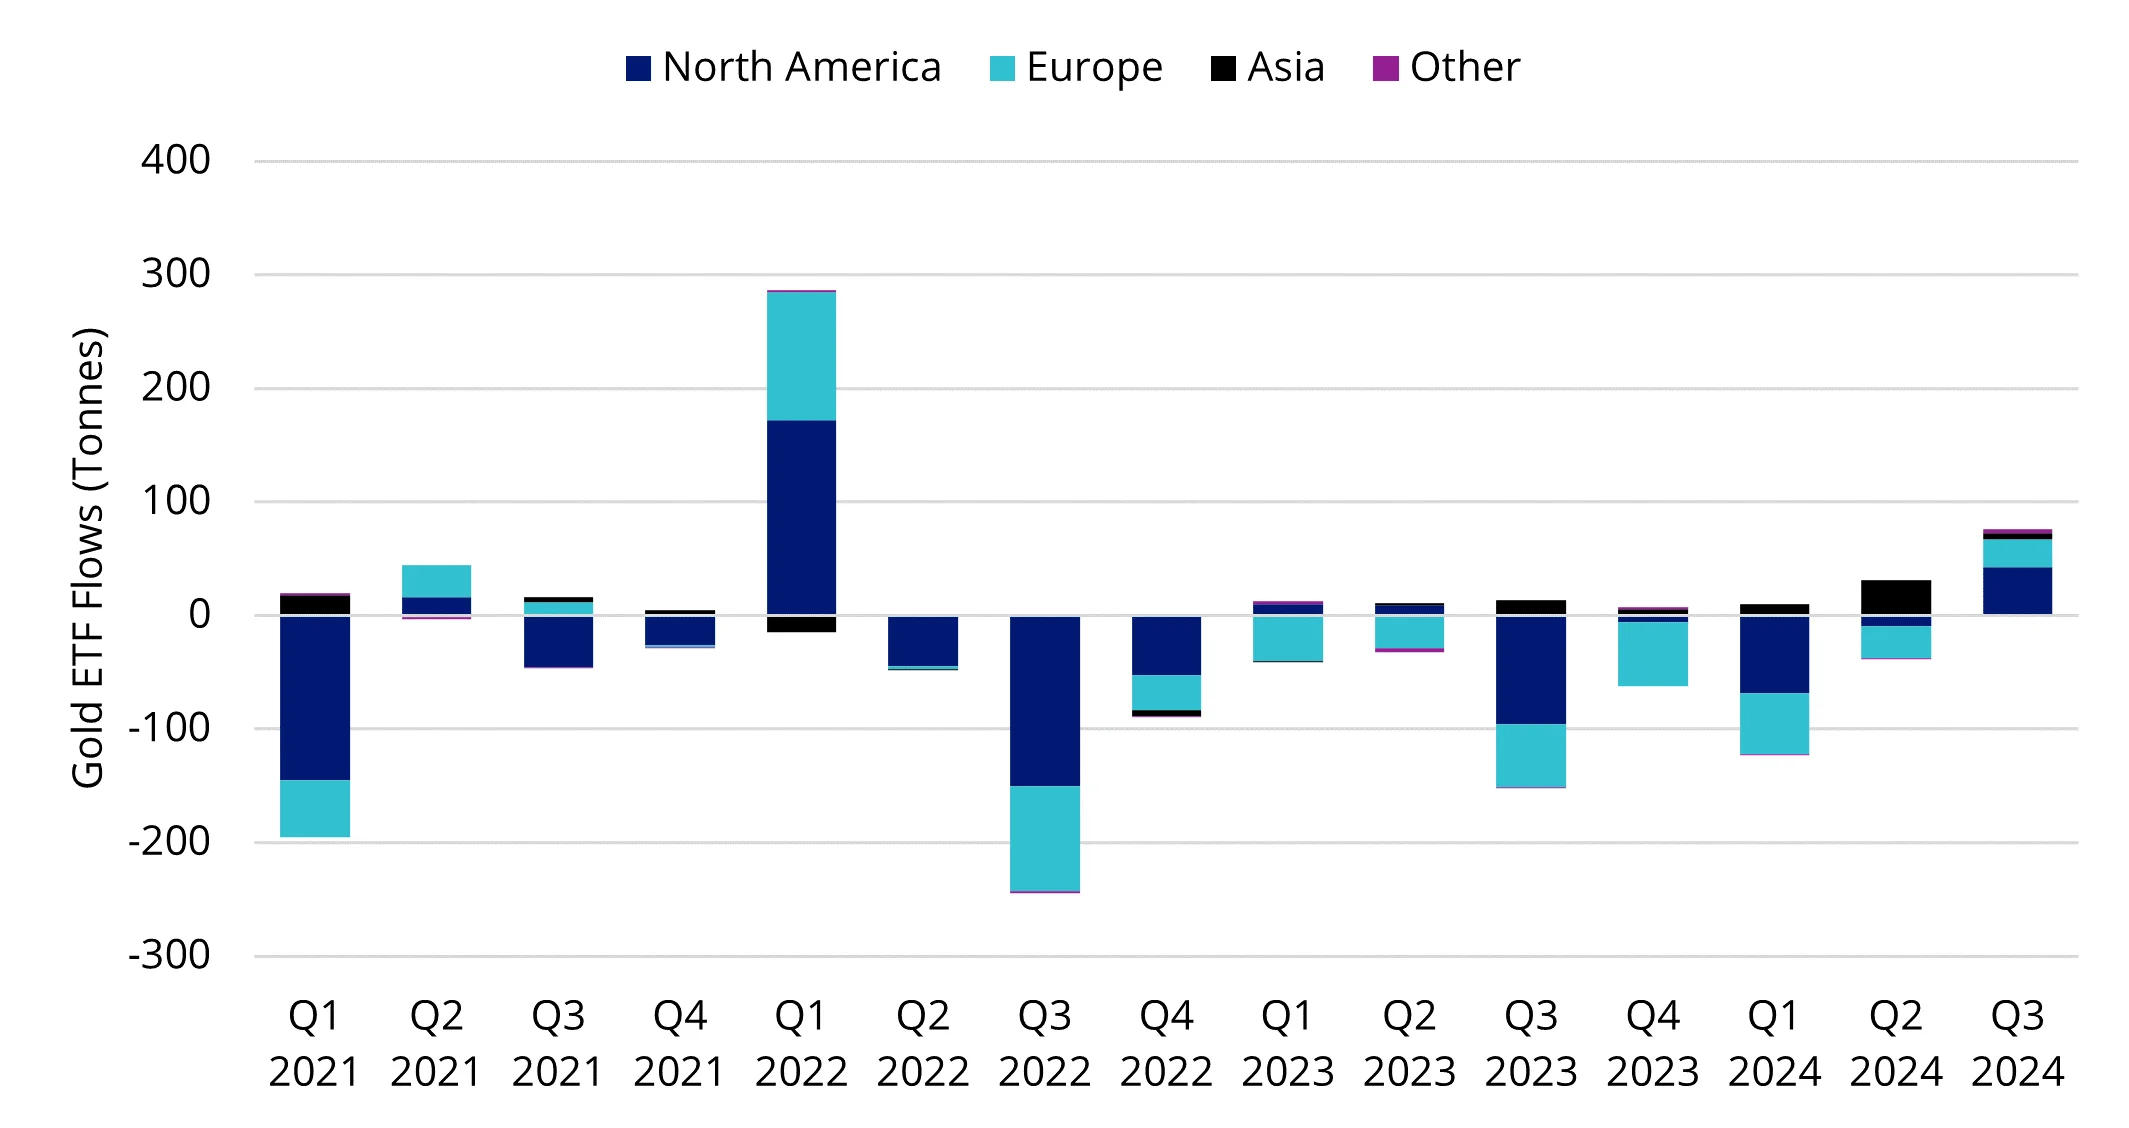
Source: World Gold Council. Data as of August 2024.


Published: 11 September 2024