Investors and central banks going for gold
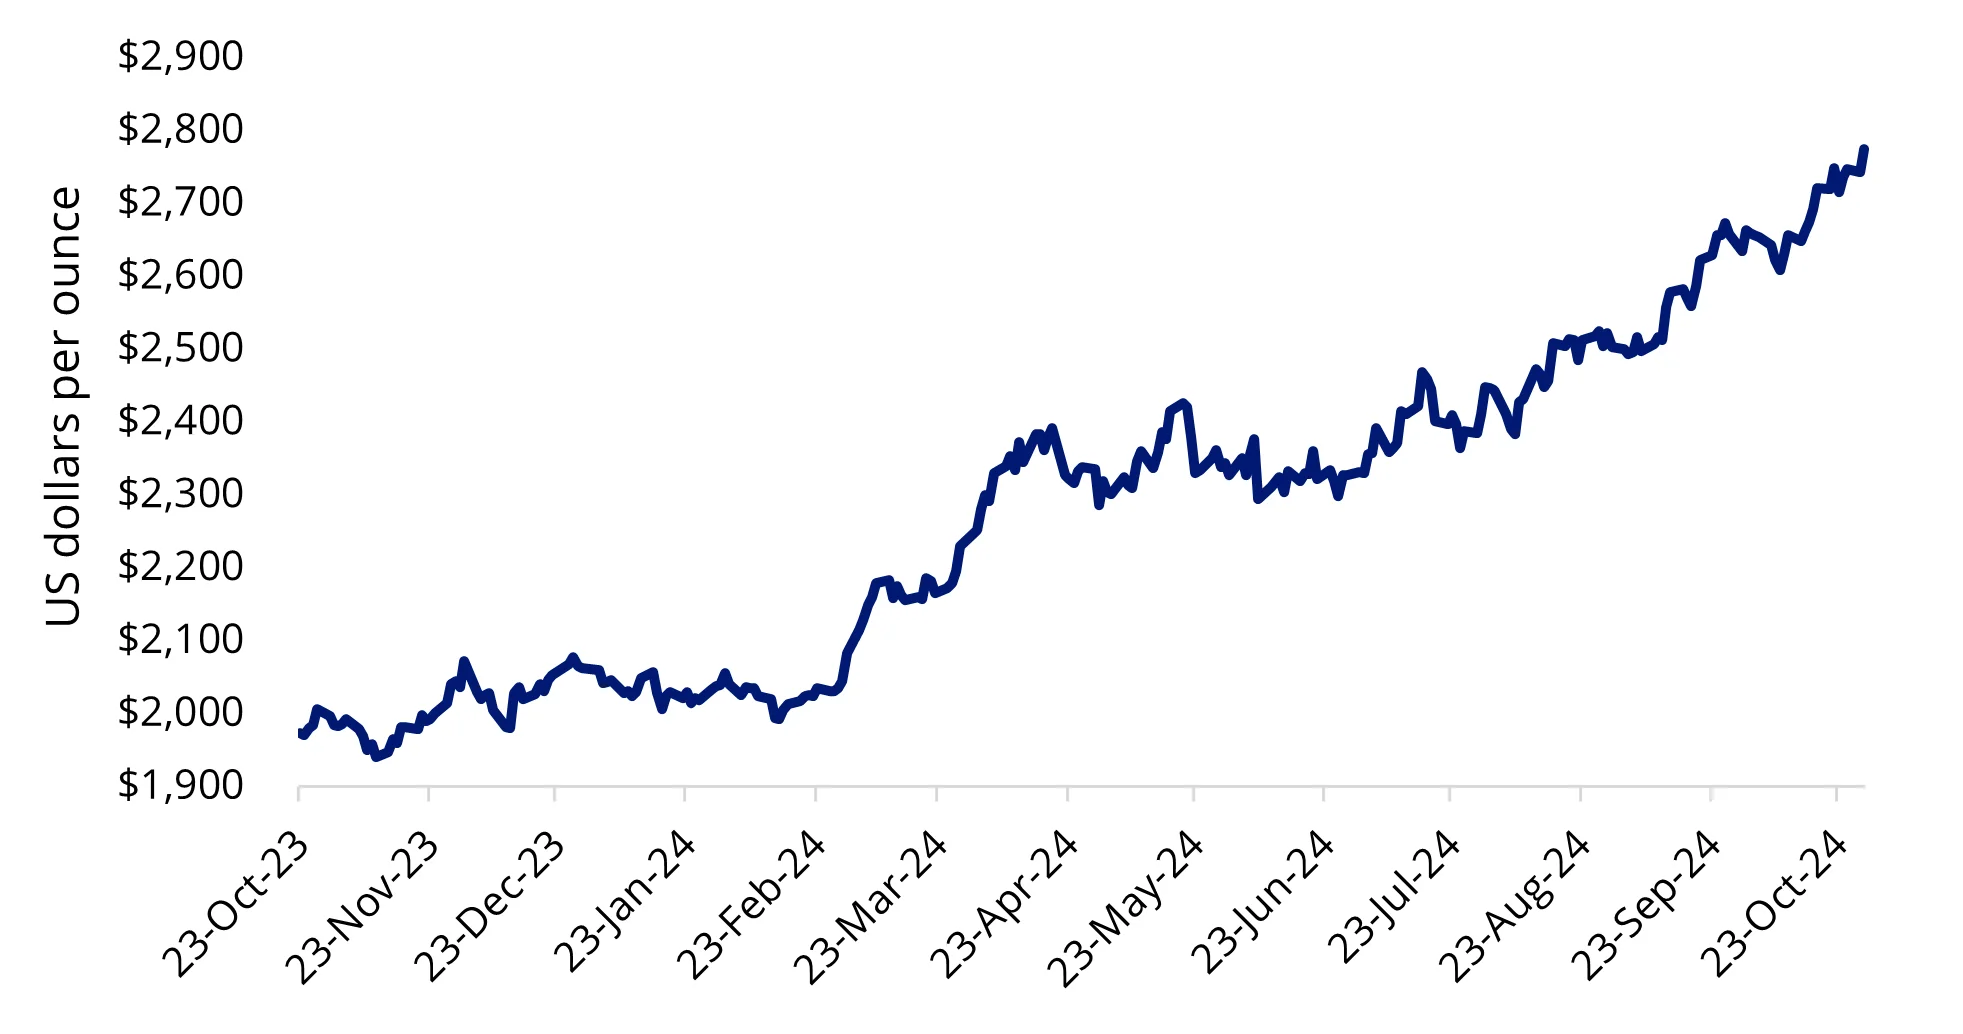
This year, gold has been one of the top-performing commodities, surging over 30%. It reached a record high on 31 October 2024 trading near US$2,790 per ounce, driven by escalating tensions in the Middle East and rising uncertainty of the US presidential race. Against these geopolitical and economic uncertainties, investors have turned to gold as a safe haven asset.
Chart 1: Gold hits record on safe haven demand
Source: Bloomberg, as of 29 October 2024. Past performance is not a reliable indicator of future results.
Factors supporting the bull run
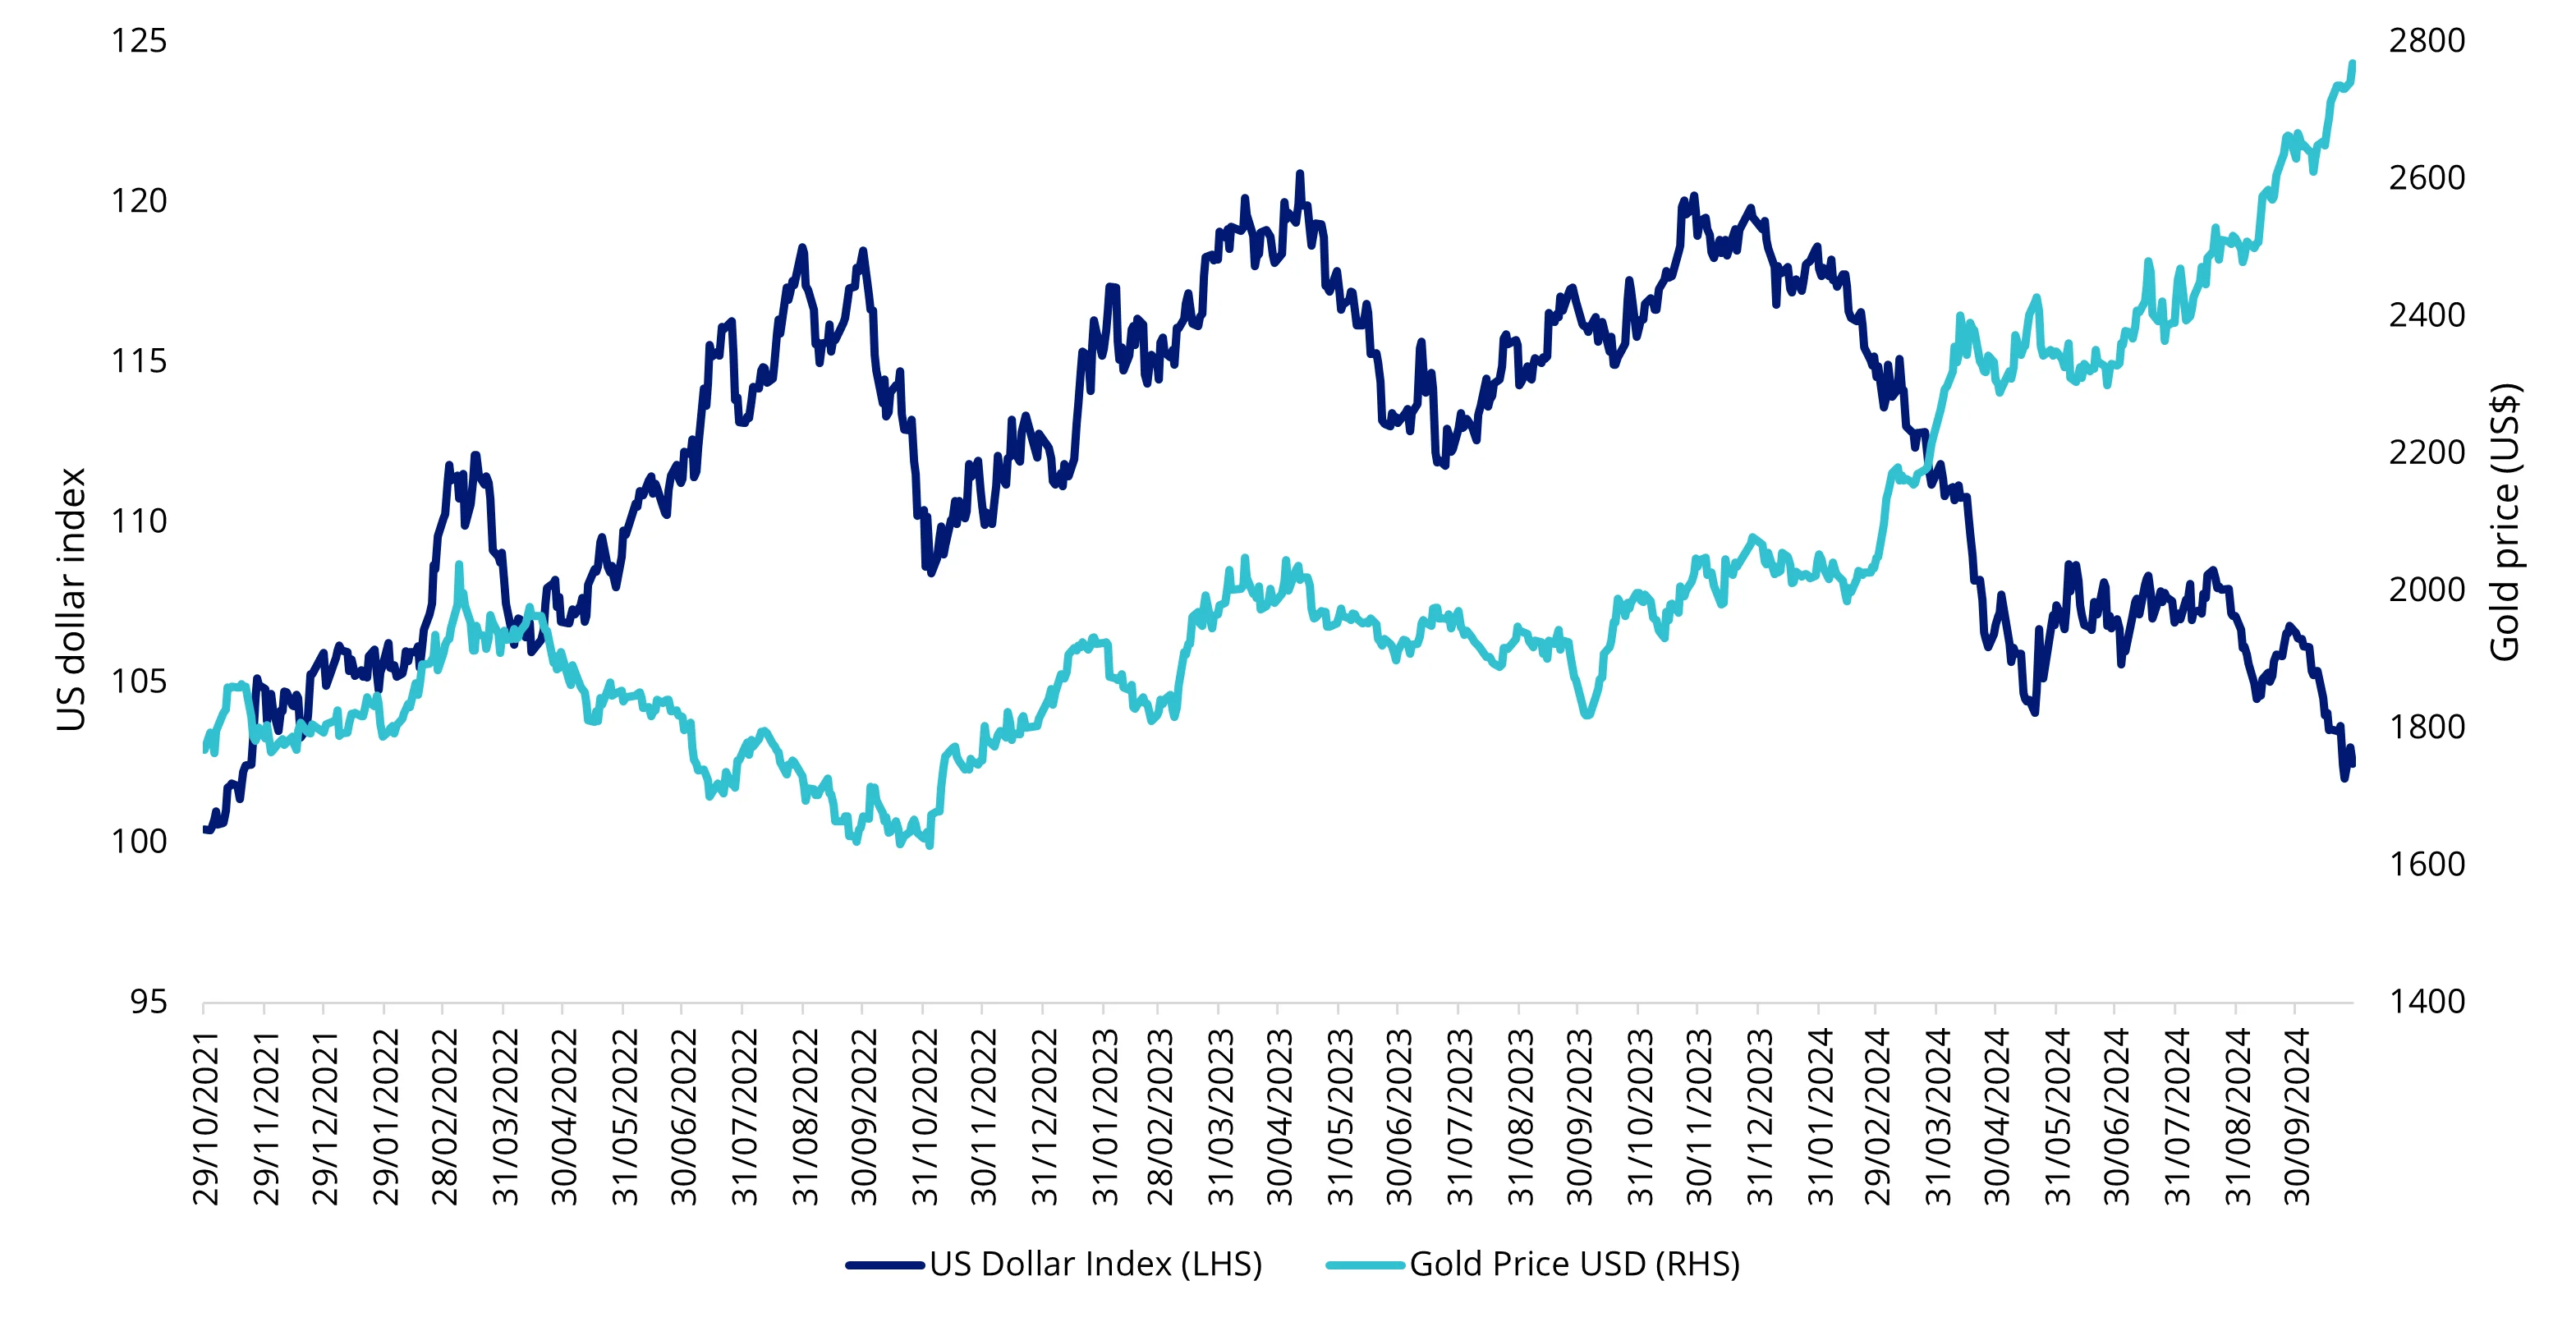
Looking ahead, analysts believe gold prices may rise beyond US$3,000 an ounce, with UBS recently saying it could reach that mark by the end of the year, largely supported by the Federal Reserve’s (Fed) anticipated rate-cutting cycle. The US dollar and gold tend to have an inverse relationship. A weaker US dollar, which typically follows lower interest rates, would make gold more affordable for purchasers holding other currencies, and vice versa.
This inverse relationship can be seen in the chart below. As the Fed began aggressively hiking rates in 2022, cash and fixed income yields became attractive. This drove demand for the currency that saw the broad US Dollar Index rally from 95 to over 110. In this environment of US dollar strength, the gold price fell to around US$1,600, only recovering when demand for US dollar receded from November 2022.
Currently, with the US dollar facing pressure, gold would appear cheaper. During periods of deterioration or rapid weakening of the US dollar, gold is often viewed as a preferred store of value.
Chart 2: Gold price and US dollar relationship
Source: VanEck, Bloomberg, as of 18 October 2024. Past performance is not a reliable indicator of future results. US Dollar Index is DXY Index.
Meanwhile, we are living in uncertain times. The world today is marked by escalating geopolitical tensions, trade disputes and financial instability. From the US-China rivalry to the wars in Ukraine and the Middle East, these uncertainties create risk and volatility in financial markets. The upcoming US presidential elections has contributed to the geopolitical uncertainty and some traders have already repositioned their portfolios ahead of the elections.
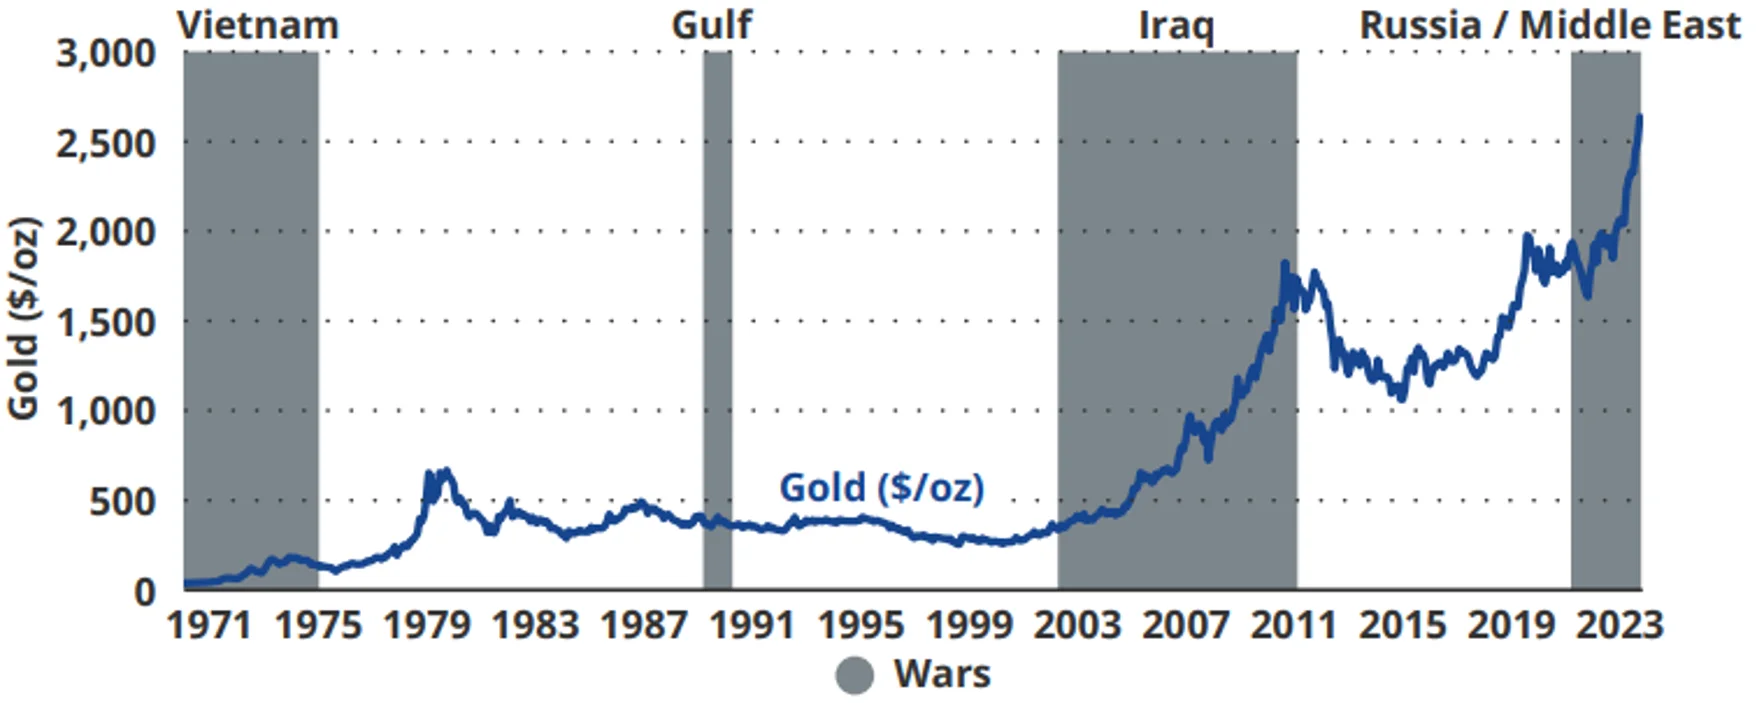
In the past, gold has performed well during times of geopolitical unrest. When tensions rise, markets become nervous, and investors look for assets that provide security. Gold, as a universally recognised store of value, benefits from these shifts in sentiment. In a fragmented and unpredictable world, gold can offer stability that few other assets can match.
Chart 3: Gold performance during periods of war
Source: VanEck, Bloomberg. Data as of August 2024. Past performance is not a reliable indicator of future results.
Lower yields have also been one of the factors boosting gold prices. Real yields are defined as the nominal interest rates adjusted for inflation. When real yields are negative, it indicates that inflation outpaces nominal interest rates. This scenario leads investors to seek alternative assets that can retain value, such as gold.
Historically, gold prices have exhibited an inverse correlation with real yields: when real yields decrease or turn negative, demand for gold tends to increase because the opportunity cost of holding non-yielding assets like gold diminishes. As inflation has surged in recent years, real yields turned negative, prompting a greater allocation of capital towards gold as a hedge against inflation and economic uncertainty.
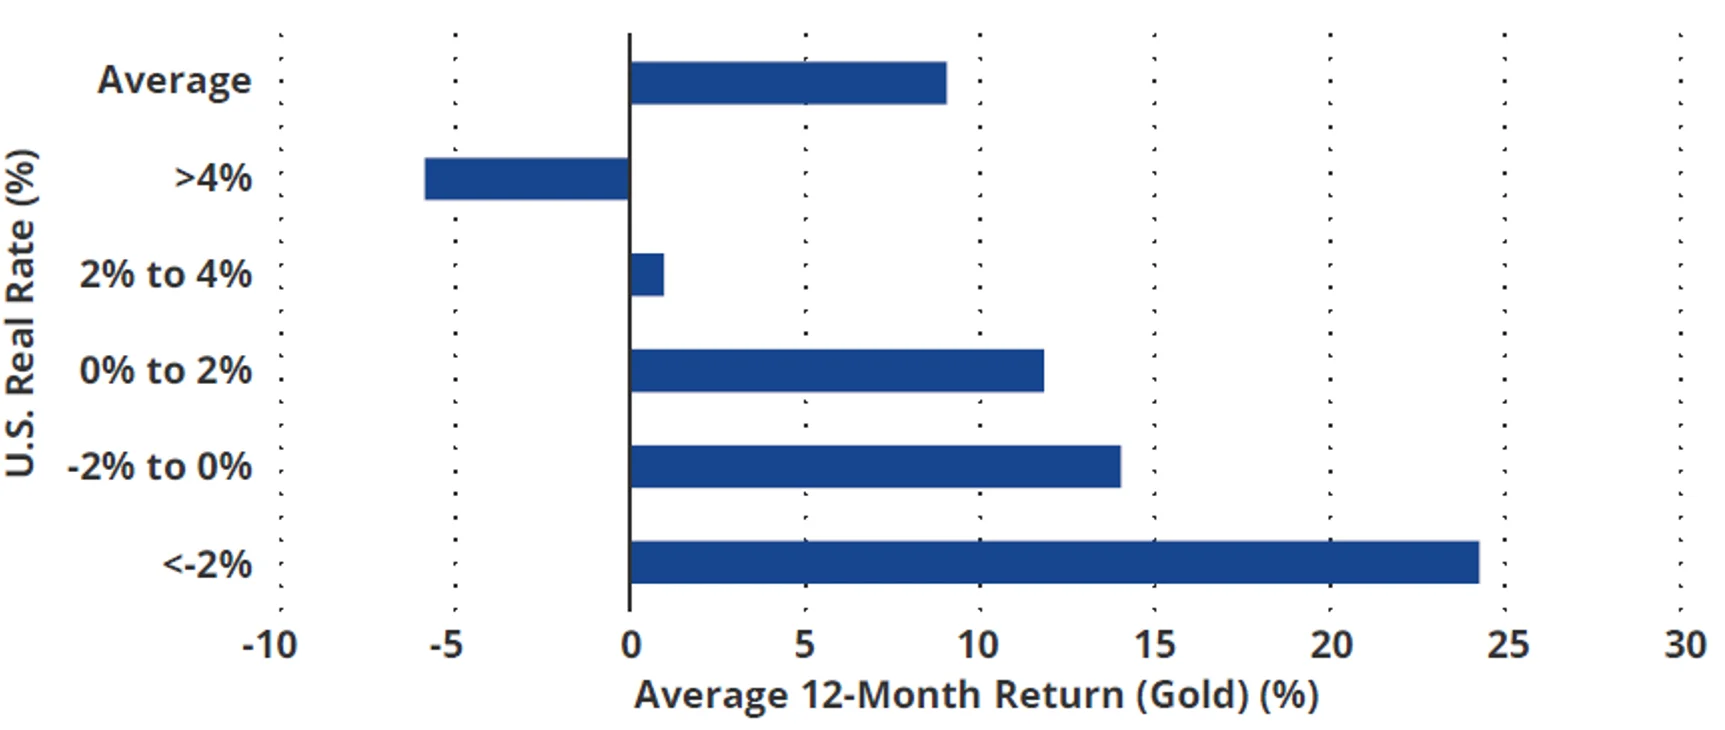
We expect gold to continue rising as real yields fall. The chart below demonstrates the outperformance of gold during periods of low and negative real interest rates.
Chart 4: Average gold performance in varying real rate environments
Source: VanEck, Bloomberg. Data as of August 2024. Past performance is not a reliable indicator of future results.
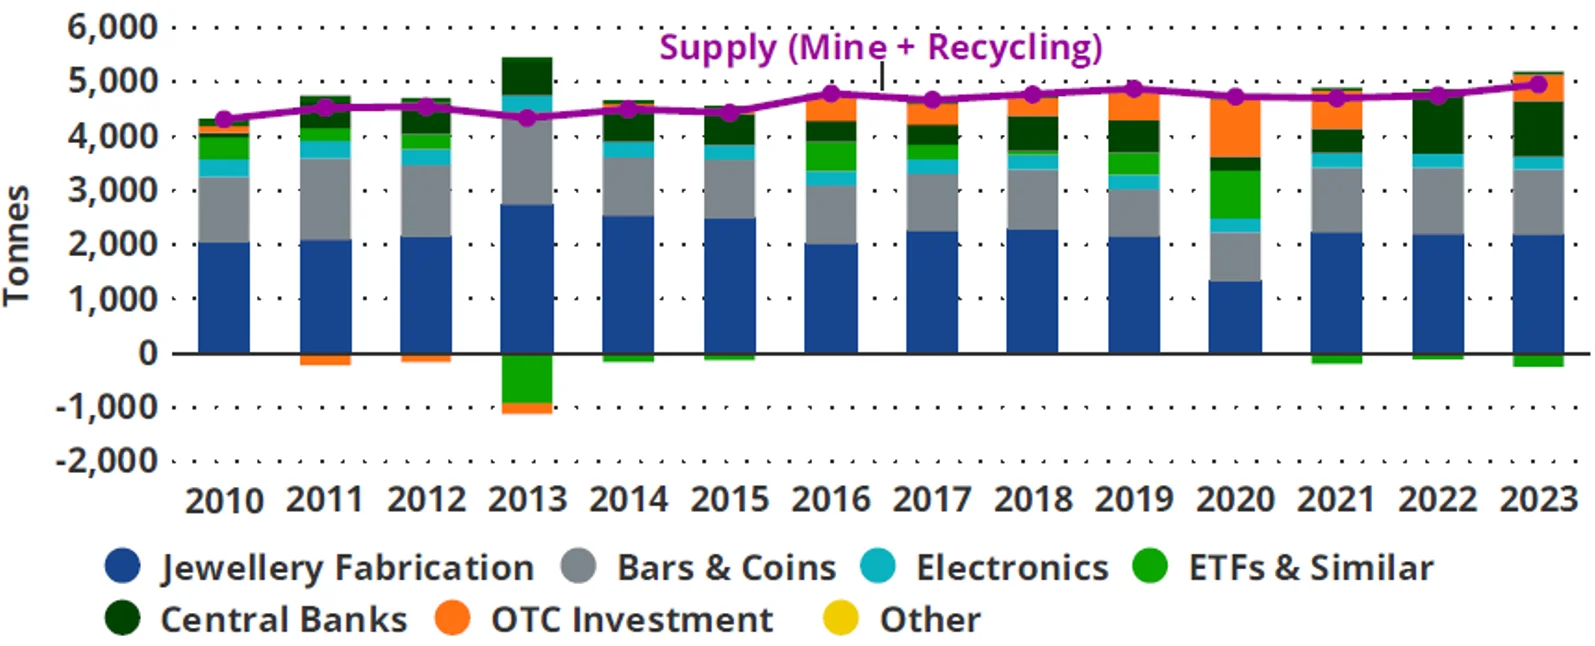
Structural demand from central banks and investors has been strong. This has been one of the factors contributing to this year’s gold rally. The chart below represents the supply/demand breakdown of the major participants in the gold market.
Chart 5: Global gold supply/demand breakdown
Source: VanEck, World Gold Council. Data as of September 2024.
Central banks around the world have been increasing their gold reserves. They are one of the largest holders of gold, accounting for around a fifth of all the gold that has been mined throughout history. This trend is expected to continue, driven by a desire to diversify foreign exchange reserves and hedge against geopolitical risks, thereby supporting gold prices further. At the same time, increasing wealth in countries like China and India is driving higher demand for gold, particularly for jewellery and investment purposes. This sustained demand is likely to keep prices buoyant.
Finally, what has been absent from this recent gold rally, that has been evident in previous gold bull markets, has been ETF demand. For as long as there have been gold bullion ETFs, there has been an almost perfect correlation between gold bullion ETF holdings and the gold price. The gold price rose, as demand for gold-backed ETFs went up, and vice versa.
That was up until 2022. Since then, up until the middle of this year, investor demand for gold bullion ETFs had been on the decline. That seems to be reversing. The AFR reported last week that “Globally, gold ETFs added 95 tonnes of bullion, fuelled by a pick-up in demand from Western investors, marking the first positive quarter since the first three months of 2022.”
This demand could further support the rally in the gold price. In our view, we remain confident that investors will continue to buy gold because it is outperforming. That demand will drive the next leg of this bull market.
Exposure to gold miners
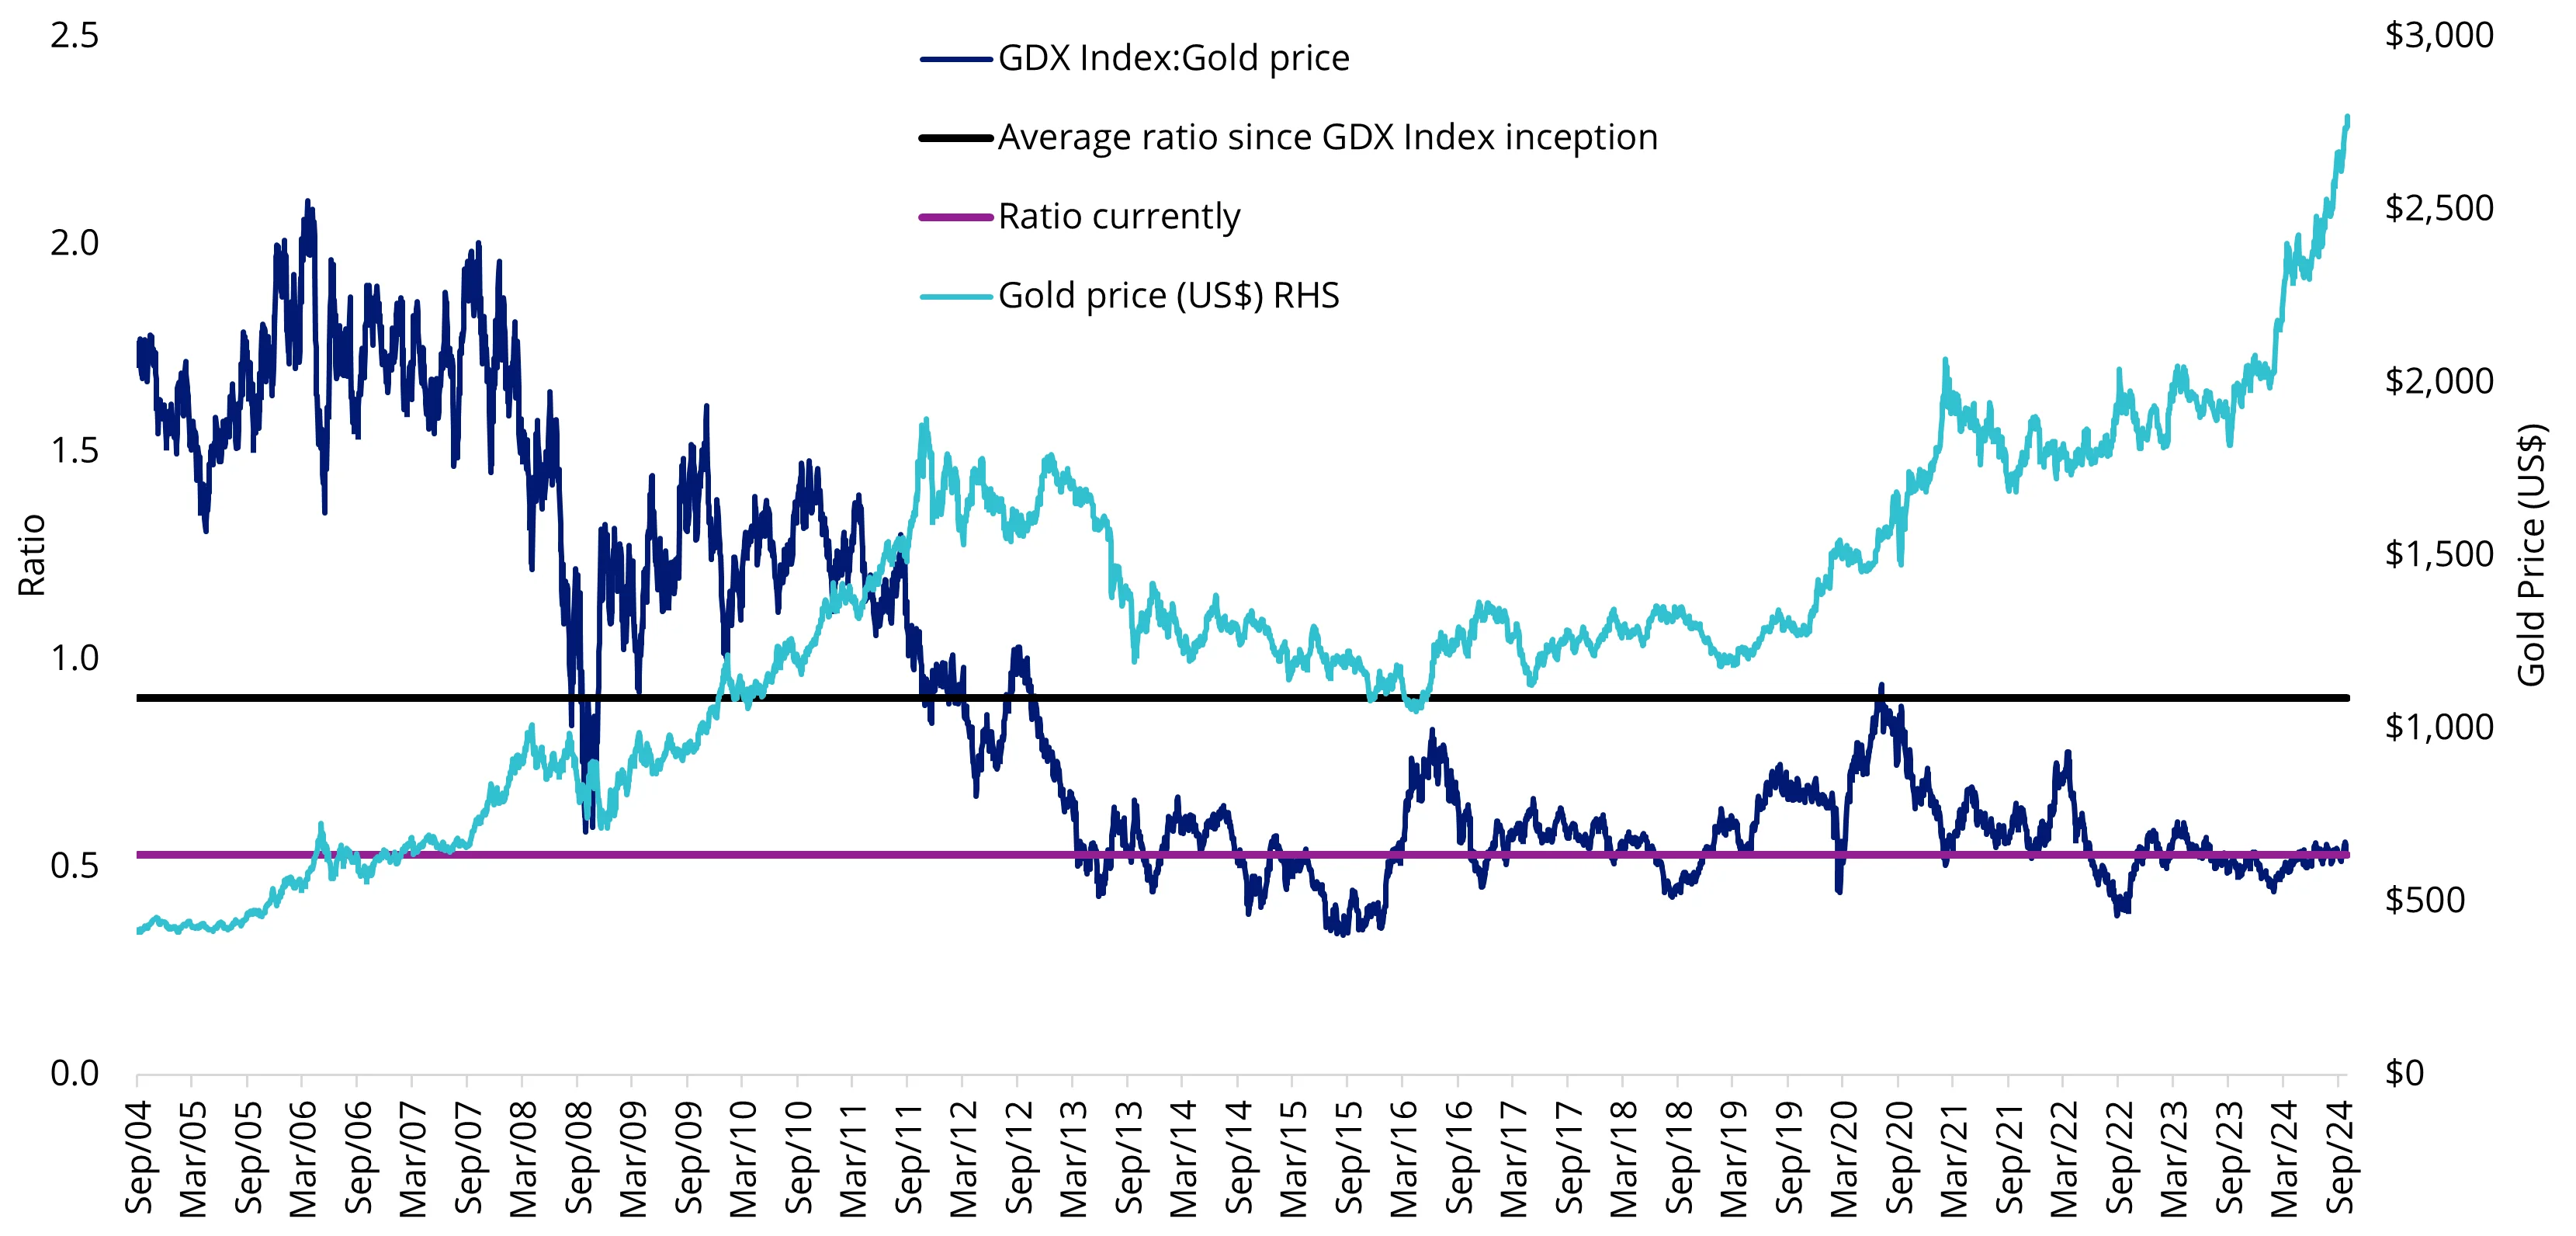
Apart from gold bullion, gold miners provide leveraged exposure to the metal. Currently, the gold mining sector benefits from robust cash flow generation and disciplined capital allocation strategies. Despite this, the sector remains undervalued compared to historical averages. This divergence is highlighted in Chart 6, which compares the value of gold mining equities, represented by NYSE Arca Gold Miners Index (GDX Index), to the gold price.
Chart 6: Gold companies are relatively cheap at current levels
Source: Bloomberg, VanEck, as of 29 October 2024. All figures in US dollars. GDX Index Inception is 29 September 2004. GDX Index is the NYSE Arca Gold Miners Index. You cannot invest directly in an index. Past performance is not a reliable indicator of future performance. Index performance is not illustrative of fund performance.
Accessing gold with the specialists
VanEck’s global leadership in gold investing stretches more than 50 years, encompassing gold equities and bullion across ETFs and active funds. Two ETFs for portfolio considerations:
- NUGG – accessing physical gold, that ‘delivers’
- GDX – investing in a diversified portfolio of gold mining companies
Key risks of NUGG and GDX:
An investment in NUGG or GDX carries investment risk. These risks vary depending on the fund and may include gold pricing risk, currency risk, custody risk, Australian sourced gold bullion risk, ASX trading time differences, financial markets generally, individual company management, industry sectors, country or sector concentration, political, regulatory and tax risks, fund operations and tracking an index. See the PDSs for details on risks.
Published: 04 November 2024
Any views expressed are opinions of the author at the time of writing and is not a recommendation to act.
VanEck Investments Limited (ACN 146 596 116 AFSL 416755) (VanEck) is the issuer and responsible entity of all VanEck exchange traded funds (Funds) trading on the ASX. This information is general in nature and not personal advice, it does not take into account any person’s financial objectives, situation or needs. The product disclosure statement (PDS) and the target market determination (TMD) for all Funds are available at vaneck.com.au. You should consider whether or not any Fund is appropriate for you. Investments in a Fund involve risks associated with financial markets. These risks vary depending on a Fund’s investment objective. Refer to the applicable PDS and TMD for more details on risks. Investment returns and capital are not guaranteed.


