Market chaos ignites gold’s surge– are you in?
Got gold?
If the answer is yes, you are one of the lucky winners so far in 2025. If the answer is no, take January as another great example of why you should want some gold exposure in your portfolio. A perfect storm of events—DeepSeek’s release, a tech stock sell-off, an unpredictable US administration issuing a wave of executive orders, escalating tariffs and trade tensions and rising inflation concerns—shook global financial markets.
Historically, gold has served as the ultimate safe haven, as a hedge against market uncertainty and volatility, geopolitical risk and inflation, and as a place to hide when there is a heightened level of risk and fear. Yet, investor sentiment toward gold has been weak for many years. However, in January, the market's focus shifted to many of the risks that have long supported gold. Defending its status as the ultimate market hedge and as an effective diversifier, gold performed exactly as history would predict—surging to a new all-time high of US$2,798.41 per ounce on 31 January, marking a monthly gain of US$173.91 per ounce, or 6.63%.
Gold rush 2.0: Western investors fuel the comeback
Gold has had an impressive start to the year, potentially signaling the long-awaited return of Western investors. As the urgency to diversify portfolios grows, interest in gold is accelerating, evidenced by a 0.70% increase in gold bullion-backed ETF holdings. Gold is making its way west—to New York, to be exact. Trump’s tariff threats have ignited a physical gold rush, with investors and traders scrambling to secure bullion before potential price hikes. This has disrupted markets, widened price spreads between London and New York and drained London’s reserves, further tightening supply.
Typically, gold trades in contango (i.e., longer-dated futures contracts are priced higher than near-term contracts or the current spot price). However, it is now experiencing instances of backwardation, where the spot price exceeds futures prices. Gold’s 1-month lease rates jumped to as high as 4% recently, reflecting the crunch. Not bad for a non-yielding asset.
The power players behind gold’s record-breaking surge
While market tightness puts upward pressure on gold prices, the real drivers of its strength are central banks and investors. The World Gold Council 2024 Gold Demand Trends report estimates total gold demand reached record levels last year, both in tonnage (4,974 tonnes) and US dollar value (US$382 billion).
For the third consecutive year, central banks were net purchasers of more than 1,000 tonnes of gold— more than twice their average annual purchases from 2010 to 2021. By the end of Q3 2024, they had added 712 tonnes, leading many to believe they would fall short of the 1,000-tonne mark. However, they picked up the pace in Q4, purchasing 333 tonnes, finishing just 6 tonnes below the 2023 total. This sustained central bank buying remains a strong pillar of demand, with the trend expected to continue in the long term.
Investment demand rose 25%, but this increase was the result of a slowdown in ETF outflows rather than fresh inflows. While India and China saw significant increases in physical gold demand, global bar and coin demand remained flat year-over-year. In other words, investment demand increased because outflows from the gold bullion backed ETFs slowed down significantly (-6.8 tonnes in 2024 vs -244.2 tonnes in 2023), rather than due to increased buying. A slowdown of outflows in 2024, followed by inflows into the global gold bullion ETFs in early 2025, could signal renewed Western investor interest in gold and potential for higher prices ahead.
Chart 1: 2024 gold demand trends
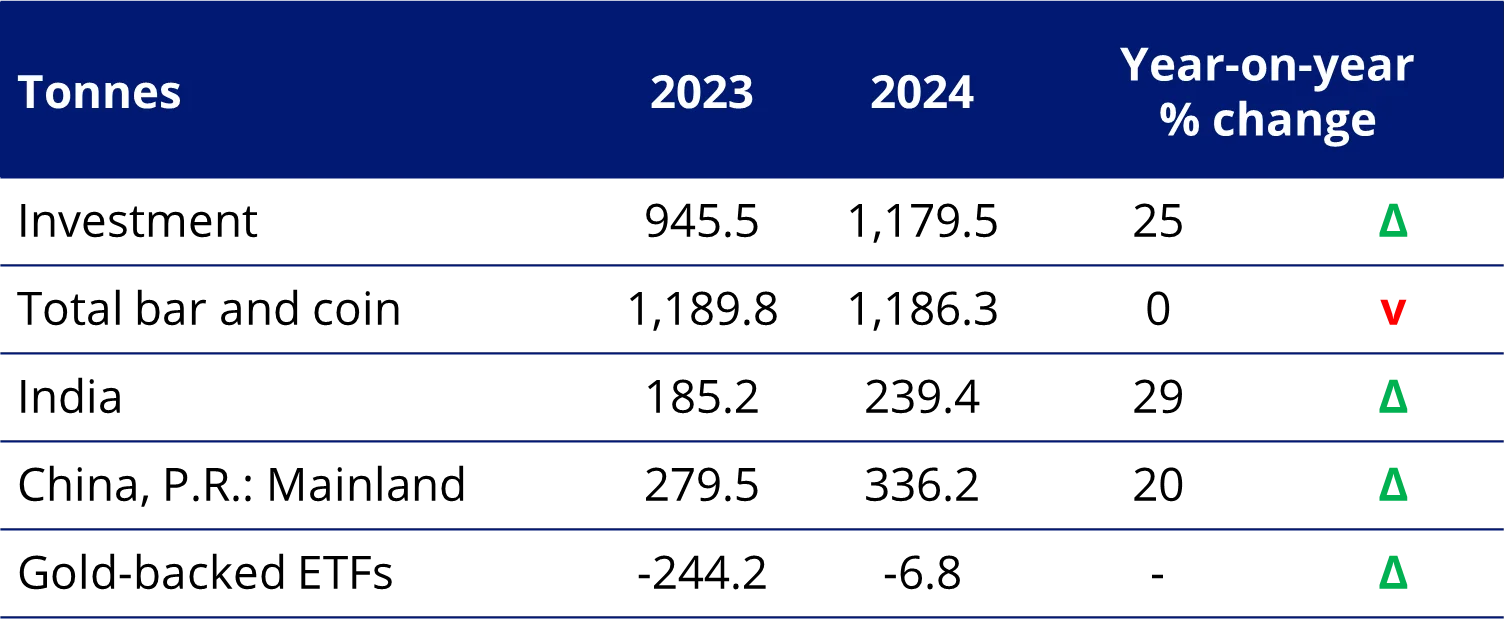
Source: Metals Focus, Refinitiv GFMS, ICE Benchmark Administration, World Gold Council. https://www.gold.org/goldhub/research/gold-demand-trends/gold-demand-trends-full-year-2024
Gold miners shine: a breakout start to 2025
Exciting gold news in January was the strong performance of gold equities. As investor interest in gold grows, gold miners are starting to deliver the expected outperformance relative to the metal. The NYSE Arca Gold Miners Index (AUD) rose 14.07%.
Earnings season for the sector kicks off in mid-February. This is a crucial reporting period, as companies will release full-year 2024 results and provide 2025 guidance. Markets will focus on operating cost guidance, assessing margin expansion and free cash flow generation. Companies that meet or exceed 2024 targets and 2025 expectations may be rewarded, while those that miss could see their share prices decline.
Project updates will also be key, with investors closely watching timelines for permitting and production, as well as any capital cost revisions. Additionally, announcements on dividends and share buyback programs will be in focus.
For gold equities to be revalued from their historically low levels, high gold prices and renewed investor interest must be supported by strong performance from gold miners. The low correlation of gold and gold equities with most asset classes also enhances their diversification benefits, making them an attractive option for investors today.
Chart 2: Asset Class Correlations
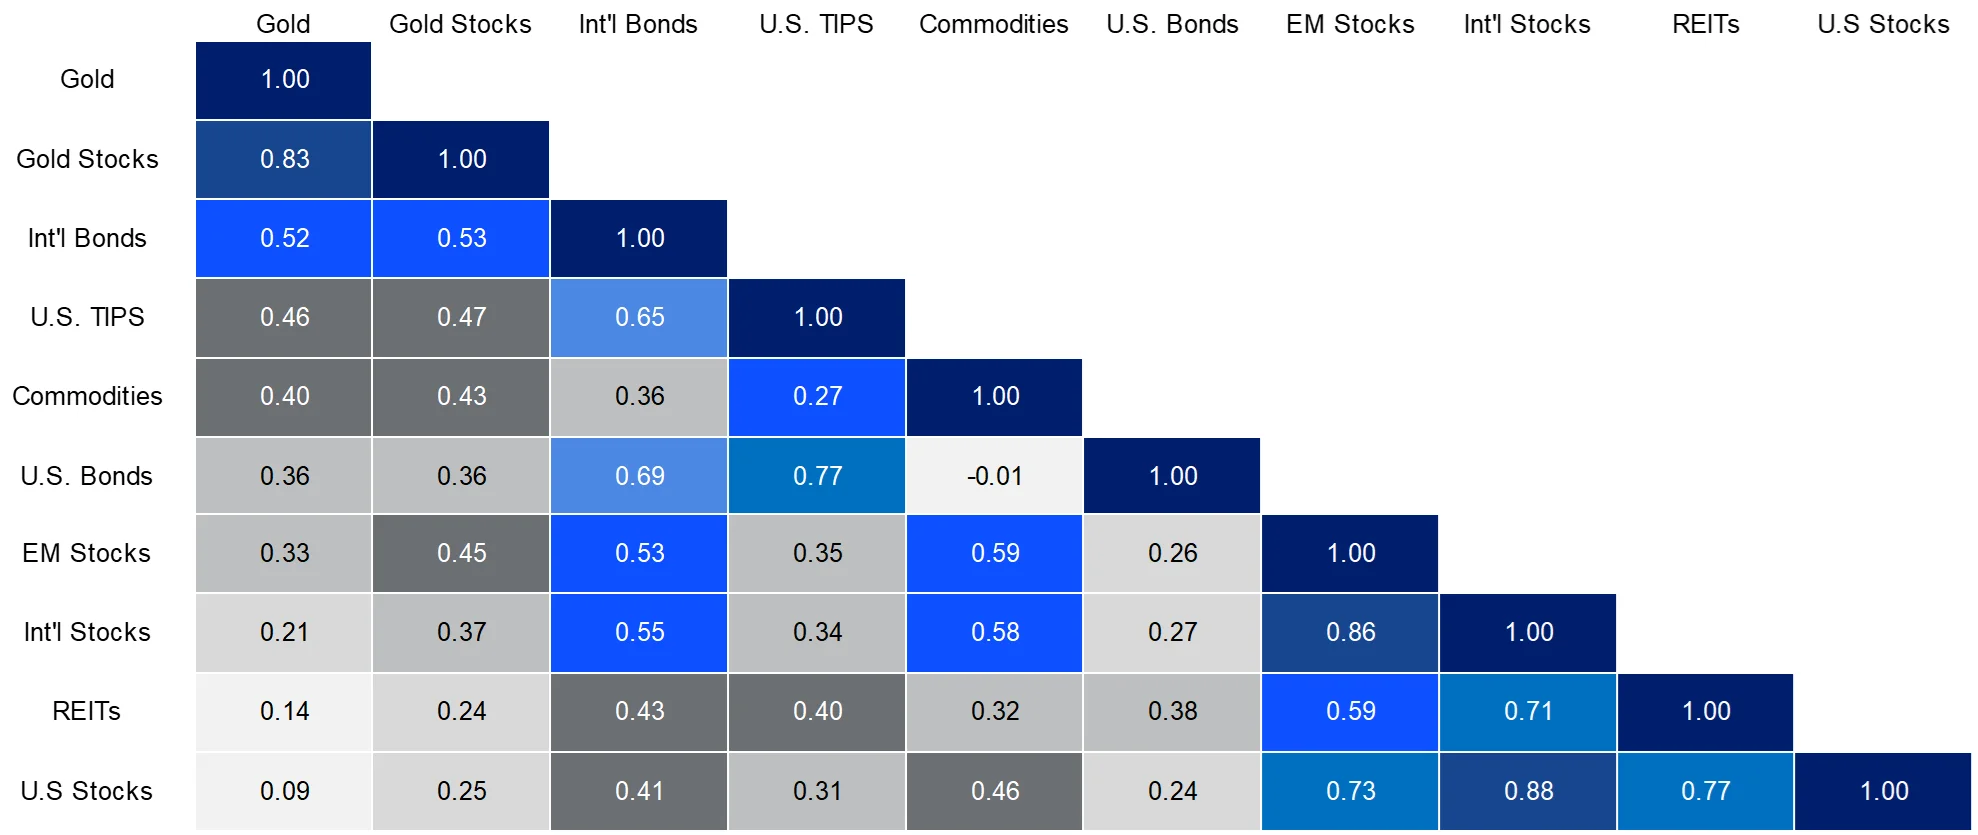
Source: FactSet, VanEck. Data as of 31 December, 2024. “Gold Stocks” represented by NYSE Arca Gold Miners Index. “International (Int’l) Bonds” represented by Bloomberg Global Aggregate ex US Index. “US TIPS” represented by Bloomberg US Treasury Inflation Protected Notes (TIPS) Index. “Commodities” represented by Bloomberg Commodity Index. “US Bonds” represented by Bloomberg US Aggregate Bond Index. “Emerging Markets (EM) Stocks” represented by MSCI Emerging Markets Index. “International (Int’l) Stocks” represented by MSCI World ex USA Index. “REITs” represented by FTSE NAREIT All Equity REITs Index. “US Stocks” represented by the S&P 500 Index. Past performance is not indicative of future results. Index descriptions included at the end of this presentation.
Key risks
An investment in NUGG or GDX carries investment risk. These risks vary depending on the fund and may include gold pricing risk, currency risk, custody risk, Australian sourced gold bullion risk, ASX trading time differences, financial markets generally, individual company management, industry sectors, country or sector concentration, political, regulatory and tax risks, fund operations and tracking an index. See the PDSs for details on risks.


Published: 13 February 2025
Any views expressed are opinions of the author at the time of writing and is not a recommendation to act.
VanEck Investments Limited (ACN 146 596 116 AFSL 416755) (VanEck) is the issuer and responsible entity of all VanEck exchange traded funds (Funds) trading on the ASX. This information is general in nature and not personal advice, it does not take into account any person’s financial objectives, situation or needs. The product disclosure statement (PDS) and the target market determination (TMD) for all Funds are available at vaneck.com.au. You should consider whether or not an investment in any Fund is appropriate for you. Investments in a Fund involve risks associated with financial markets. These risks vary depending on a Fund’s investment objective. Refer to the applicable PDS and TMD for more details on risks. Investment returns and capital are not guaranteed.