Gold in times of turmoil: The impact of tariffs and uncertainty
US tariffs are on track to reach peak levels in nearly a century. In an environment where volatility is the only certainty, gold and gold miners can add a shine.
The 2ndof April (3rd in Australia) marked the darkest turn yet in the new chapter of global protectionism. If all newly announced tariffs are fully implemented - after Trump’s 90-day window given to all countries but China - the average US tariff rate will reach well above 20%, a level not seen in almost a century, not seen since the Smoot-Hawley era.
Chart 1: US average tariff rate rose to the highest level in the past century
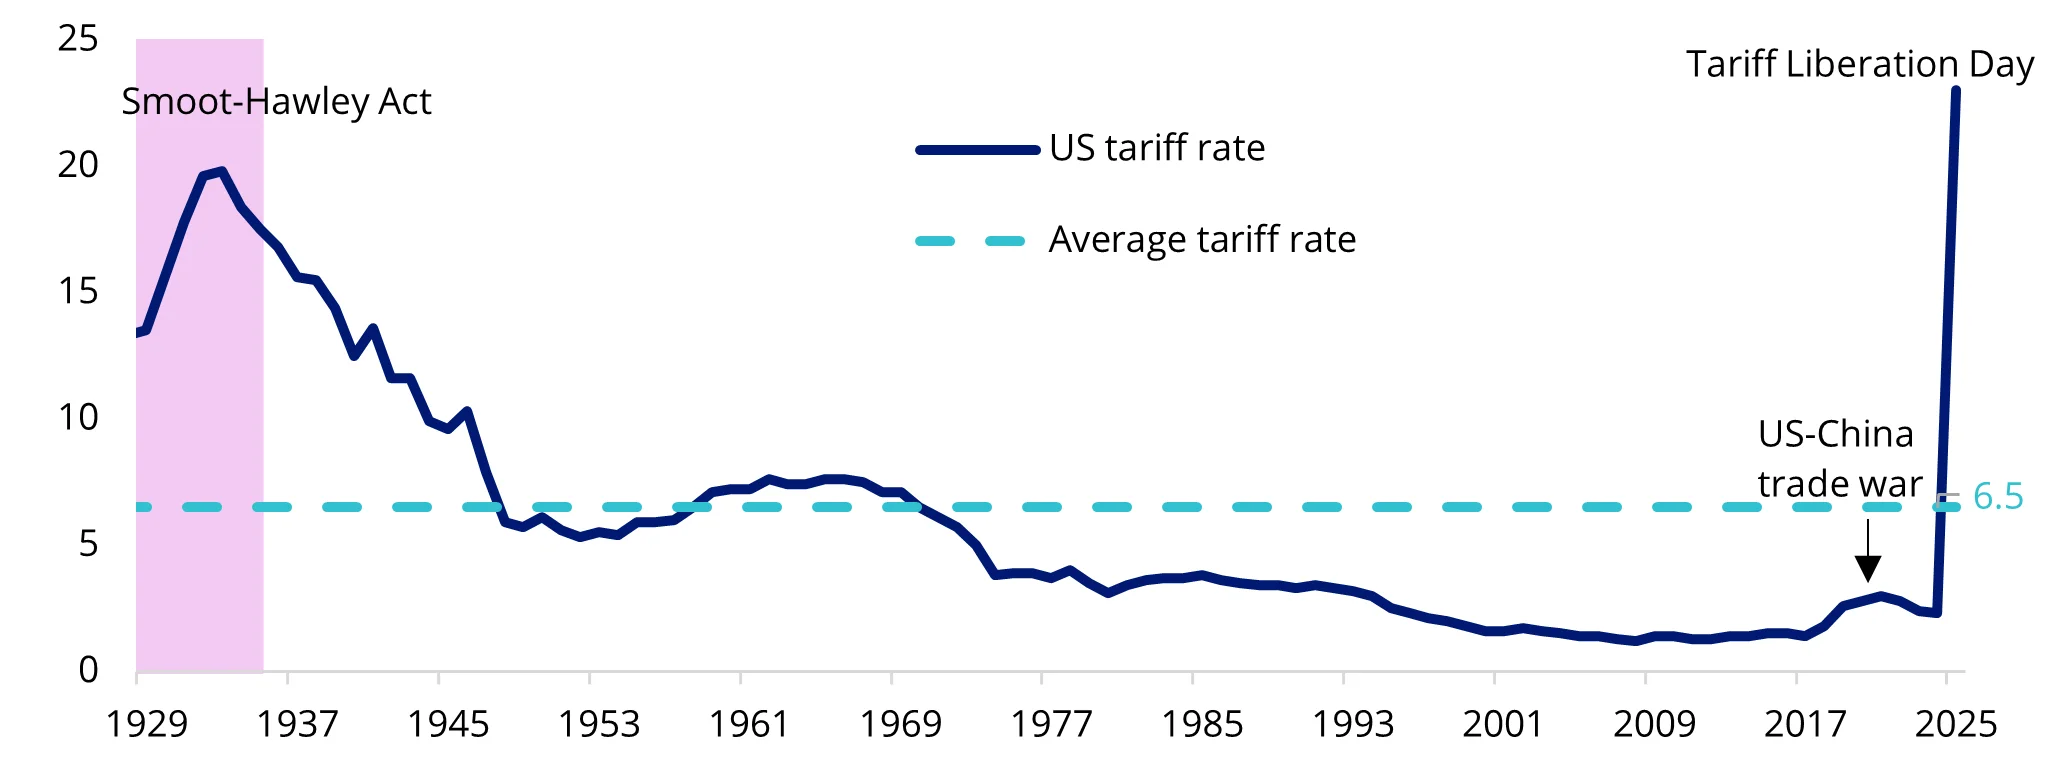
Source: VanEck. Bloomberg. Performance in AUD.
On a regional level, Asia and Europe were hit the hardest. Average tariff rates reached 32.7% for Asia (excluding the additional 70% on China announced on 9 April), 31.8% for non-EU Europe, and 20% for the EU. Trump’s tariff policy targets global manufacturing hubs, with extreme levies applied to Vietnam (46%), Thailand (36%), Bangladesh (37%) and Cambodia (49%). This highlights a trade strategy aimed at maximising tariff revenue in the immediate term, before the completion of manufacturing reshoring. Meanwhile, the 25% tariff on imported automobiles is positioned to disrupt the global automobile supply chain, adding significant pressure on the nation’s traditional allies like Japan, South Korea and Mexico.
Chart 2: Average US retaliatory tariff rates by region
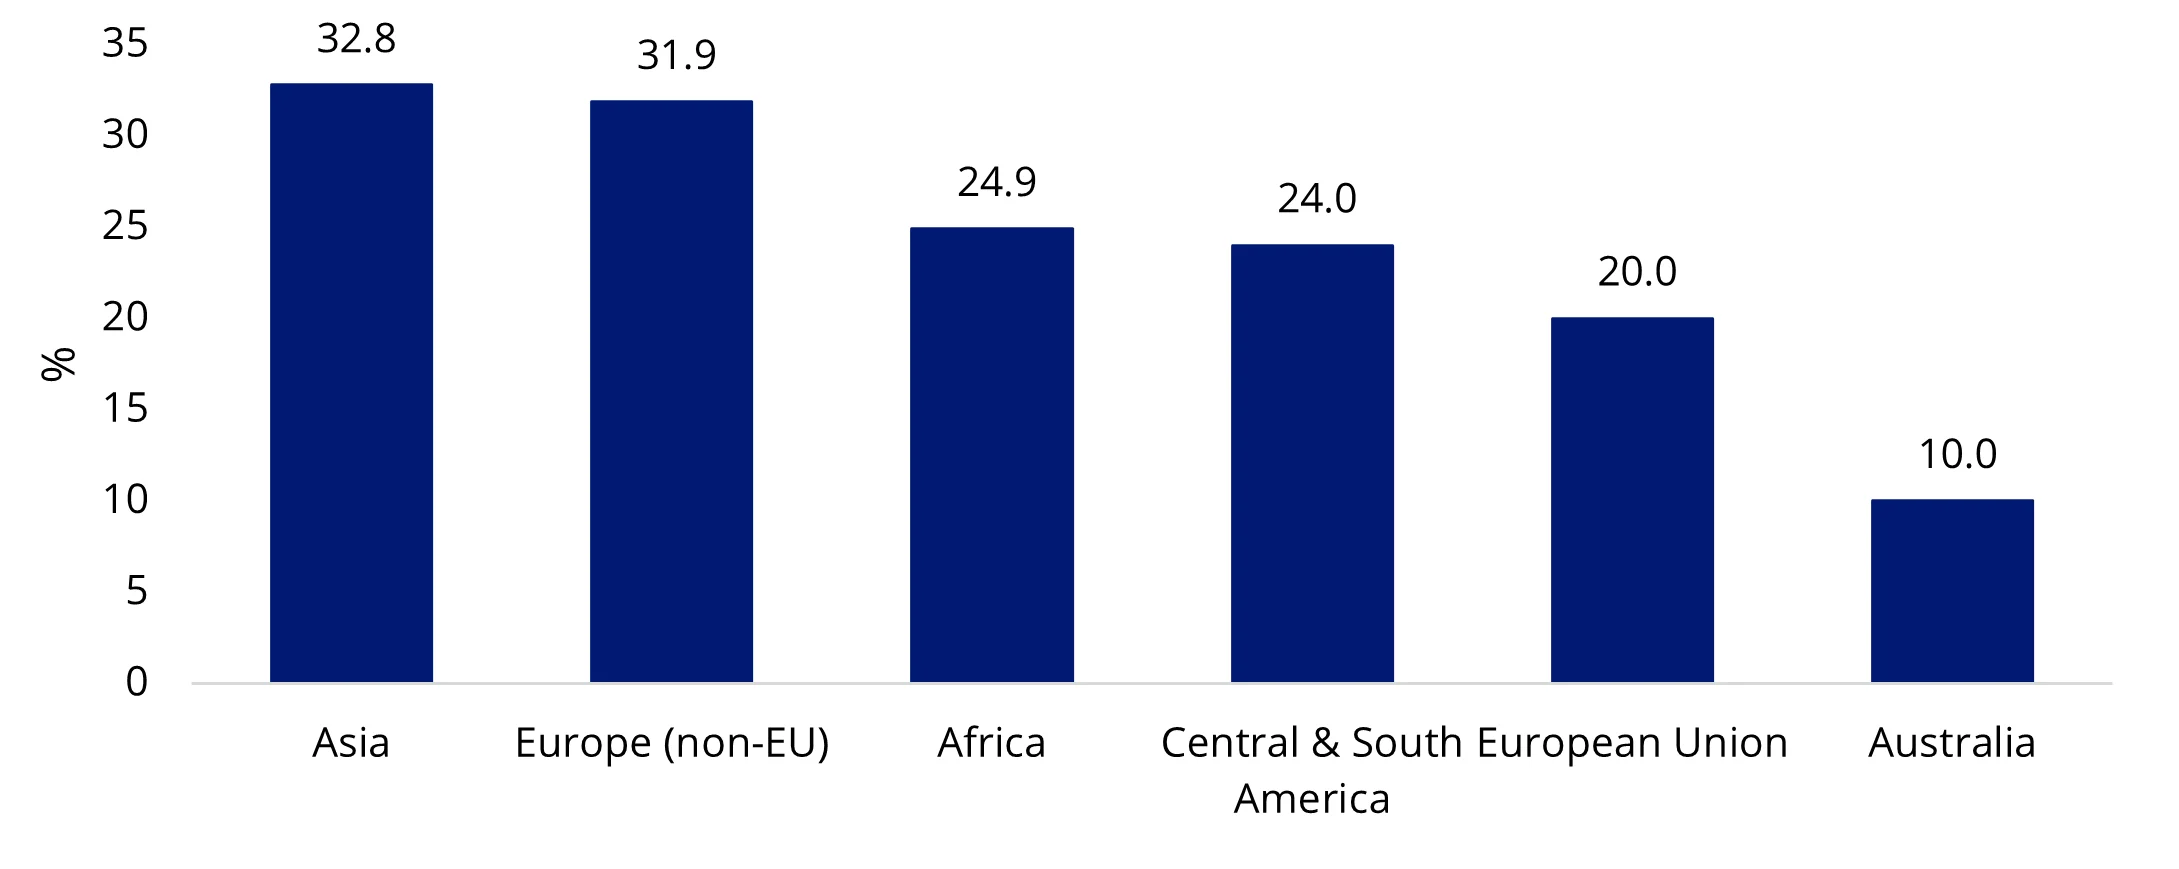
Source: VanEck. The White House. 3 April 2025.
While criticism mounts over the questionable tariff calculation methodology, markets must digest the reality that US tariff policy is not about fairness, but about regaining control over trade economics. To achieve this autonomy, the US appears willing to risk global retaliations, and with it, a spike in market volatility. Against a backdrop of surging bond and equity volatilities, the cross-asset sell-off that followed the Tariff Liberation Day should not come as a shock. Furthermore, as the US-China trade war 2.0 unfolds, markets should brace for amplified volatilities in the near term.
Chart 3: Market volatilities could increase further
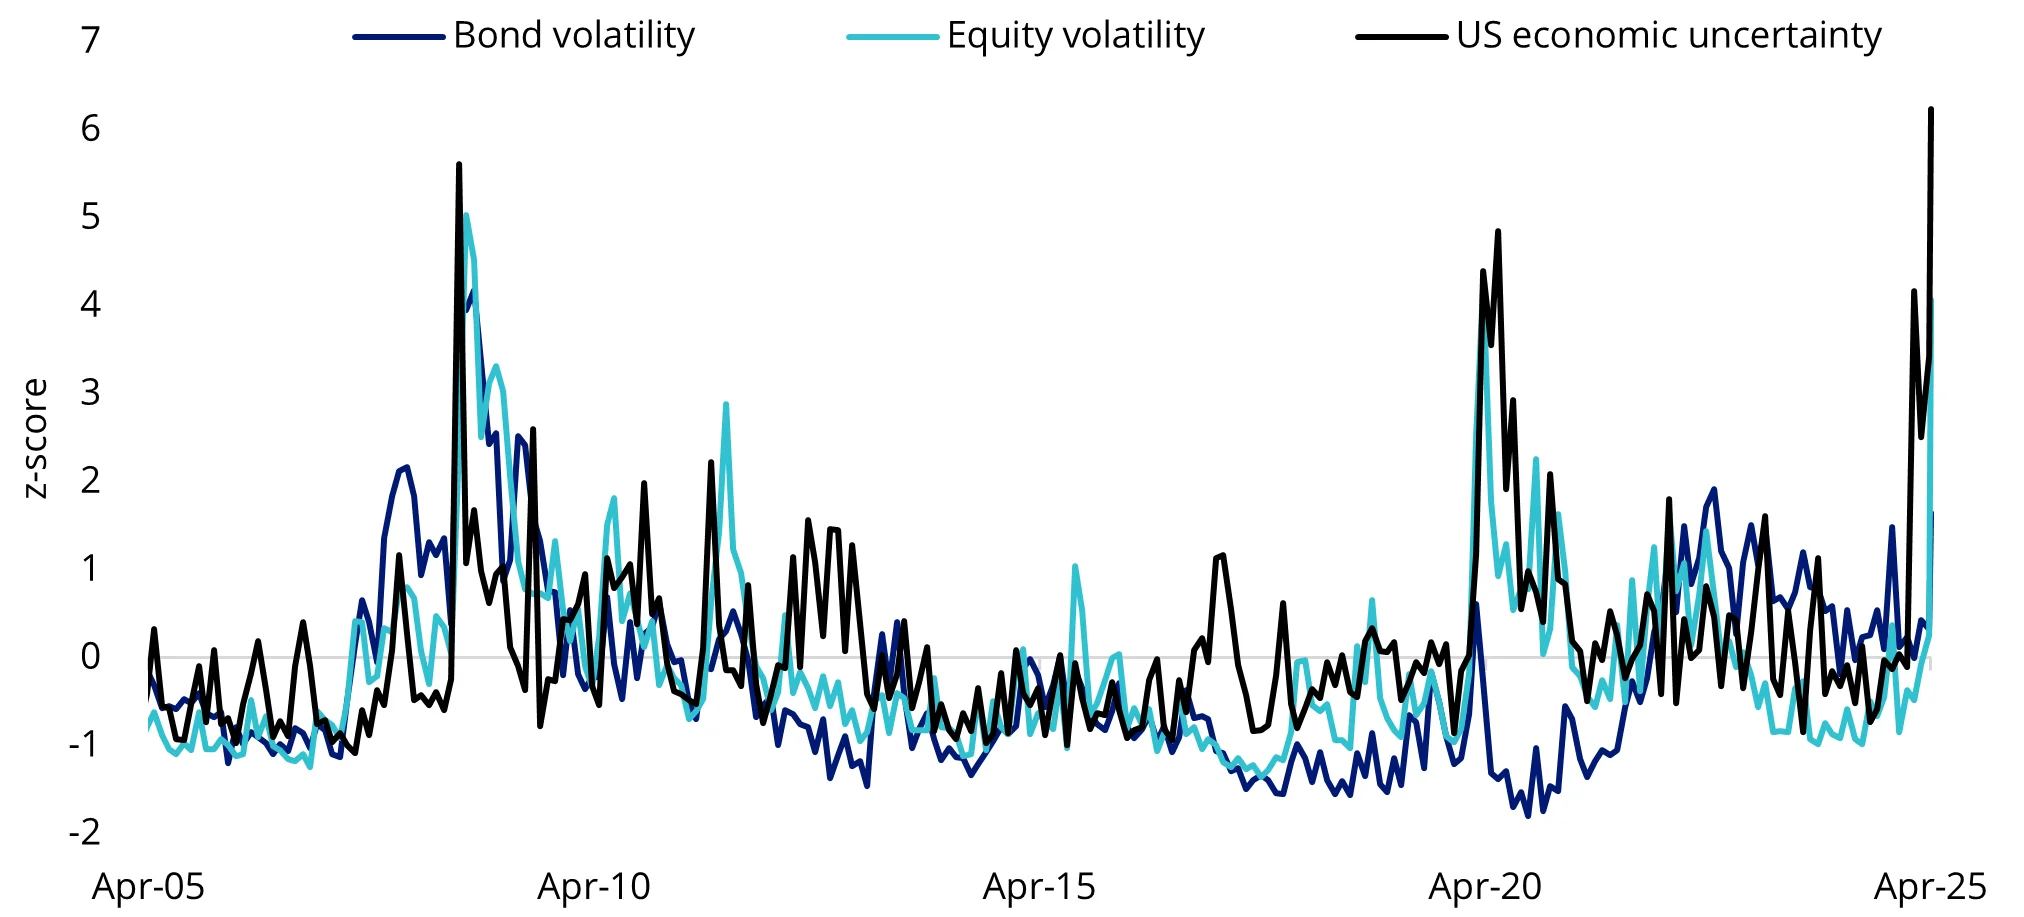
Source: VanEck. Bloomberg. Performance in AUD. Z-score is measured in terms of standard deviations from the mean. It is a measures of variability is used to determine volatility. Bond volatility: The VIX Index. Equity Volatility: The MOVE Index/ US economic uncertainty: US Economic Policy Uncertainty Index.
Defensive positioning becomes priority amid heightened volatilities
As record-high US tariffs loom, some investors are turning to the lessons from the Smoot-Hawley era for guidance as that was the last time average US tariff rates reached levels like those seen today.
As discussed in One Hundred Years of Tariff Lessons, the two periods are not directly comparable given the fundamental differences in economic conditions, monetary policy flexibility and global trade integration. For today’s investors, it serves as an extreme scenario with warnings on the disruptive impact of an uncontrolled global trade war.
Looking deeper into past tariff episodes from the Smoot-Hawley Act to the US-China trade war amid Trump’s first term, one commonality emerges: market volatility typically lingers for a considerable period and weighs on economic growth. This is why prolonged tariff wars tend to create a challenging environment for risk assets, triggering a broad-based tilt to defensive strategies.
Gold and gold miners
Gold is one of our three high-conviction asset picks for this year, recognising its role as a powerful portfolio diversifier. Having stood the test of time, gold serves as the ultimate hedge against uncertainty. Its low correlation with traditional equities and bonds further enhances its power to typically provide protection in equity market downturns.
Looking ahead, we believe an allocation to gold can be beneficial for investors seeking capital preservation, particularly given the uncertainty surrounding Trump’s persistent tariff threats and the fractured geopolitical and economic landscape. Additionally, for investors seeking a leveraged exposure to gold prices, gold equities offer an easily accessible channel.
Gold and gold equities returns were positive during Smoot-Hawley, Bush’s Steel Tariffs, US-China trade war periods and since President Trump’s second inauguration.
Chart 4: Gold and gold miners provide downside protection in tariff-driven markets
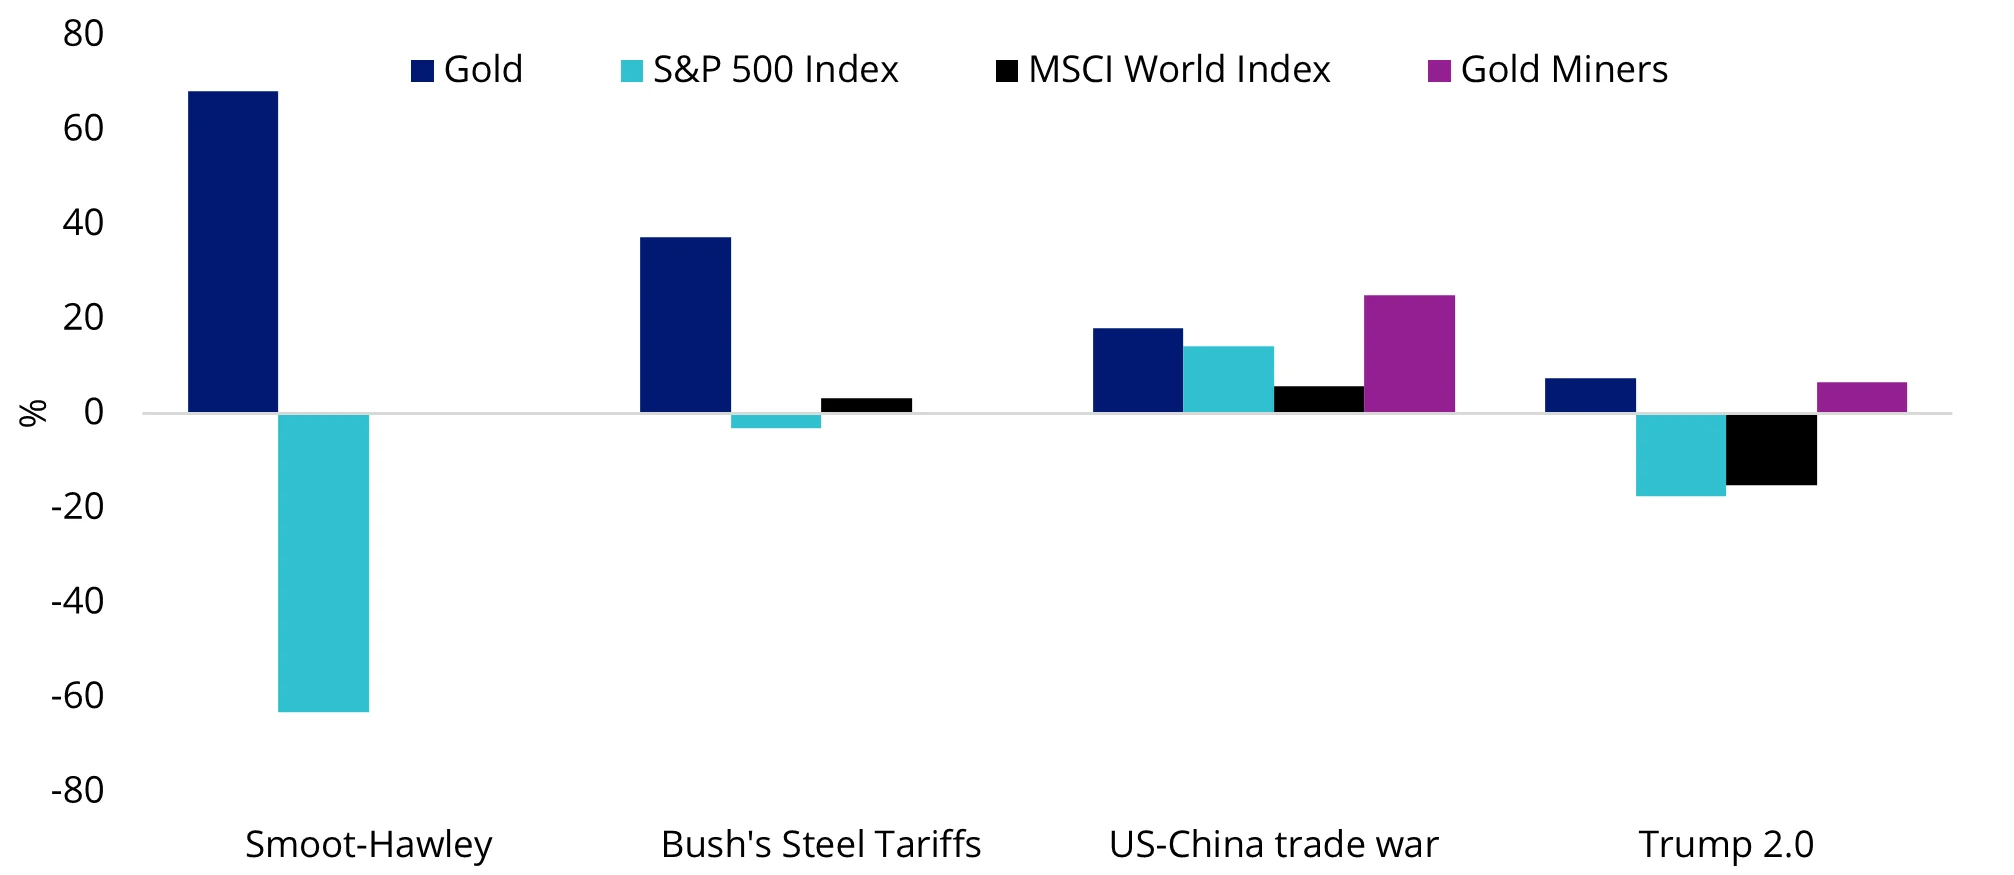
Source: VanEck. Bloomberg. Given data availability, performance are in USD. Gold Miners – NYSE Arca Gold Miners Index. Smoot-Hawley: Jan 1929 to 1934. Bush’s Steel Tariffs: March 2002 to December 2003. US-China trade war: Jan 2018 to Jan 2020. Trump 2.0: Jan to April 2025. Past performance is not indicative of future performance.
VanEck’s global leadership in gold investing stretches more than 50 years, encompassing gold equities and bullion across ETFs and active funds. Two ETFs for portfolio considerations:
- VanEck Gold Bullion ETF (NUGG): invest in physical, Australian origin gold bullion bars held locally at The Perth Mint.
- VanEck Gold Miners ETF (GDX): invest in a diversified portfolio of the largest gold mining companies in the world.


Published: 10 April 2025
Any views expressed are opinions of the author at the time of writing and is not a recommendation to act.
VanEck Investments Limited (ACN 146 596 116 AFSL 416755) (VanEck) is the issuer and responsible entity of all VanEck exchange traded funds (Funds) trading on the ASX. This information is general in nature and not personal advice, it does not take into account any person’s financial objectives, situation or needs. The product disclosure statement (PDS) and the target market determination (TMD) for all Funds are available at vaneck.com.au. You should consider whether or not an investment in any Fund is appropriate for you. Investments in a Fund involve risks associated with financial markets. These risks vary depending on a Fund’s investment objective. Refer to the applicable PDS and TMD for more details on risks. Investment returns and capital are not guaranteed.