Meet Money Magazines 2025 Best Fixed Income ETF: FLOT
Firstly, we thank all our clients for supporting the strategy since we launched FLOT seven years ago. FLOT tracks the Bloomberg AusBond Credit FRN 0+ Yr Index (FLOT Index). In Australia, this index is considered the market benchmark for floating rate notes (FRNs).
It has been a tumultuous few years in bond markets. As interest rates rose, FRNs could withstand the impact on bond markets better than some other types of bonds, even government bonds.
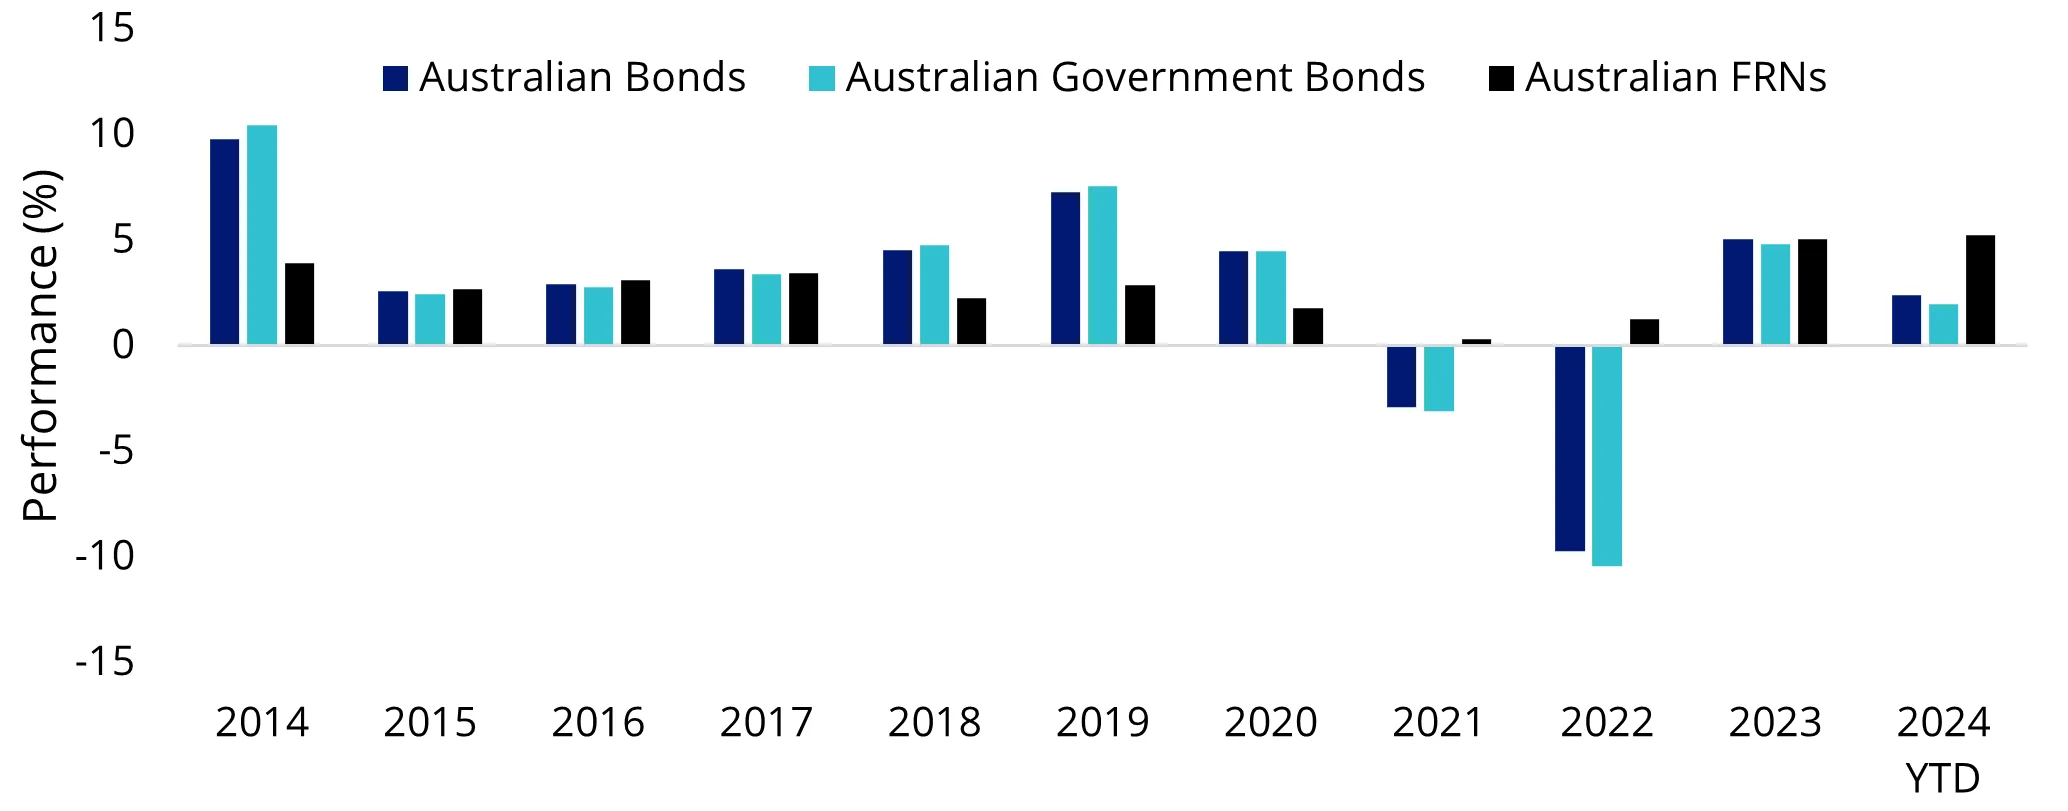
You can see this in the chart below which shows the annual returns for the broad Australian bond market, as represented by the Bloomberg AusBond Composite 0+ YR Index, the Australian Government Bond market, as represented by the Bloomberg AusBond Government 0+ YR Index, the Australian FRN market, as represented by FLOT’s Index. You can see that in 2021 and 2022, when interest rates were rising, FLOT’s Index outperformed the other bond indices.
Chart 1: Annual returns of Australian fixed and floating rate bonds

Source: Morningstar Direct. YTD is to 30 November 2024. You cannot invest directly in an index. Indices used: Australian Government Bonds is Bloomberg AusBond Government 0+ Yr Index; Australian Bonds is Bloomberg AusBond Composite 0+ Yr Index; Australian FRNs is Bloomberg AusBond Credit FRN 0+ Yr Index; Past performance is not a reliable indicator of future performance.
It is worth understanding why this has been the case.
Most bond investors seek stable and increased income above bank deposit rates. This is because they are riskier than bank deposits. Understanding the nature of these risks and the potential opportunities of different fixed-income investments is important. So, we thought we would present a primer on floating rate notes compared to Australian Government bonds.
A borrower, typically the government or a company, issues bonds to raise capital. In return, they promise to pay back, in full, bondholders on the bond’s maturity date. Until that date, the borrower pays regular interest payments or ‘coupons’ to the bondholder.
Bonds are commonly called ‘fixed-income’ investments. However, the term ‘fixed income’ should not be mistaken for any guarantee that income derived from a bond is ‘fixed’ or that bonds pay a fixed yield. The term instead is derived from the fact that bonds make ‘fixed’ coupon payments.
The difference between fixed and floating rate bonds
The key differentiator between FRNs, like the ones FLOT invests in, and other types of bonds is whether the interest coupon payment is fixed or variable. Most bonds carry a fixed coupon interest rate. As noted above, the coupon interest rate, from the time the bond is first issued until its maturity, does not change.
An example of a fixed-rate bond is government bonds. These are debt securities issued by the Australian Government. For example, a government bond with a 5% coupon interest rate will pay investors a $5 coupon per year per $100 of the bond's initial issue. The 5% interest rate was the interest rate at the time of issue. Irrespective of whether the interest rates go up or down after the bond is issued, this fixed-rate bond will pay is the $5 coupon until it matures.
With FRNs, the coupon interest rate is variable, or ‘floating’. It does this by tracking short-term interest rates.
FRN coupon interest rates are mostly set referencing the 90-day bank bill swap rate (BBSW). For example, a FRN may be issued with a face value of $100 for 3 years with a coupon of ‘3-month BBSW + 1%’.
This means coupon payments will increase if the benchmark 3-month BBSW interest rate rises, and coupon payments will decrease as the 3-month BBSW interest rate falls. The coupon interest rate of an FRN is usually reset each quarter to capture any changes in the benchmark BBSW.
This has the effect of preserving the capital value of the bond in a rising interest rate environment because as rates rise, existing fixed-rate bonds fall in value as investors seek higher coupon payments from newer issues.
Because FRNs are linked to these rate rises, their capital value is not as impacted as fixed-rate bonds. Naturally, the reverse is true in a falling-rate environment. Existing bonds increase in value, because they are paying a higher coupon payment than the new lower interest rate, and FRNs are less desirable because their coupon is linked to the falling rate.
Factors affecting a bond’s market price
The market price of a bond will vary over time depending on what's happening in the economy and with interest rates, as well as any changes in the borrower’s creditworthiness. If a borrower’s credit rating falls, then the prices of its bonds will also fall.
The relationship between risks and return
One of the features of FRNs that attract investor attention is their risk-adjusted returns. In investing, risk is quantified as volatility of returns, that is how much the returns go up and down. This volatility is measured by standard deviation. The higher the standard deviation of returns, the higher the risks.
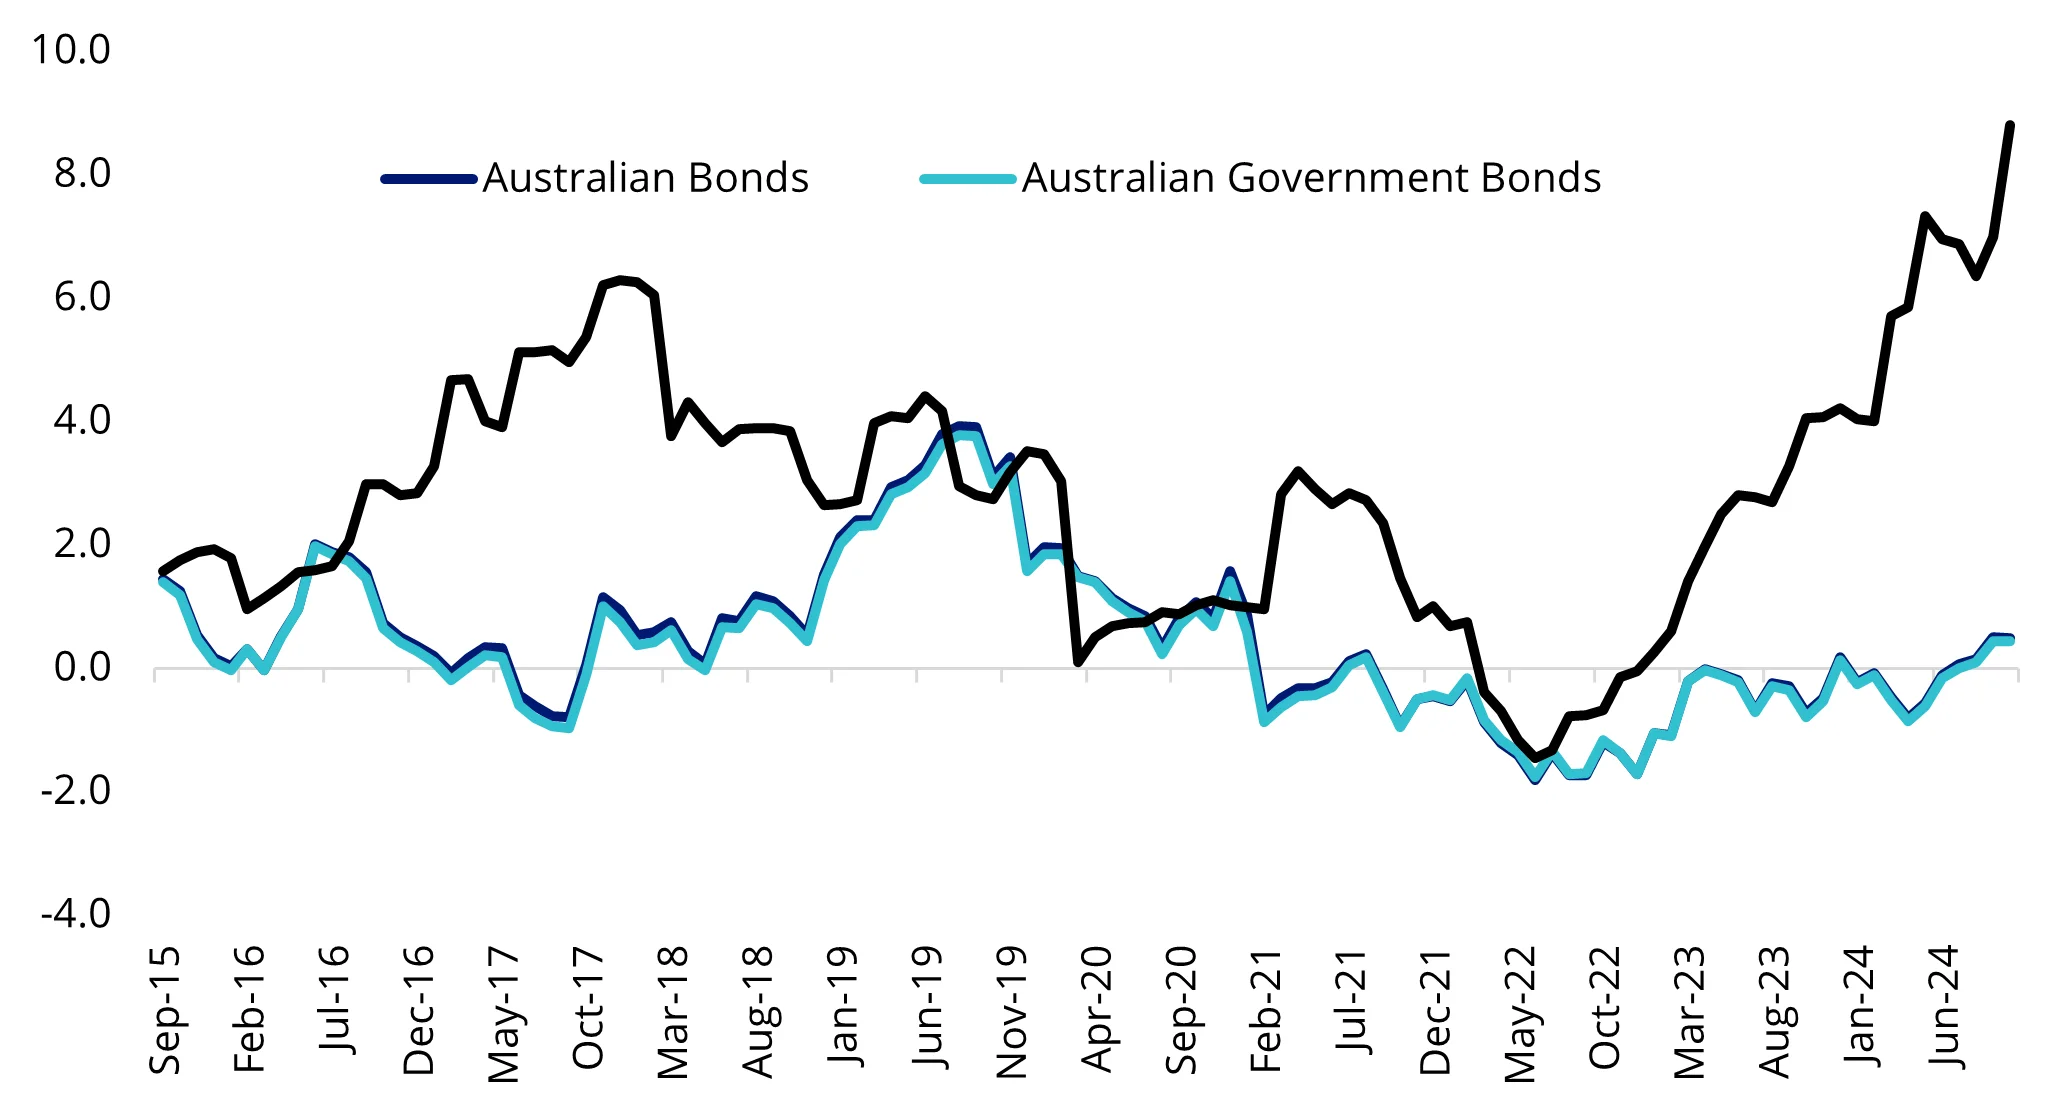
Economist, Willian Sharpe, developed a ratio to quantify the relationship between the returns and risk. The Sharpe ratio is a common measure of risk-adjusted returns. The greater the value of the Sharpe ratio, the better the risk-adjusted return. You can see in the chart below FLOT’s index consistently has a better Sharpe ratio than fixed-rate bonds.
Chart 2: Sharpe ratios of Australian fixed and floating rate bonds

Source: Morningstar Direct. Data is calculated to 30 November 2024. You cannot invest directly in an index. Indices used: Australian Government Bonds is Bloomberg AusBond Government 0+ Yr Index; Australian Bonds is Bloomberg AusBond Composite 0+ Yr Index; Australian FRNs is Bloomberg AusBond Credit FRN 0+ Yr Index; Past performance is not a reliable indicator of future performance
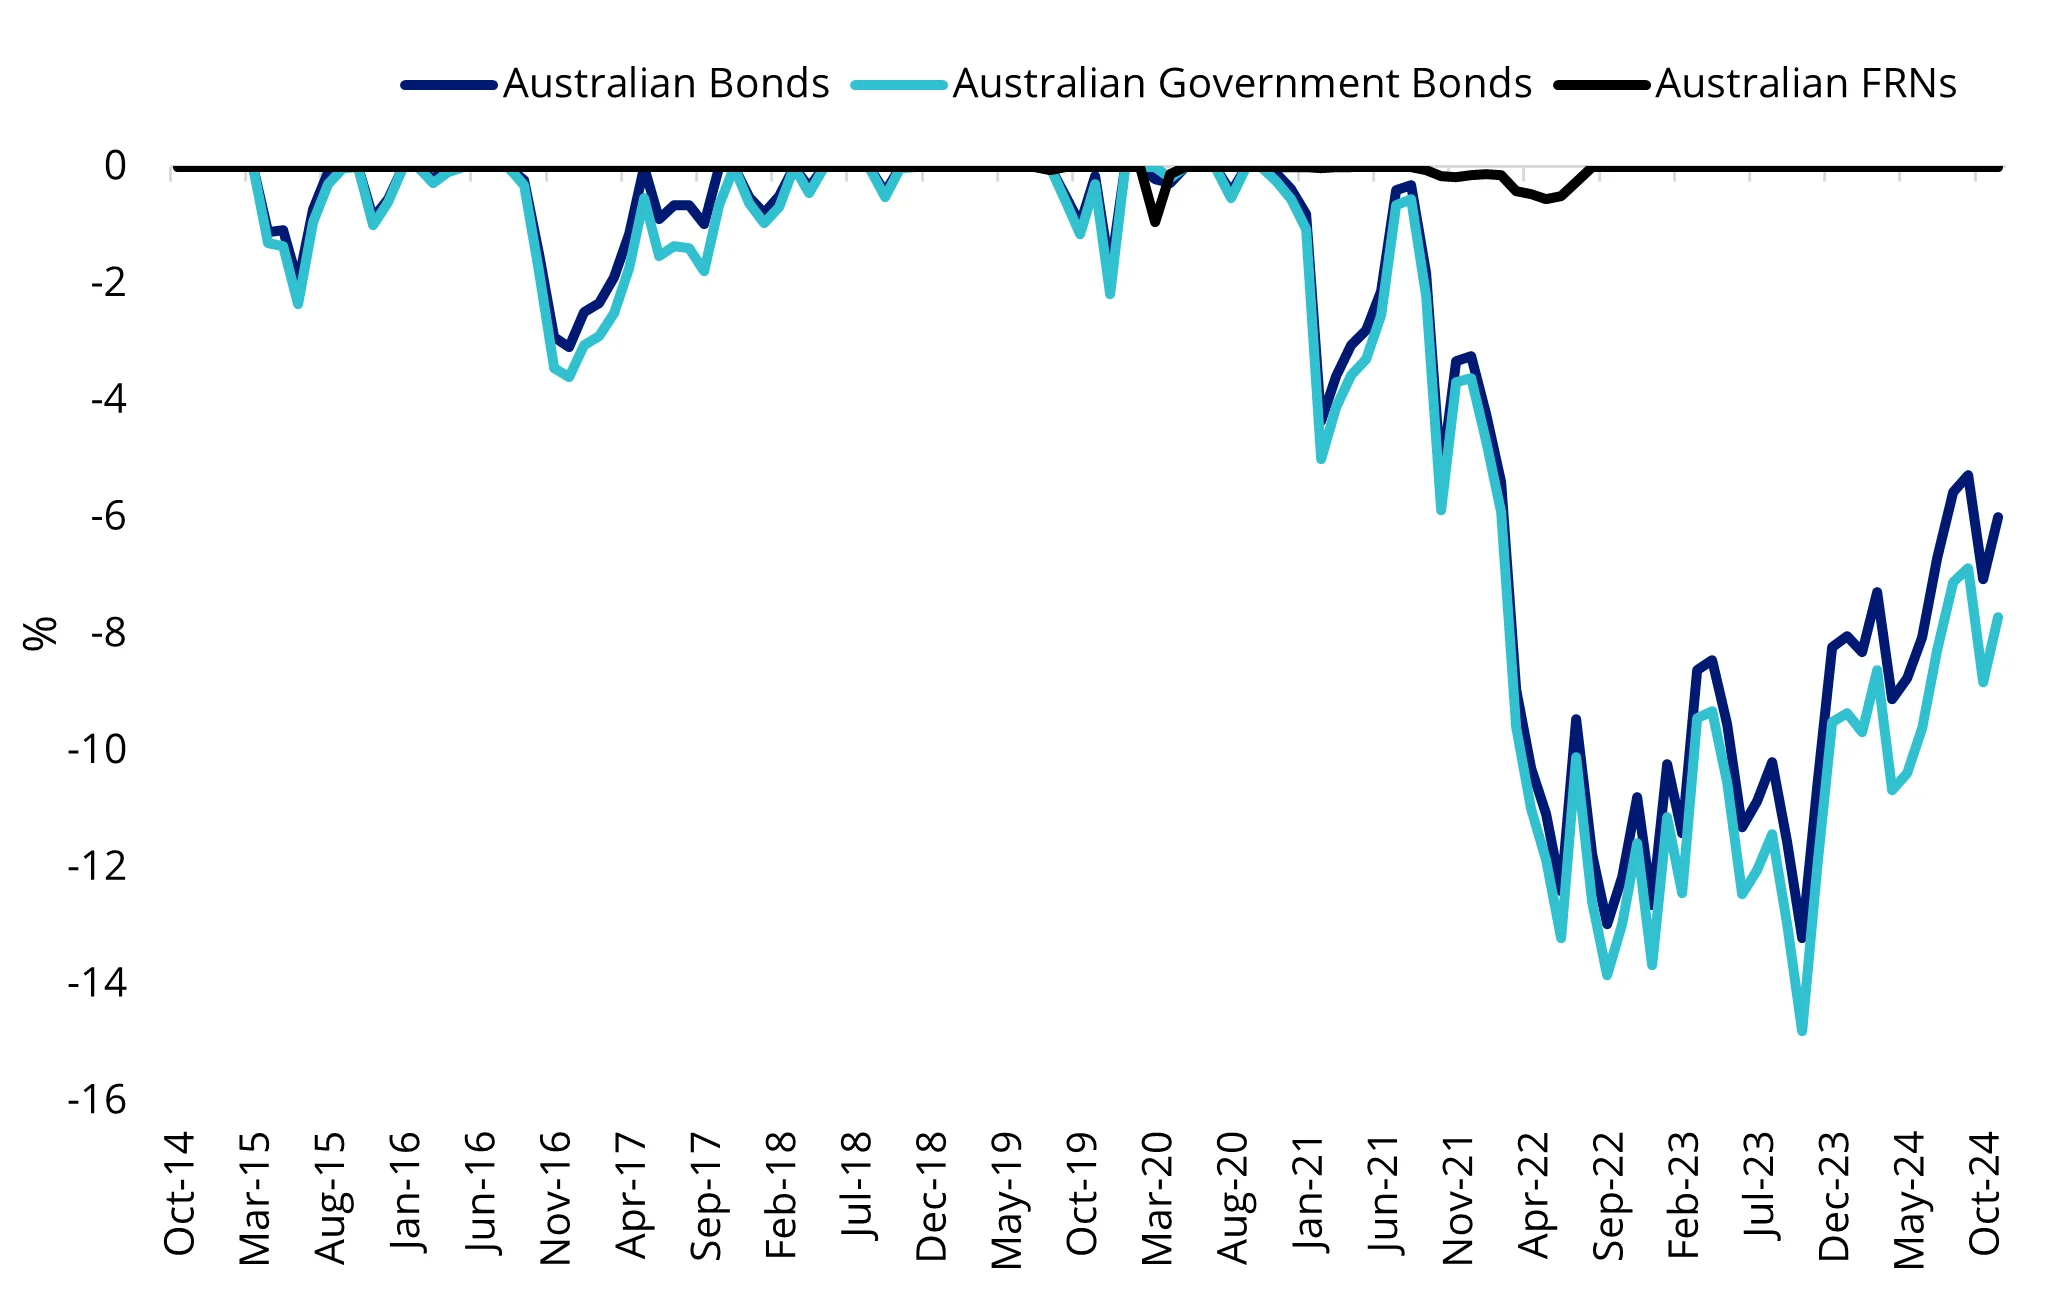
Many investors consider the risk of loss as the true ‘risk’ of their investment. Drawdown is a useful for this. It measures the depth of a fall from a previous peak. The pace of the recovery to a new peak is also important. Investments with a lower drawdown and faster recovery are often considered more desirable. Again, floating rate notes tend to fall less than their fixed rate counterparts.
Chart 3: Drawdown of Australian fixed and floating rate bonds

Source: Morningstar Direct. Data is calculated to 30 November 2024. You cannot invest directly in an index. Indices used: Australian Government Bonds is Bloomberg AusBond Government 0+ Yr Index; Australian Bonds is Bloomberg AusBond Composite 0+ Yr Index; Australian FRNs is Bloomberg AusBond Credit FRN 0+ Yr Index; Past performance is not a reliable indicator of future performance
Performance
You can see below FLOT’s performance. FLOT tracks the FLOT Index, which has outperformed the broader Australian bond and Australian Government bond market since its inception. Noting that past performance is not a reliable indicator of future performance. There will be periods FLOT outperforms fixed rate bonds, and there will be periods it underperforms fixed rate bonds.
Table 1: Trailing performance to 30 November 2024

* ETF inception date is 5 July 2017
Source: Morningstar Direct. Results are calculated to the last business day of the month and assume immediate reinvestment of distributions. ETF results are net of management fees and costs, but before brokerage fees or bid/ask spreads incurred when investors buy/sell on the ASX. Returns for periods longer than one year are annualised. Past performance is not a reliable indicator of current or future performance which may be lower or higher. Comparative indices used: Australian Government Bonds is Bloomberg AusBond Government 0+ Yr Index; Australian Bonds is Bloomberg AusBond Composite 0+ Yr Index; Australian FRNs is Bloomberg AusBond Credit FRN 0+ Yr Index.
Table 2: Summary of differences between FRNs and government bonds

Both floating rate and fixed rate bonds have merit for portfolio inclusion, and you should assess all the risks and consider your investment objectives.
We are proud that FLOT is the winner of the Money Magazine’s Best Fixed Income ETF 20251, offering a diversified portfolio of FRNs.
You can find out more about income investing here and about FLOT here.
Past performance is no guarantee of future performance. The above is not a recommendation. Please speak to your financial adviser or stock broker.
For further information, contact us via email or call us on +61 2 8038 3300.
Key risks
An investment in FLOT carries risks associated with: carries risks associated with: bond markets generally, interest rate movements, issuer default, credit ratings, fund operations, liquidity and tracking an index. See the VanEck Australian Floating Rate ETF PDS and TMD for more details. No member of the VanEck group of companies guarantees the repayment of capital, the payment of income, performance, or any particular rate of return from any fund.
Source
1This award is determined using a proprietary methodology. The award is solely a statement of opinion and does not represent recommendations to make investment decisions.
Published: 05 December 2024
Any views expressed are opinions of the author at the time of writing and is not a recommendation to act.
VanEck Investments Limited (ACN 146 596 116 AFSL 416755) (VanEck) is the issuer and responsible entity of all VanEck exchange traded funds (Funds) trading on the ASX. This information is general in nature and not personal advice, it does not take into account any person’s financial objectives, situation or needs. The product disclosure statement (PDS) and the target market determination (TMD) for all Funds are available at vaneck.com.au. You should consider whether or not an investment in any Fund is appropriate for you. Investments in a Fund involve risks associated with financial markets. These risks vary depending on a Fund’s investment objective. Refer to the applicable PDS and TMD for more details on risks. Investment returns and capital are not guaranteed.
Bloomberg Finance L.P. and its affiliates (collectively, “Bloomberg”) are not affiliated with VanEck and do not approve, endorse, review, or recommend the Fund. BLOOMBERG and the Bloomberg Ausbond Credit FRN 0+ Yr Index (“the FRN Index”) are trademarks or service marks of Bloomberg licensed to VanEck. Bloomberg does not guarantee the timeliness, accurateness, or completeness of any data or information relating to the FRN Index.


