There’s more to yield
10-year yields in the US and Australia have seen big moves this year. Explore why it matters for the direction of the economy and portfolios.
You may have heard, or read, in the financial press, references to the 10-year yield. It may have prompted you to wonder, why should I care about that?
Changes in the 10-year yield is often used to indicate the confidence investors have about the state of the economy. This then influences other asset prices, such as equities, which tend to do well when investors are encouraged about the economy’s direction or may fall if the outlook for the economy is expected to weaken.
The 10-year yield refers to the interest rate the government pays to borrow money from investors for 10 years. For example, when referring to the US, investors will reference the yield of 10-year US Treasury Bonds, for Australia the yield of 10-year Australian Government Bonds.
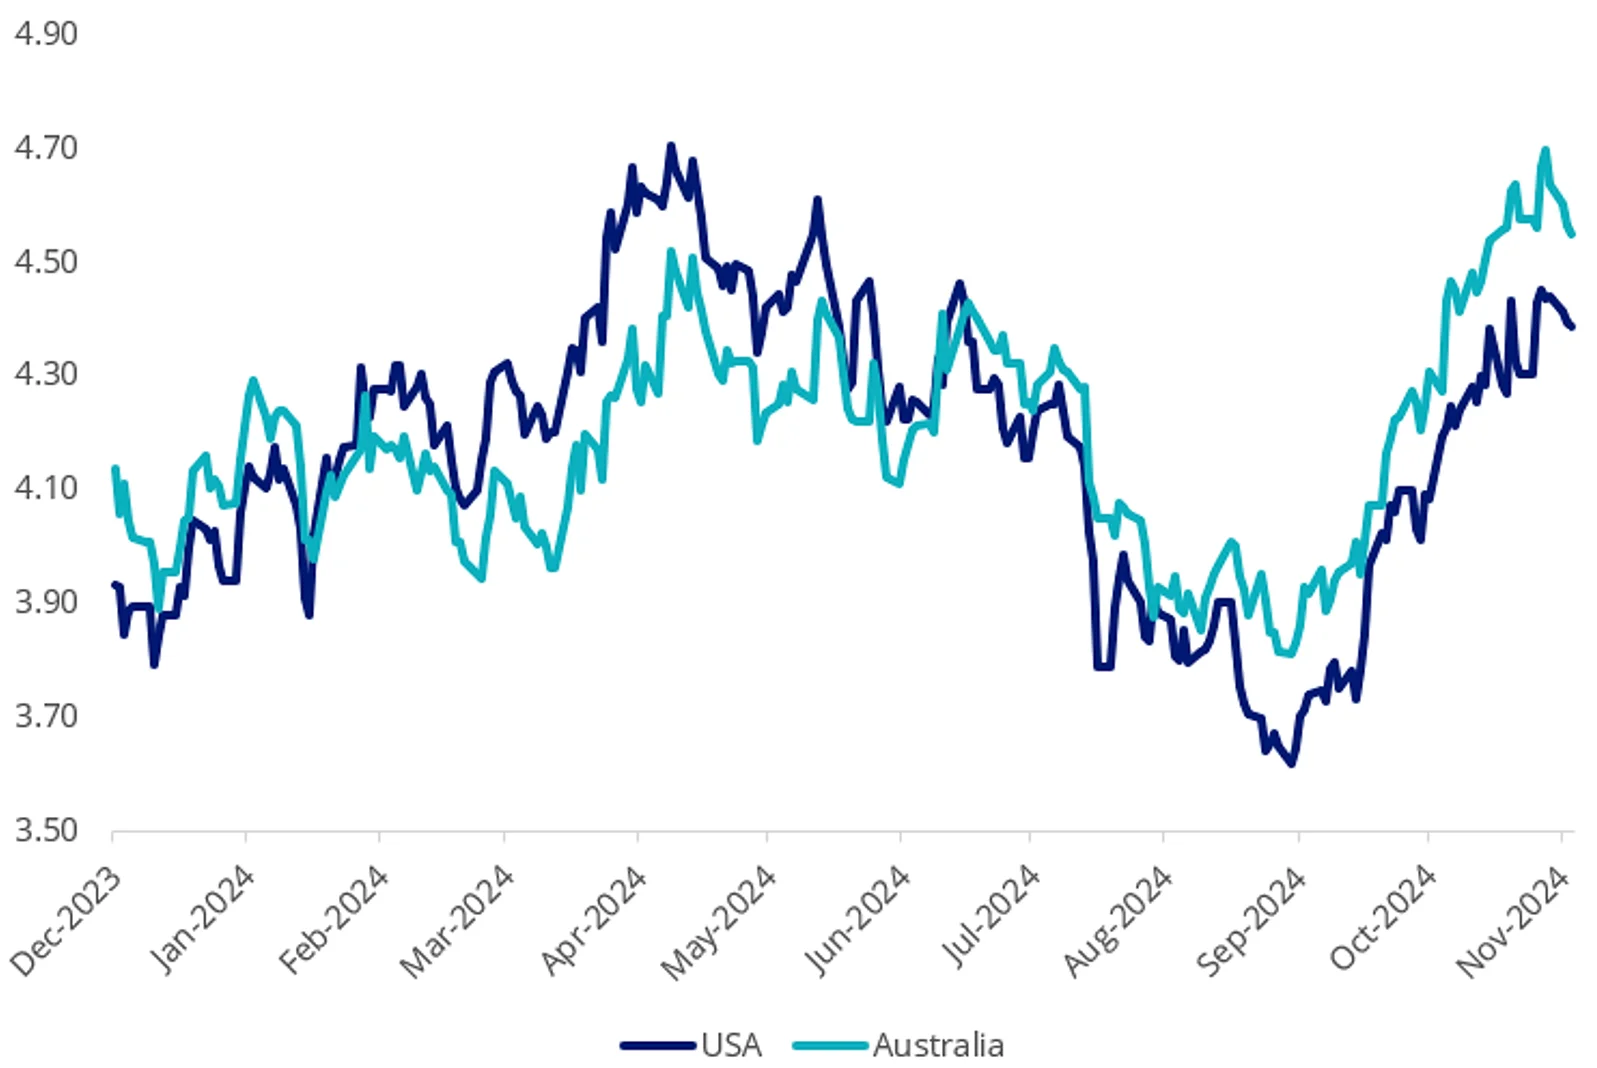
At the beginning of the year, the US 10-year yield was around 3.95%. It peaked at 4.69% in May, falling to 3.63% in September, before rising to be around 4.50% now. These are big swings.
Movements in the Australian 10-year yield have been just as wild. It started the year at 3.97%, rising to almost 4.60% in April, before falling to 3.76% in September. Since then, it has shot past May’s peak, and currently sits above 4.60%.
Chart 1: Australian and US 10 year government bond yield, year to date 2024.
Source: Bloomberg, to 20 November 2024.
So, what has been happening? Why should you care? And how could you invest as a result?
Don’t let yields slow you down.
Bond prices and yields
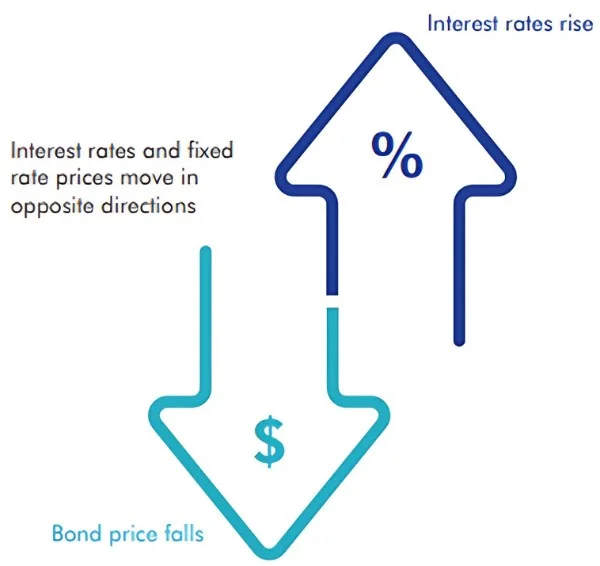
Remember, the most important factor affecting a bond’s price is the level of interest rates. When rates fall, existing fixed-rate bonds of all types become more valuable as they continue paying out the same coupon even though interest rates have fallen.
On the other hand, if interest rates rise, fixed-rate bonds become less valuable because their coupons are static and they therefore trade at a ‘discount’. The chart below shows this relationship.
Chart 2: The inverse relationship between bond prices and interest rates
Applying this to 10-year bonds, yields rise when investor confidence is high (causing the bond prices to fall). A rising 10-year yield indicates that investors are confident about the economy and thus markets. Investors may prefer riskier assets than bonds, so assets like equities may rise as 10-year yields rise.
When investor sentiment about the economy is poor, yields fall, and bond prices rise. A falling 10-year bond yield indicates investor caution about the direction of markets, so risky assets like equities may experience a fall in value.
Applying this to 2024, at the start of the year the market anticipated that the US Federal Reserve (Fed) would cut interest rates six times over the following 12 months (bond yields were lower, reflecting a subdued outlook).
What resulted did not match the market’s end-of-2023 sentiment. The US economy was stronger than expected, so the Fed did not rush into easing interest rates. US 10-year yields rose. By June, as inflation started to ease in the US, expectations of an imminent US interest rate-cut loomed again.
Interest rate cuts are usually in response to economic weakness to stimulate activity, as a result, the US 10-year yield fell to its September low. A Fed rate cut of 50 basis points (bps) in September was followed by a 25 bp cut in November. Economic data released since then shows that the US economy is strong.
Confidence in the economy is high and US 10-year yield has risen to its current 4.50% level.
Echoing these movements, the Australian 10-year yield has followed a similar trajectory despite our central bank, the RBA, keeping interest rates on hold throughout 2024. At the beginning of the year, the market anticipated some rate cuts. Again, the strength of the local economy came through and yields rose to their April highs. But inflation remained stubborn, and yields fell as investors feared an economic slowdown, or worse a recession.
These fears of a recession have not eventuated, and investors started to gain confidence in the Australian economy. 10-year yields have been rising since September.
All these changes in rates creates opportunities for investors.
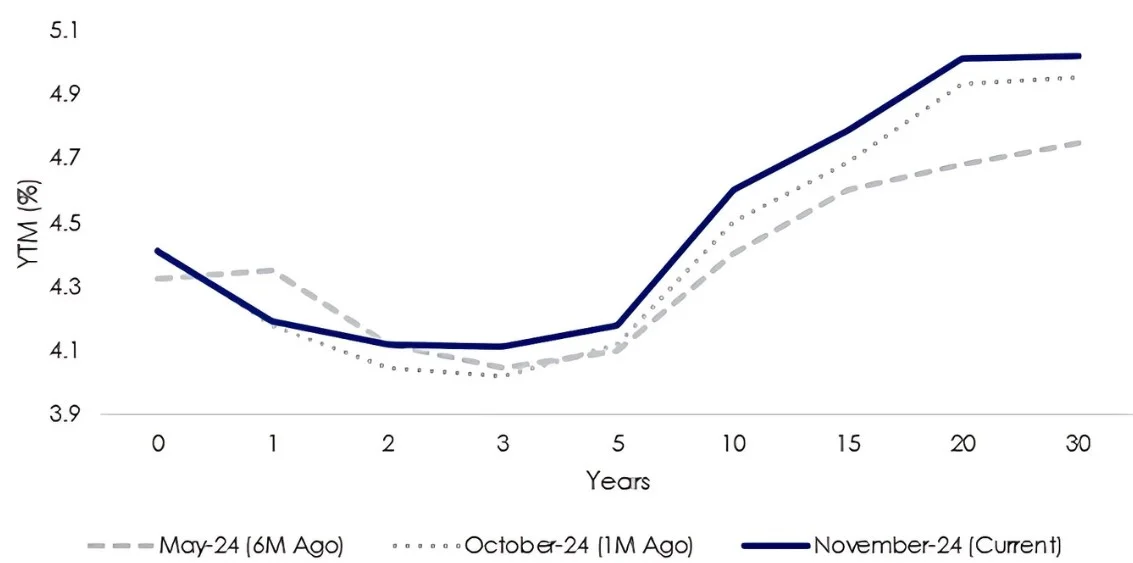
A yield curve is a line that plots the yields of Australian Government Bonds (AGBs) with differing maturity dates, and it includes 10-year bonds. Below is the yield curve now, compared to one month and six months ago.
Chart 3: Australian government bond yield curve
Source: VanEck, Bloomberg, 18 November 2024
You can see above that from May, yields at the longer end of the yield curve (10 years +) have risen, as yields rose (and the value of these bonds have fallen). There is also a noticeable rise in the past month, as investor sentiment improved over that period too. You can notice the shape of the curve has steepened, that is the longer end of the curve, has moved up more than the shorter end of the curve.
Given we’ve established that 10-year bonds are an economic indicator because it is a source of information about investors' expectations about the health of the economy, it stands to reason that investors can take a view about the slope of the yield curve and position their portfolios accordingly.
There are different scenarios for bond portfolios to be either overweight or underweight at the short, medium or long end of the yield curve. Here are some examples.
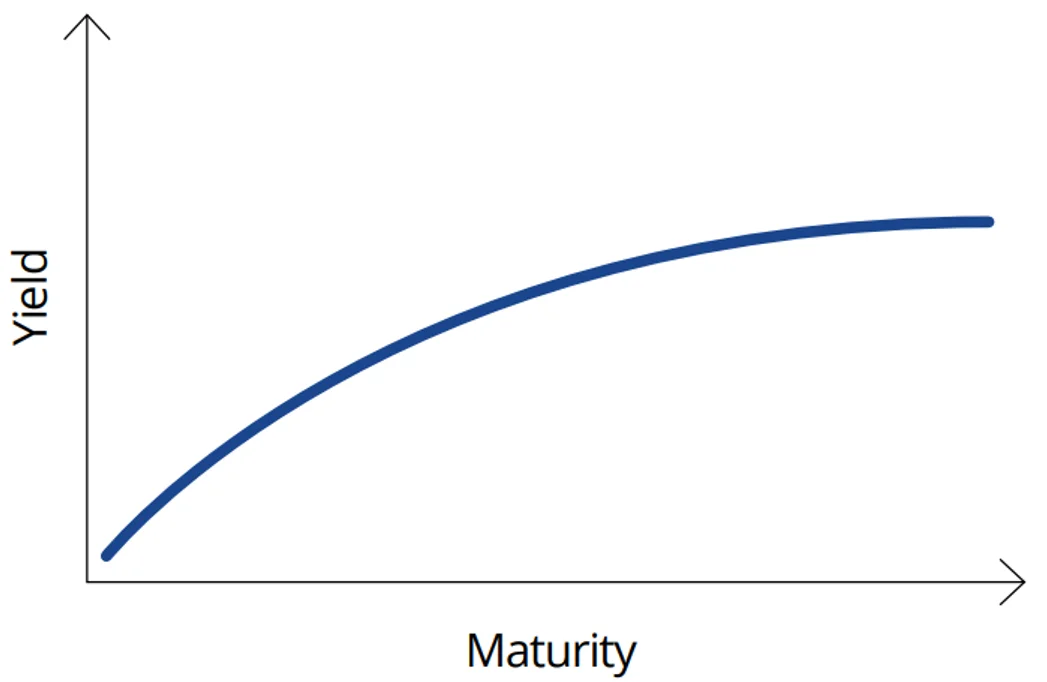
First, it’s important to understand the shape of the curve. A ‘normal’ yield curve is upward sloping where short-term yields are lower than long-term yields. Typically, this type of yield curve is seen during periods of economic expansion. In this environment, investors demand higher yields on longer-term bonds as compensation for inflation and future rate rises.
Chart 4: Normal Yield Curve
Source: VanEck. For illustrative purposes.
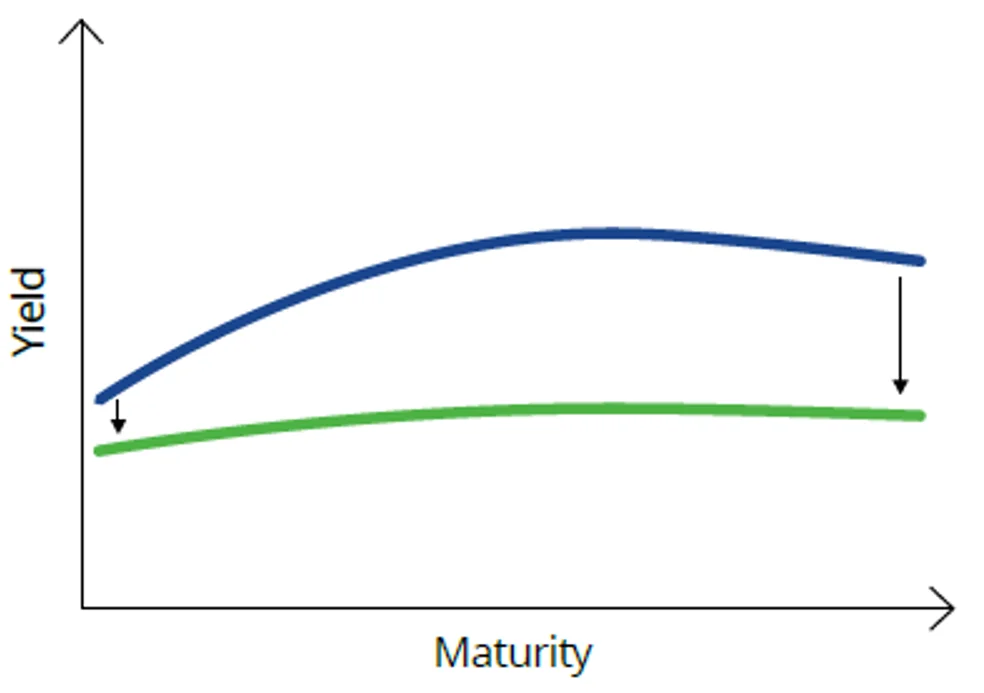
So, when bond markets forebode poor economic conditions the long end of the curve (10 years and beyond) typically decreases, resulting in a ‘flattening’ of the curve.
Chart 5: Normal to flat yield curve
Source: VanEck. For illustrative purposes.
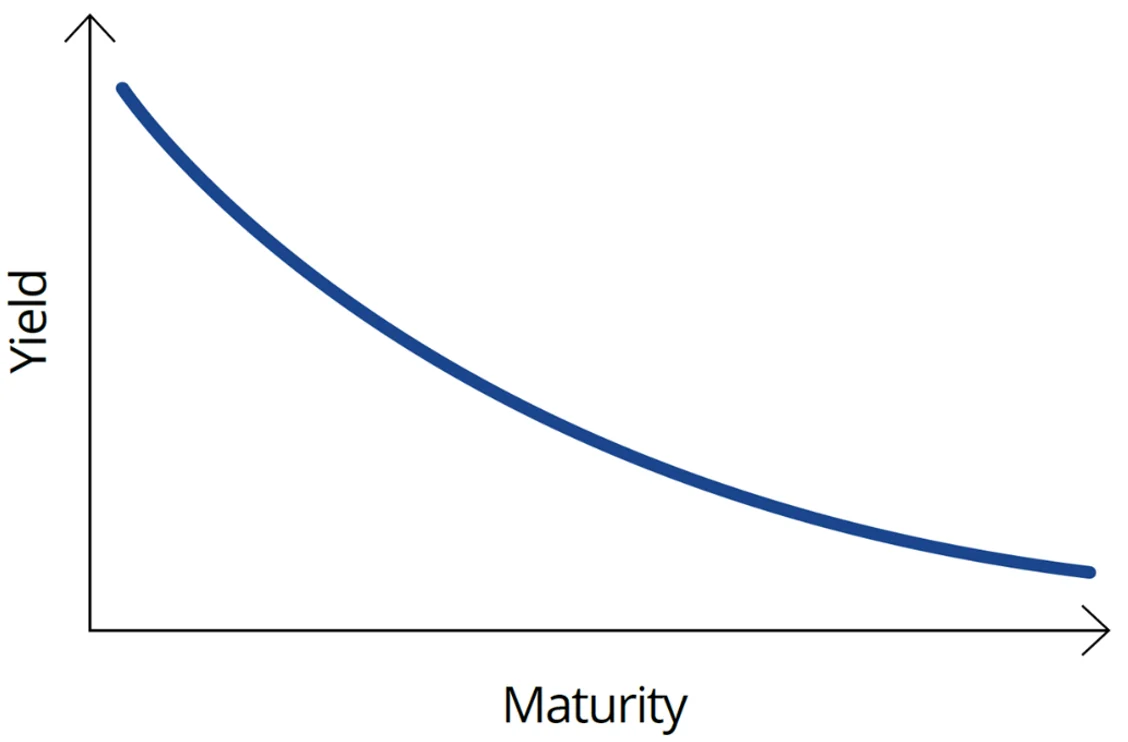
A more extreme scenario is when bond markets forecast the economy to enter a recession or slowdown, such that the yield curve inverts where short-dated yields are higher than long-dated. In the US, when this happens it is often a leading indicator of an impending recession. At the very least, an inverted curve may indicate that economic growth is going to slow down and that central banks will need to cut rates in the near term to stimulate economic growth.
Chart 6: Inverted yield curve
Source: VanEck. For illustrative purposes.
In both scenarios, the normal-to-flattening and a yield curve inversion, investors with longer-dated exposure benefit from bond price increases as yields fall.
Investing in long-dated bonds therefore is considered a defensive strategy as prices typically increase when forecast economic conditions deteriorate.
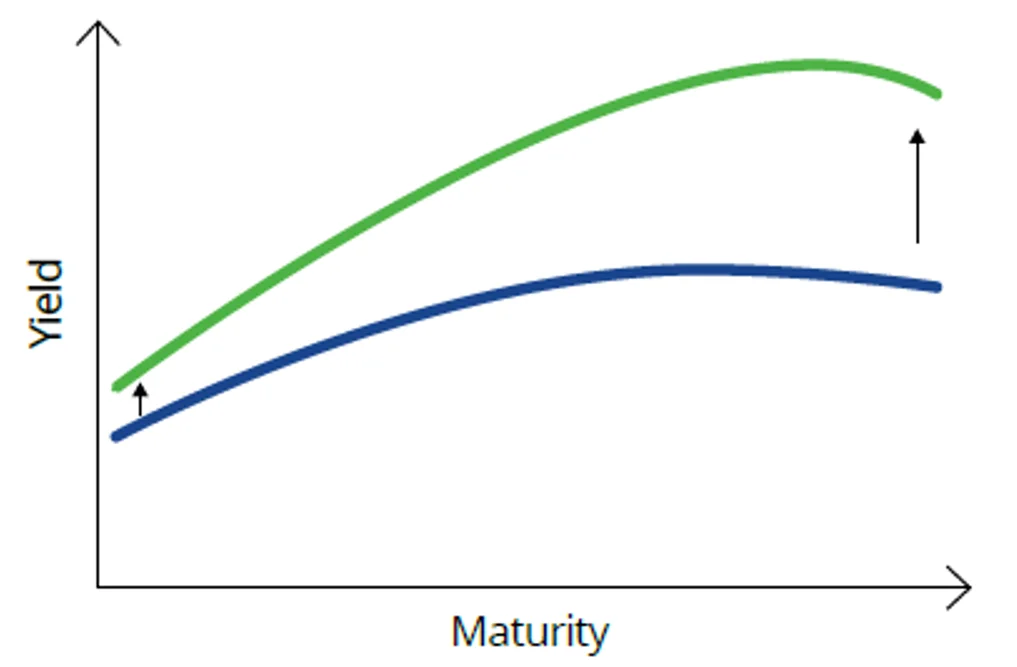
In another scenario, the yield curve can steepen at the long end, higher than at the short end. Bond investors refer to this as a 'bear steepen'. Bear, because rises in yields are bad, or ‘bearish’, for bonds. Typically, this yield curve movement is associated with an environment in which investors think economic activity is expected to rise. Shorter duration bond exposure is preferred here, to minimise the negative impact of rising yields on bond prices. Chart three above, of the Australian government bond yield curve, could be considered a real-life example of a normal to bear steepen.
Chart 7: Normal to bear steepen
Source: VanEck. For illustrative purposes.
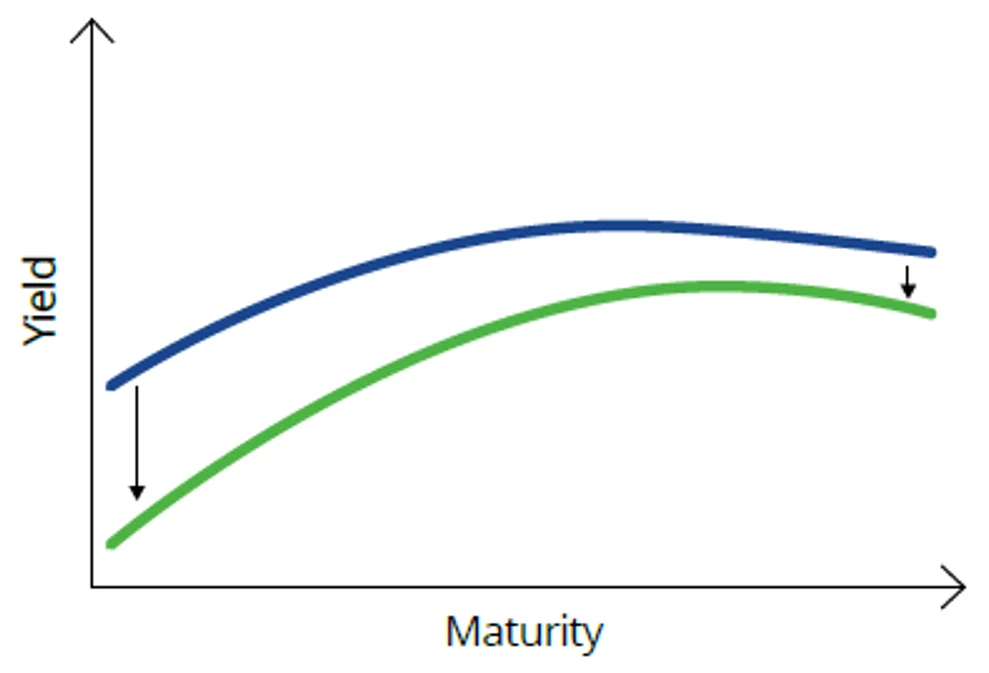
Sometimes yields fall, but short-term yields fall by more than long-term yields. This may occur in a falling-rate environment where the market thinks there will be near-term rate cuts and there will not be many of them, or they will be temporary. The bond-market jargon for this is a ‘bull steepen’ (bull – because falls in yields are good, or bullish, for bonds). Exposure to the short and middle parts of the curves is preferred in these instances because they will benefit more from the impact of falling yields on bond prices.
Chart 8: Normal curve to bull steepens
Source: VanEck. For illustrative purposes
The above is complex and difficult, but hopefully provides an understanding about how 10-year bonds, and the rest of the yield curve, impact the prices of bonds and other financial markets.
Now, the next time you hear about changes in 10-year yields, you may better understand what it could mean for your portfolio.
For those savvy enough, VanEck has three Australian government bond ETFs that provide investors with a way to ‘play’ the yield curve:
- VanEck 1-5 Year Australian Government Bond ETF (ASX code: 1GOV)
- VanEck 5-10 Year Australian Government Bond ETF (ASX code: 5GOV)
- VanEck 10+ Year Australian Government Bond ETF (ASX code: XGOV)
Targeting different parts of the yield curve
VanEck’s three ETFs allow investors to target those parts of the curve that exhibit the greatest differences in volatility. Each ETF has the potential to provide steady and reliable income, paid monthly.
1GOV - Targeted access to the short-end of the curve
Access to a portfolio of Australian government bonds which have maturity dates between 1 and 5 years.
5GOV - Targeted access to the mid-end of the curve
Access to a portfolio of Australian government bonds which have maturity dates between 5 and 10 years.
XGOV - Targeted access to the long-end of the curve
Access to a portfolio of Australian government bonds which have maturity dates between 10 and 20 years.
As always, we would recommend you speak to your financial adviser to determine which fixed-income investment is right for you.
An investment in the ETFs carry risks associated with: interest rate movements, bond markets generally, issuer default, credit ratings, country and issuer concentration, liquidity, tracking an index and fund operations. See the PDS for more details.
Published: 21 November 2024
Any views expressed are opinions of the author at the time of writing and is not a recommendation to act.
VanEck Investments Limited (ACN 146 596 116 AFSL 416755) (VanEck) is the issuer and responsible entity of all VanEck exchange traded funds (Funds) trading on the ASX. This information is general in nature and not personal advice, it does not take into account any person’s financial objectives, situation or needs. The product disclosure statement (PDS) and the target market determination (TMD) for all Funds are available at vaneck.com.au. You should consider whether or not an investment in any Fund is appropriate for you. Investments in a Fund involve risks associated with financial markets. These risks vary depending on a Fund’s investment objective. Refer to the applicable PDS and TMD for more details on risks. Investment returns and capital are not guaranteed.
© 2025 Van Eck Associates Corporation. All rights reserved.


