A Quality Decade
When QUAL launched 10 years ago it was among the earliest smart beta ETFs to list on ASX. Now it is the largest smart beta ETF on ASX. Why have savvy investors flocked to QUAL… Let’s have a look.
Also, at the time of QUAL’s launch, there were three main approaches for investing in international equities:
- via an actively managed fund;
- via a passive fund tracking the benchmark index; or
- buying stocks directly on overseas exchanges.
Actively managed funds have been known to incur high costs and the dispersion of returns between managers has been high. Sometimes the returns were good, but often they were not. According to S&P Dow Jones, over the long term, five- and ten-year periods, over 90% of global equity funds underperform the benchmark.
While over shorter time frames the actively managed fund success rate is higher, many people found investing in these funds a poor bargain and gravitated to lower-cost passive funds that tracked traditional indices or similar reproductions of these. In these passive funds, returns were considered average - not high, not low, just the market average.
Naturally, for some investors, neither of these options were appealing. These investors bore the costs (and paperwork) of investing in international shares directly on overseas exchanges, seeking opportunities not readily available on ASX like Apple, Google, Microsoft, Johnson & Johnson (J&J) and Nvidia.
It is not uncommon for these direct investors (and professional fund managers) to have read Benjamin Graham’s ‘The Intelligent Investor’, a book Warren Buffett calls, “the best book about investing ever written.”
A recurring theme of ‘The Intelligent Investor’ is that investors should demand from a company “a sufficiently strong financial position and the prospect that its earnings will at least be maintained over the years.”
It would be impossible for ‘intelligent’ Australian investors diversifying internationally to be able to analyse these characteristics for each company around the world.
MSCI, one of the world’s largest index providers, does the work for us. MSCI analyses the stocks in its global universe and identifies the companies with the strongest fundamentals for inclusion in its ‘Quality’ Indices.
According to MSCI, “Quality growth companies tend to have high ROE, stable earnings that are uncorrelated with the broad business cycle, and strong balance sheets with low financial leverage.”
MSCI’s description matches the characteristics Graham insists investors should demand from companies and is the basis for the MSCI’s World ex Australia Quality Index that QUAL tracks.
This new type of passive investing, known as smart beta, was new to Australian investors in 2014. Smart beta combines the best of active and passive management: the best of active in that it can reward investors over the long term and the best of passive in that it is low-cost.
QUAL allowed Australian investors to consider another approach to international investing.
You can read more about quality investing - here.
We think QUAL provides a compelling alternative to active funds and ETFs that track traditional indices or similar reproductions of these, even after you consider fees.
In celebration of QUAL’s 10thbirthday, let's compare it to the widely used international equity benchmark, the MSCI World ex Australia Index, (‘International Equity Index’).
QUAL vs International Equity Index - performance
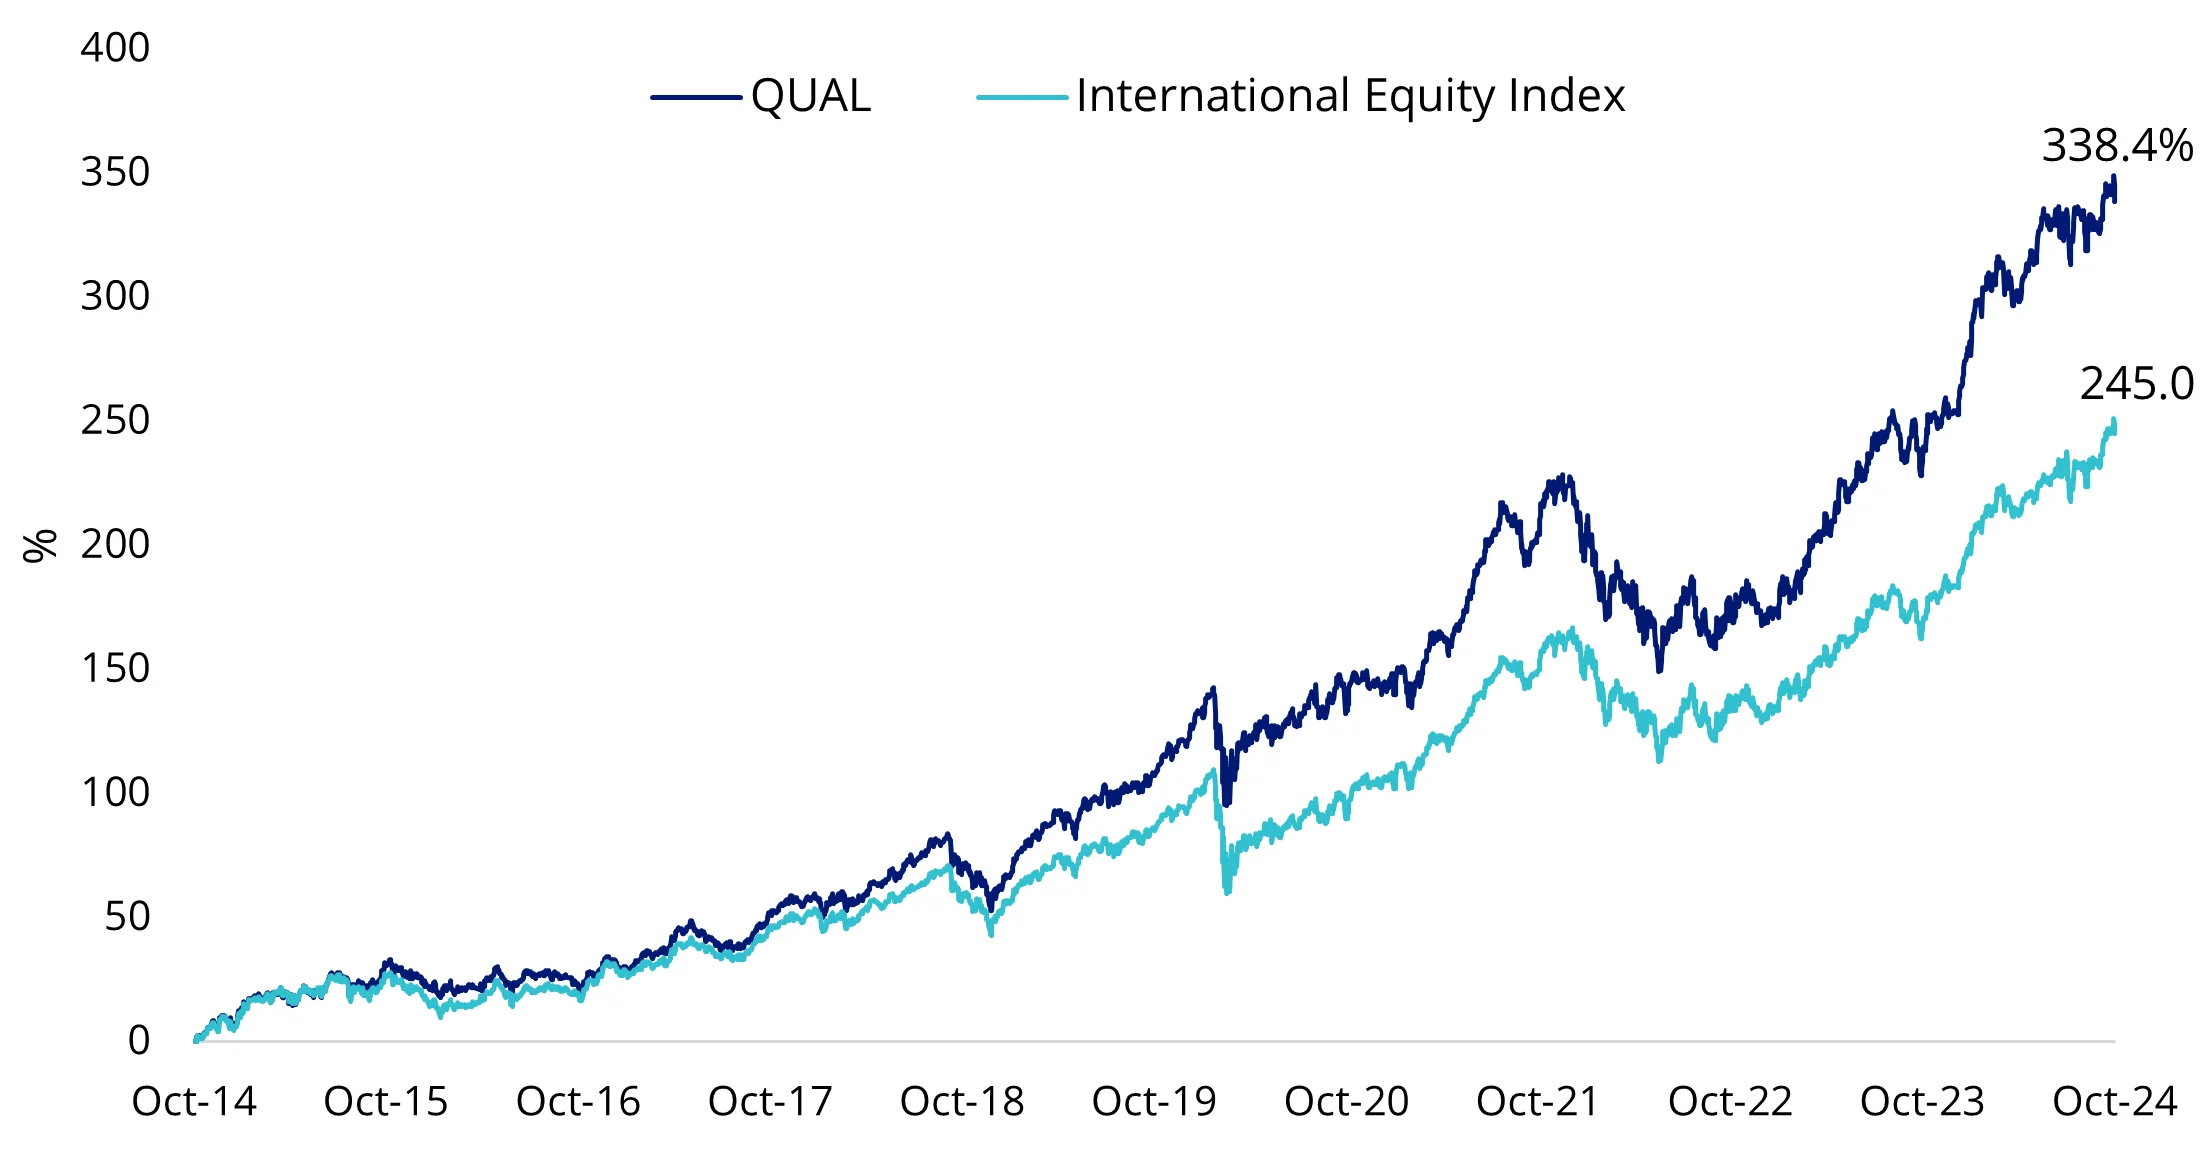
Since QUAL launched in 2014, its quality approach has served Australian investors well. Over longer-term periods QUAL has outperformed the International Equity Index – a testament to quality investing’s prowess across the range of economic cycles.
Chart 1: Cumulative performance since QUAL inception date to 31 October 2024

Table 1: Trailing performance to 31 October 2024

*Inception date is 29 October 2014 – the most recent factsheet is here.
International Equity Index is MSCI World ex Australia Index.
Chart 1 and Table 1 source: Morningstar Direct, VanEck. The chart and table above show past performance of QUAL and of the MSCI World ex Australia Index. You cannot invest directly in an index. Results are calculated to the last business day of the month and assume immediate reinvestment of distributions. QUAL results are net of management fees and other costs incurred in the fund, but before brokerage fees and bid/ask spreads incurred when investors buy/sell on the ASX. Returns for periods longer than one year are annualised. Past performance is not a reliable indicator of future performance. The MSCI World ex Australia Index (“MSCI World ex Aus”) is shown for comparison purposes, as it is the widely recognised benchmark used to measure the performance of developed market large- and mid-cap companies, weighted by market capitalisation. QUAL’s index measures the performance of 300 companies selected from MSCI World ex Aus based on MSCI quality scores, weighted by market cap x quality score at rebalance. Consequently, QUAL’s index has fewer companies and different country and industry allocations than MSCI World ex Aus. Click here for more details.
QUAL vs International Equity Index - top 10 holdings
Below you can see the top 10 companies. The top 10 holdings are companies that investors can relate to in their day-to-day lives – to see all the holdings in QUAL and their weightings click here. Some notable absentees in QUAL include Amazon (earnings variability) and Telsa (a combination of relatively weaker quality characteristics as determined by MSCI).
Table 2 & 3: Top 10 holdings QUAL and top 10 MSCI World ex Australia Index

Source: FactSet, VanEck, MSCI, as at 31 October 2024. Not a recommendation to act.
QUAL vs International Equity Index – Fundamentals
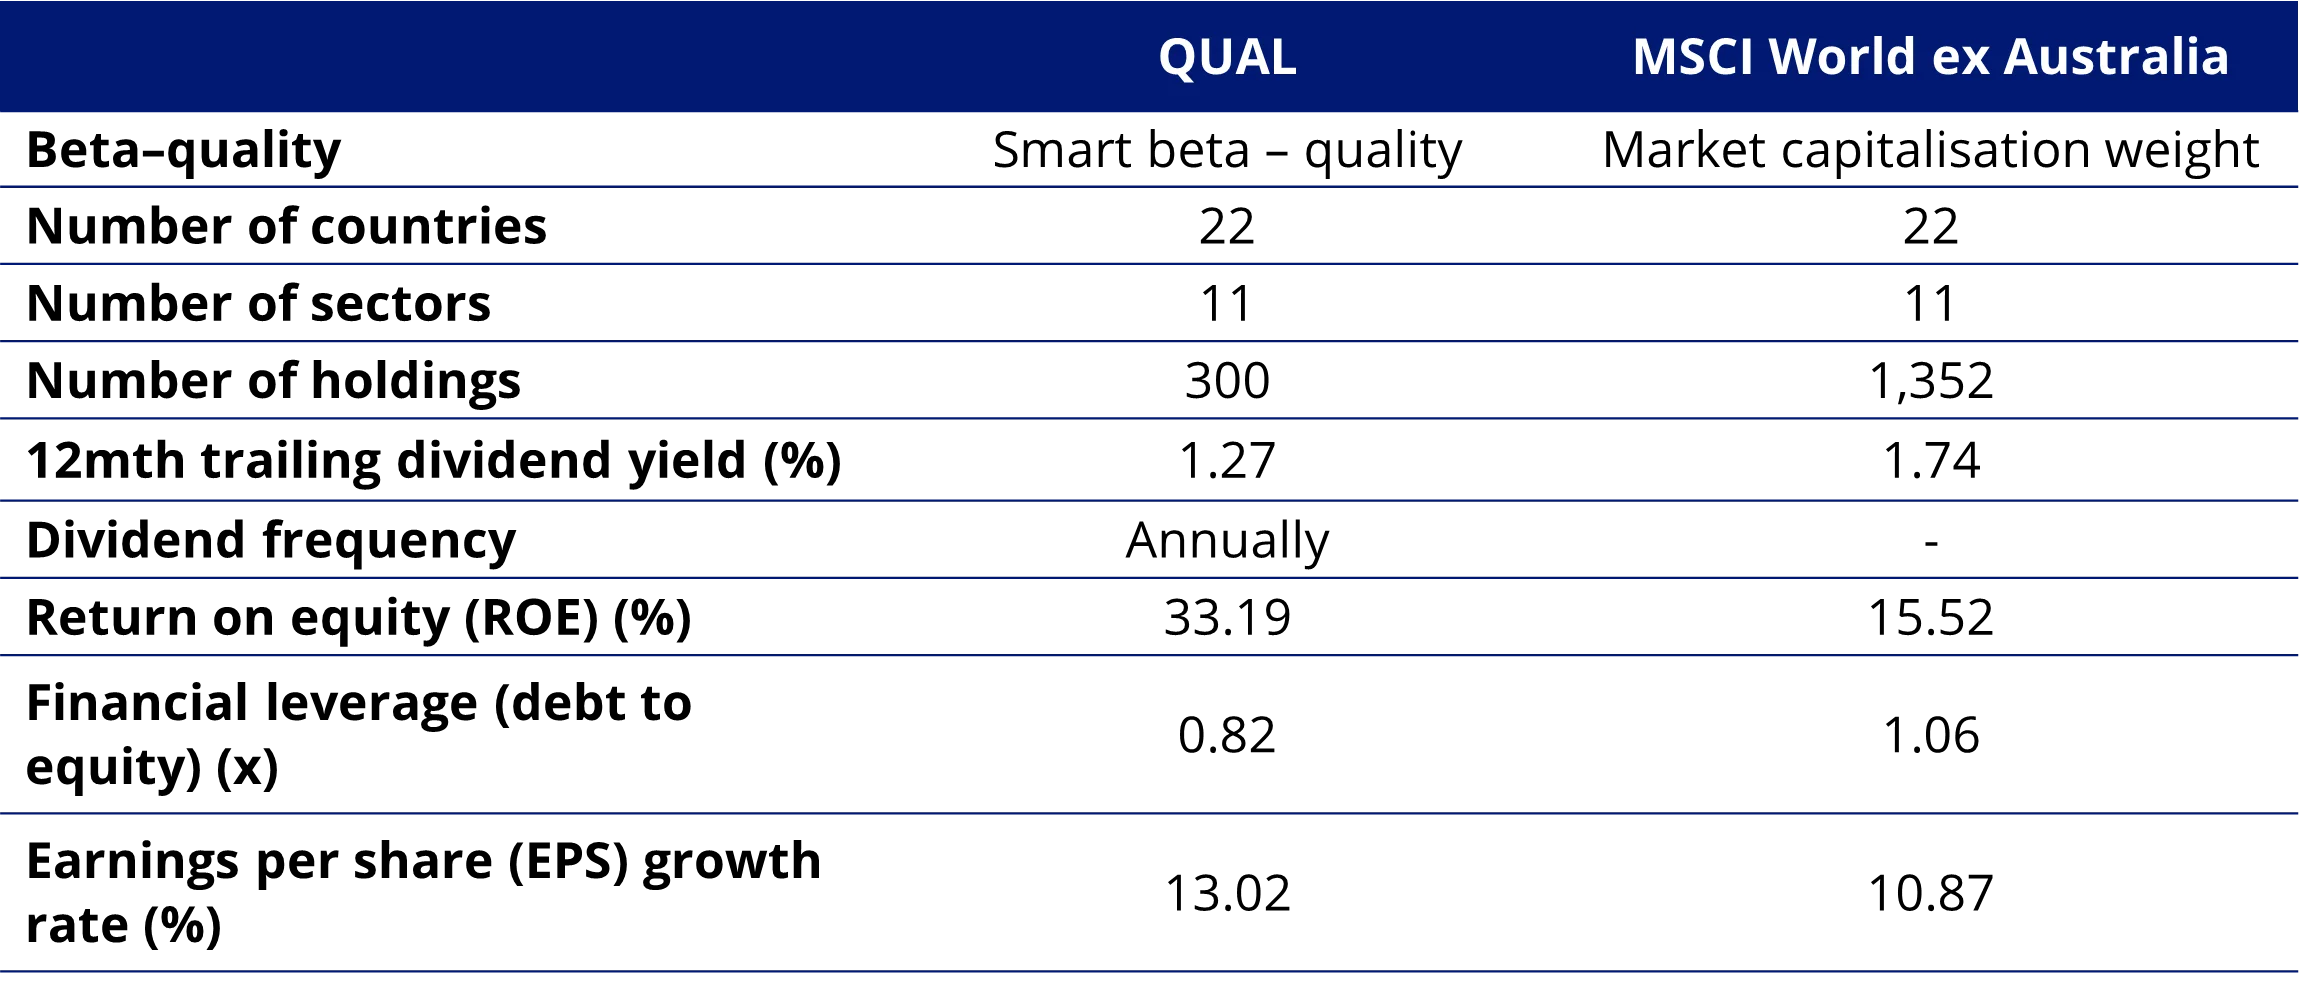
Table 4: Statistics and fundamentals

Source: VanEck, MSCI, FactSet, as at 31 October 2024. You cannot invest directly in an index.
As expected, QUAL has higher ROE, lower financial leverage and a higher EPS growth rate.
QUAL through the economic seasons
Over the past 10 years, it has been challenging for investors to navigate economic conditions and prevailing markets. A lot has changed, and the world has been through a lot. As noted above, in 2014 when QUAL launched, Obama was president. Tony Abbott was our Prime Minister.
2014 was also the year Russia annexed the Crimea and threatened the rest of Ukraine, the Eurozone was in economic turmoil with Germany and France on the brink of a recession that Italy was already deep in and an Ebola outbreak in Liberia, Guinea, and Sierra Leone had health officials worried about the response to that epidemic.
Now, there has been much speculation about whether there is going to be a global slowdown. In response to economic weakness, the US Federal Reserve commenced its rate cutting cycle following European central banks.
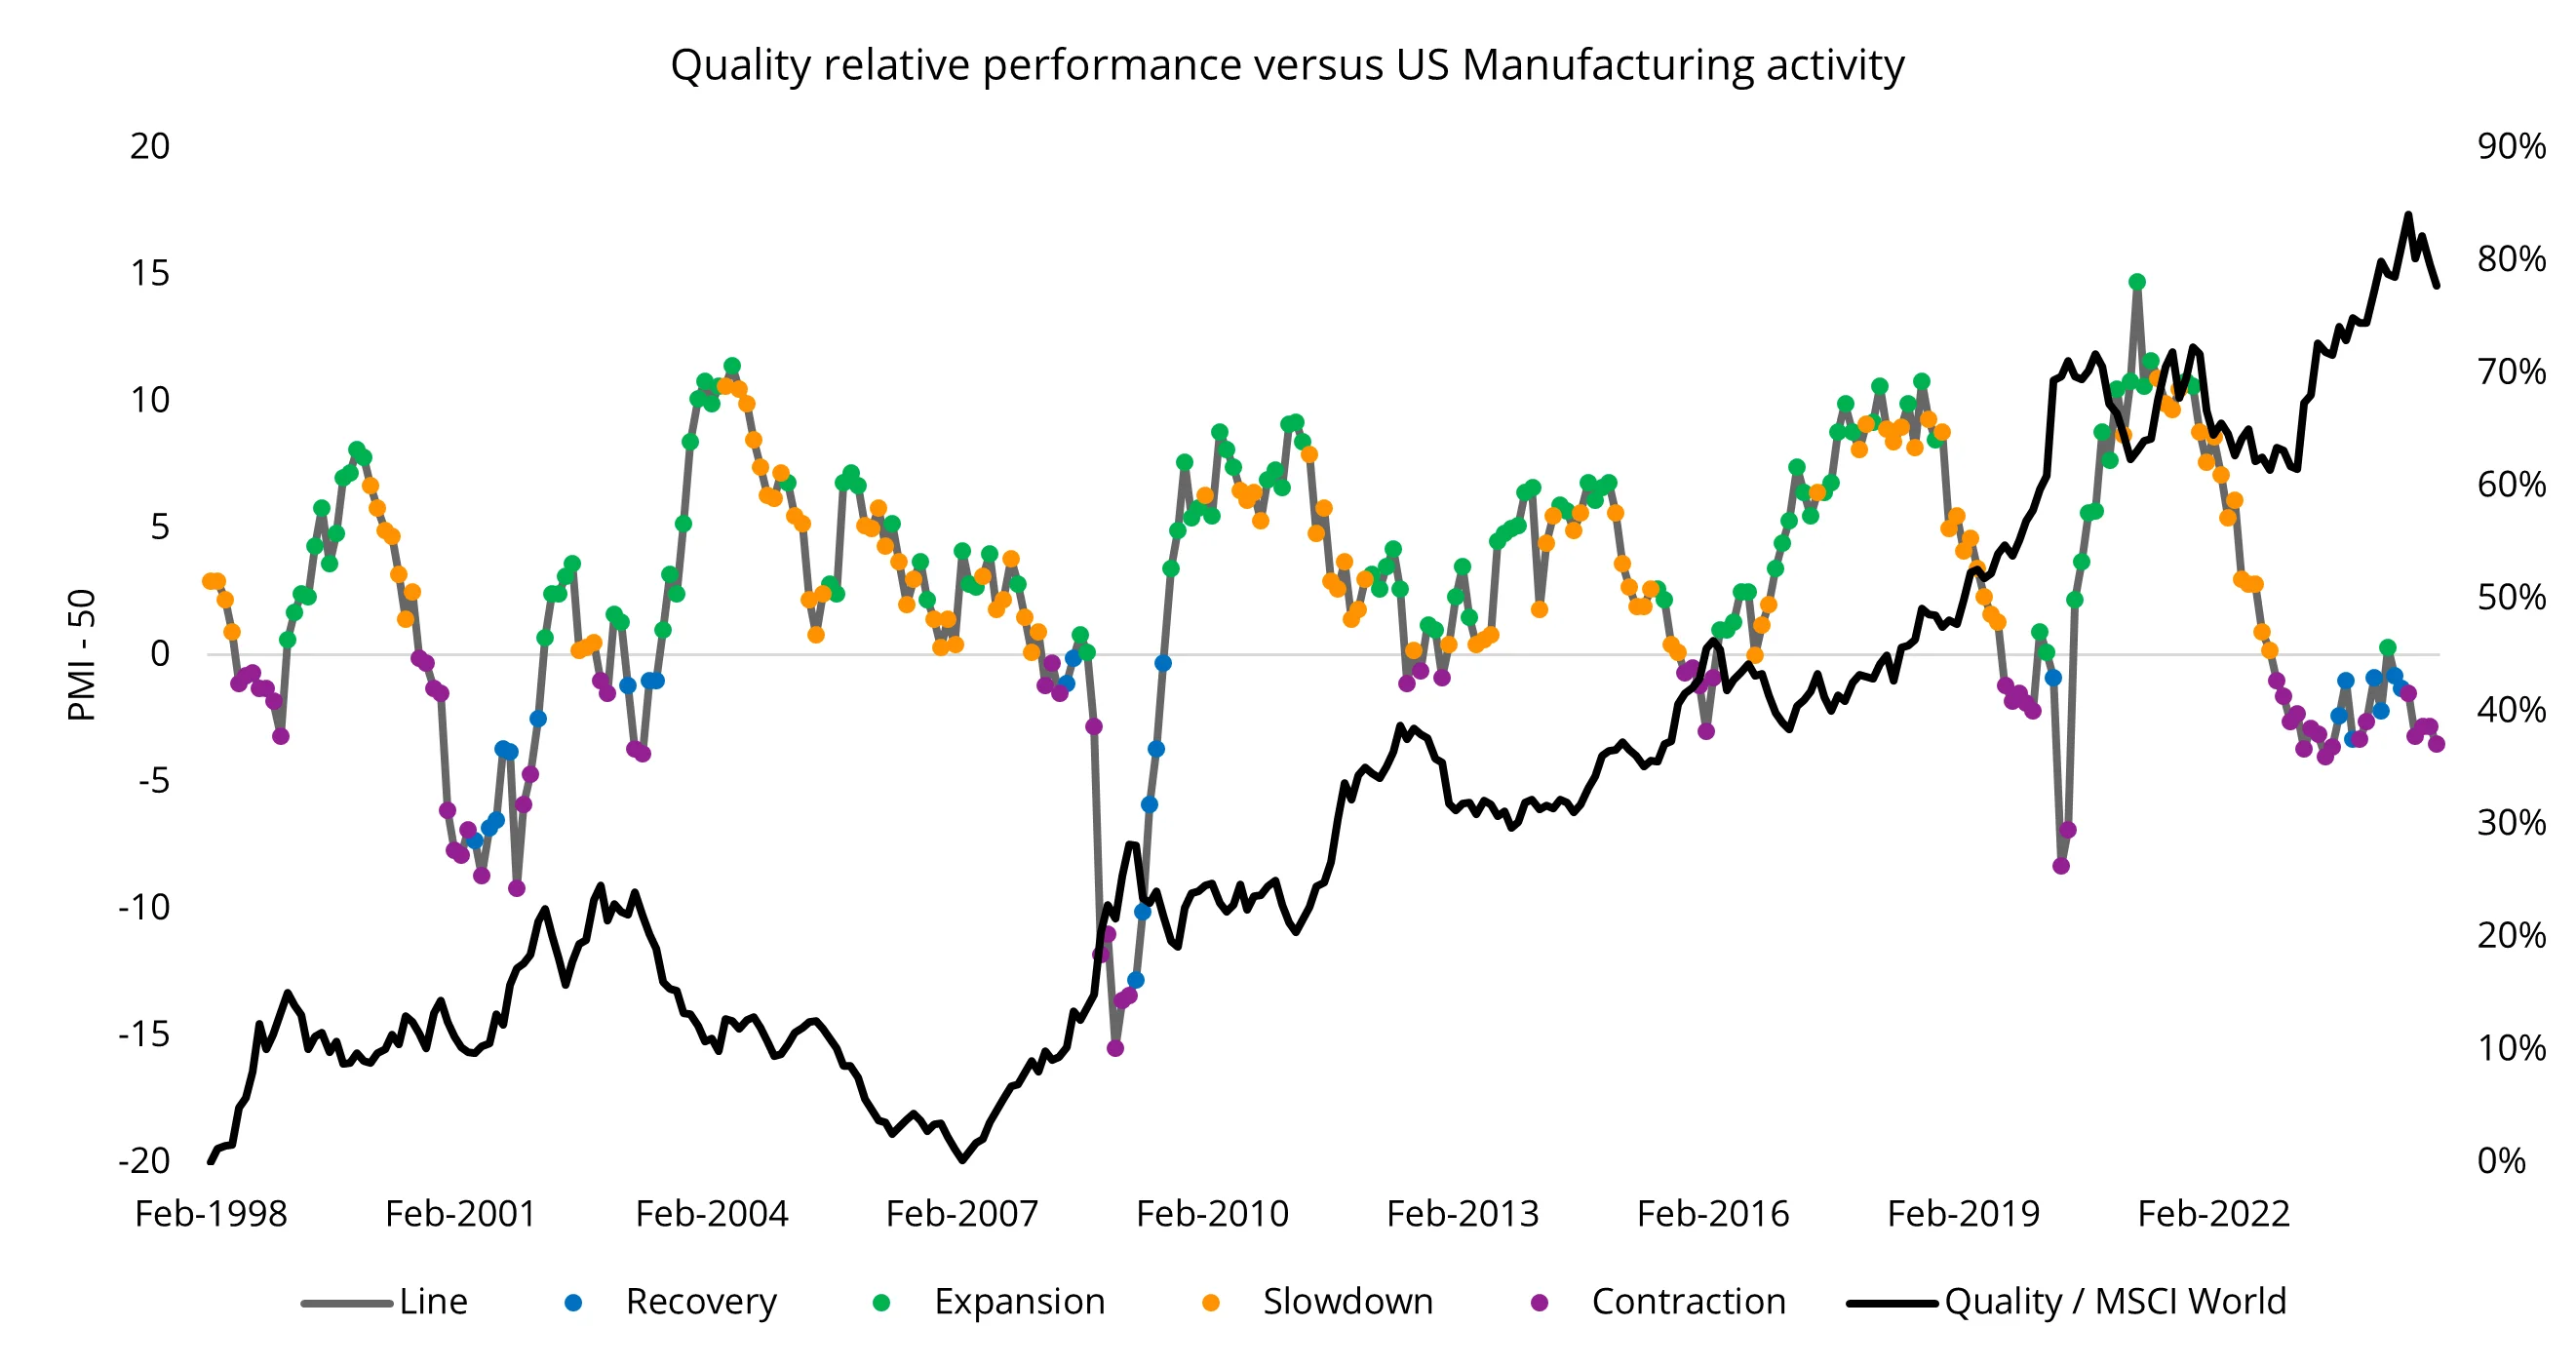
To illustrate how the quality factor may perform in the current economic environment, in Chart 2 below we overlay the manufacturing activity (a proxy for economic activity) with the relative performance of quality (MSCI World Quality Index/MSCI World Index) as represented by the black line. When the black line is rising, quality is outperforming. In the chart below each economic ‘season’ is represented by a colour: recovery (blue), expansion (green), slowdown (orange) and contraction (purple).
Chart 2 – US ISM Manufacturing PMI Index and relative MSCI World Quality performance

Source: Bloomberg, MSCI, October 2024. Past performance is not a reliable indicator of future performance Quality and MSCI World represented by the MSCI World Quality Index and MSCI World Index respectively.
The black line illustrates that Quality has outperformed over the long term, it is evident that quality had periods of outperformance and underperformance and that these tend to correlate to the economic cycle. The table below represents the returns of the quality factor through the cycle.
Table 5: Quality factor performance during different economic regimes

Source: Bloomberg, MSCI, October 2024. Past performance is not a reliable indicator of future performance. Quality and Benchmark are represented by the MSCI World Quality Index and MSCI World Index respectively
You can see that quality historically outperformed most during a contraction and subsequent recovery. As a result of these performance characteristics, the quality factor has earned the reputation as being a ‘defensive factor’. Quality companies have dependable earnings and are lowly leveraged, so they are able to better withstand the extremes of the economic cycle.
While we always point out that past performance cannot be relied upon for future performance, the quality factor has historically demonstrated long-term outperformance across economic cycles.
We highlighted the importance of quality during slowdowns and contractions here and here.
While many international equity ETFs and international active funds have merits for portfolio inclusion, you should assess all the risks and consider your investment objectives.
Australian dollar-hedged versions of many exposures noted exist too.
Past performance is no guarantee of future performance. The above is not a recommendation. Please speak to your financial adviser or stock broker.
Key risks
An investment QUAL carries risks associated with: ASX trading time differences, financial markets generally, individual company management, industry sectors, foreign currency, country or sector concentration, political, regulatory and tax risks, fund operations and tracking an index. See the PDS for details.
Published: 07 November 2024
Any views expressed are opinions of the author at the time of writing and is not a recommendation to act.
VanEck Investments Limited (ACN 146 596 116 AFSL 416755) (VanEck) is the issuer and responsible entity of all VanEck exchange traded funds (Funds) trading on the ASX. This information is general in nature and not personal advice, it does not take into account any person’s financial objectives, situation or needs. The product disclosure statement (PDS) and the target market determination (TMD) for all Funds are available at vaneck.com.au. You should consider whether or not an investment in any Fund is appropriate for you. Investments in a Fund involve risks associated with financial markets. These risks vary depending on a Fund’s investment objective. Refer to the applicable PDS and TMD for more details on risks. Investment returns and capital are not guaranteed.
QUAL is indexed to a MSCI index. QUAL is not sponsored, endorsed or promoted by MSCI, and MSCI bears no liability with respect to QUAL or the MSCI Index. The PDS contains a more detailed description of the limited relationship MSCI has with VanEck and QUAL


