Quality investing in market turbulence
In turbulent markets, investors turn to quality companies. Learn how the ‘flight to quality’ has played out and what it means for investors building portfolios.
The Japanese have a word, ikigai, which is a concept meaning ‘reason for being’; similarly, the French phrase ‘raison d'être’ also translates to ‘reason for being’.
The quality factor exists as a smart beta approach, and savvy investors have employed it over time and varying market cycles, particularly in markets such as the one we are currently experiencing.
Hence the saying ‘flight to quality’, it is the quality factor’s ‘raison d'être’, or its ikigai.
The protectionist policy announced by President Trump on ‘Liberation Day’ had an immediate impact on markets.
Chart 1: Tariffs are not new, the scale is: The US’ average tariff rate on the world if fully implemented
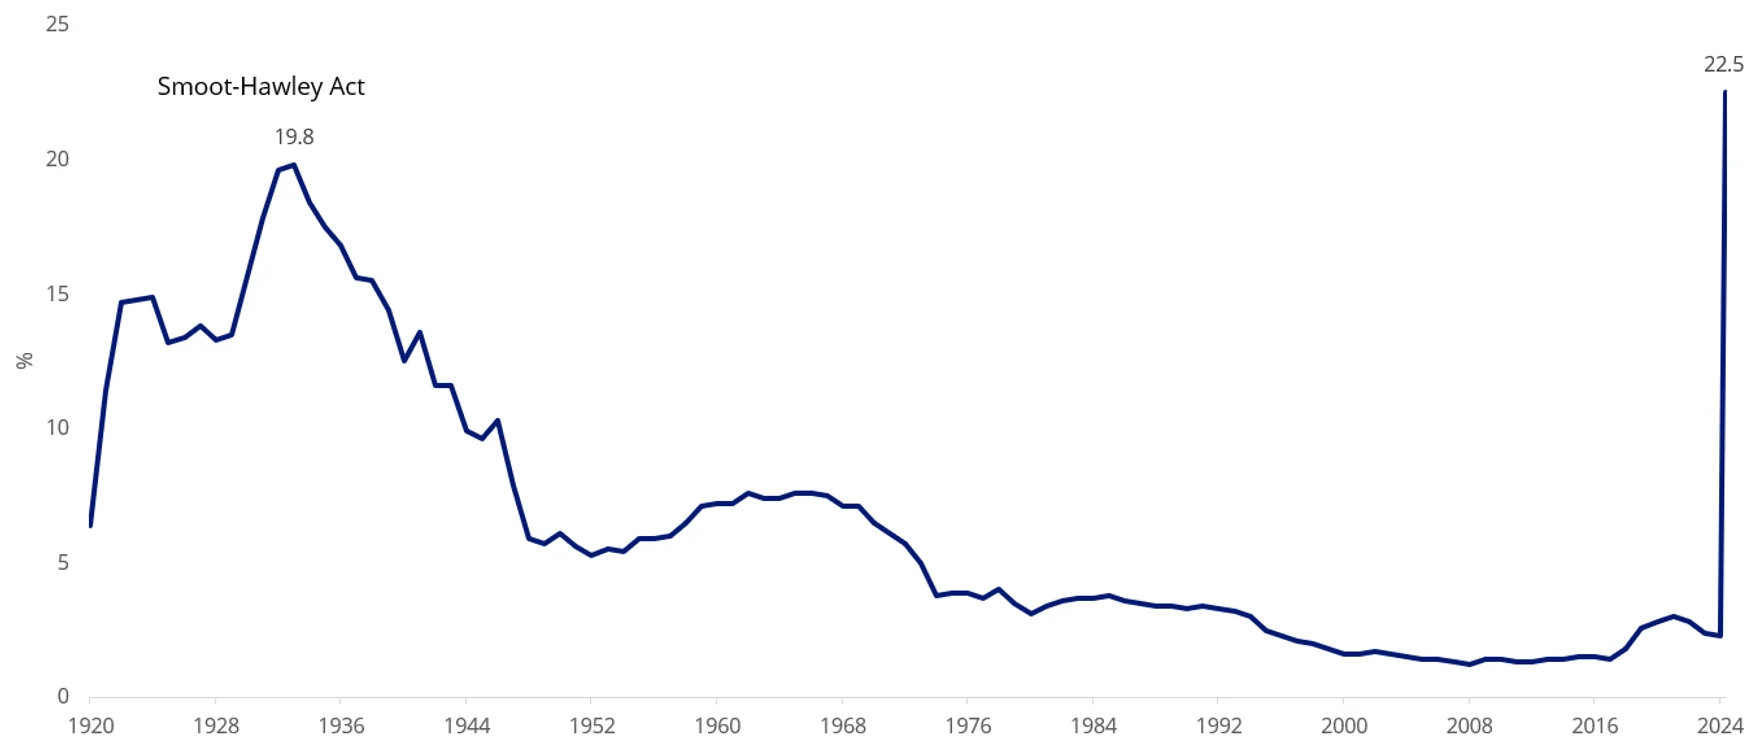
Source: Bloomberg
A little over a quarter ago, at the end of 2024, many investors were questioning their previously held assumptions as market confidence steamed ahead. The US was priced to perfection, and it was hard to see what would derail the train. In our recent ViewPointTM we noted, “Last quarter, we mused that nothing short of a bond market riot would take the wind out of investor sails, at least until Inauguration Day. In the end, something resembling a minor bond market riot got underway before President Trump’s inauguration. A few weeks after that, equities got the message.
“The message had two parts: Trump means what he says, and, given that, it isn’t wise to own things priced to perfection in the face of such uncertainty. Now, markets have got caught up in the noise of announcements. They are wavering back and forth between hope and fear.”
Since we wrote that, Trump’s tariffs have been announced and some have been paused, and volatility spiked to levels not seen since COVID lockdowns.
Chart 2: Market Volatility Index
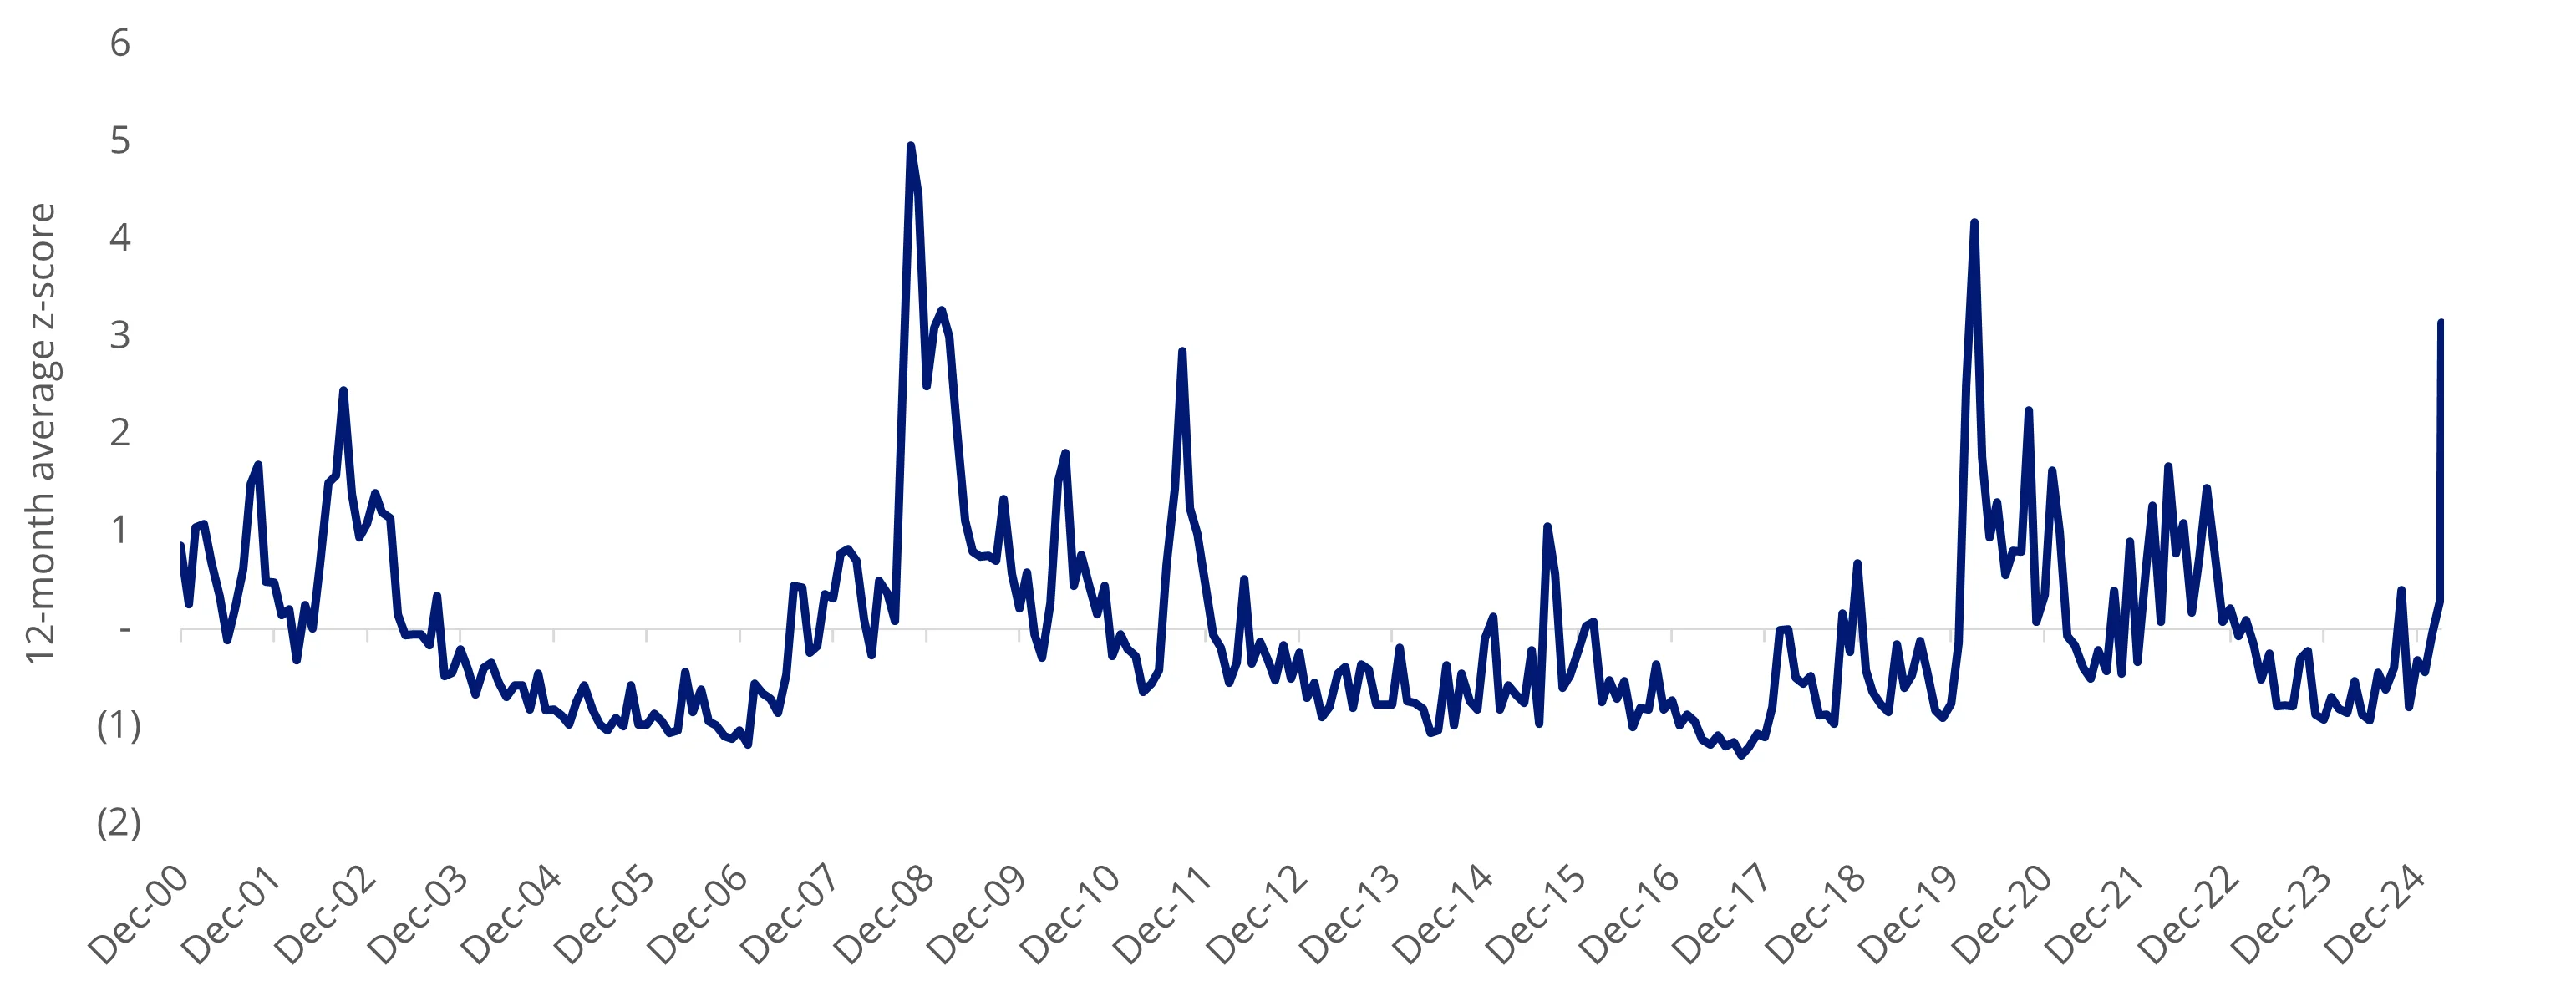
Source: Bloomberg. Data as at 6 April 2025. Index is VIX Index.
It’s worth noting that when spikes of the magnitude experienced earlier this month occur, volatility rarely dissipates immediately; rather, it typically takes years for it to ease. We think that will be the case this time. This is because, while the outcome of the trade wars are not known, we do know that tariffs have the impact of raising prices, which in turn slows spending. An economic slowdown is predicted. In other words, we think we are headed for a period of equity market volatility, inflation and economic weakness.
The ‘flight to quality’
In the past, the quality factor has outperformed during periods of heightened volatility and periods of stagflation.
You may have heard the phrase ‘flight to quality’. This occurs when market risks are pronounced and investors choose quality over non-quality assets to manage the storm. Over the past 30 years, you can see flights to quality in action. The index that VanEck MSCI International Quality ETF (QUAL) tracks, the MSCI World ex Australia Quality Index, has been calculated by MSCI back to 1994, so its history includes the volatility spikes of dotcom, the GFC and the recent COVID crisis. In the chart below, when the dark blue line is rising, quality is outperforming. You can see that in each of the previous times the volatility index (VIX) has spiked significantly, quality has outperformed. It has also outperformed since Liberation Day.
Chart 3: Outperformance in times of volatility - global quality equities versus equity market volatility
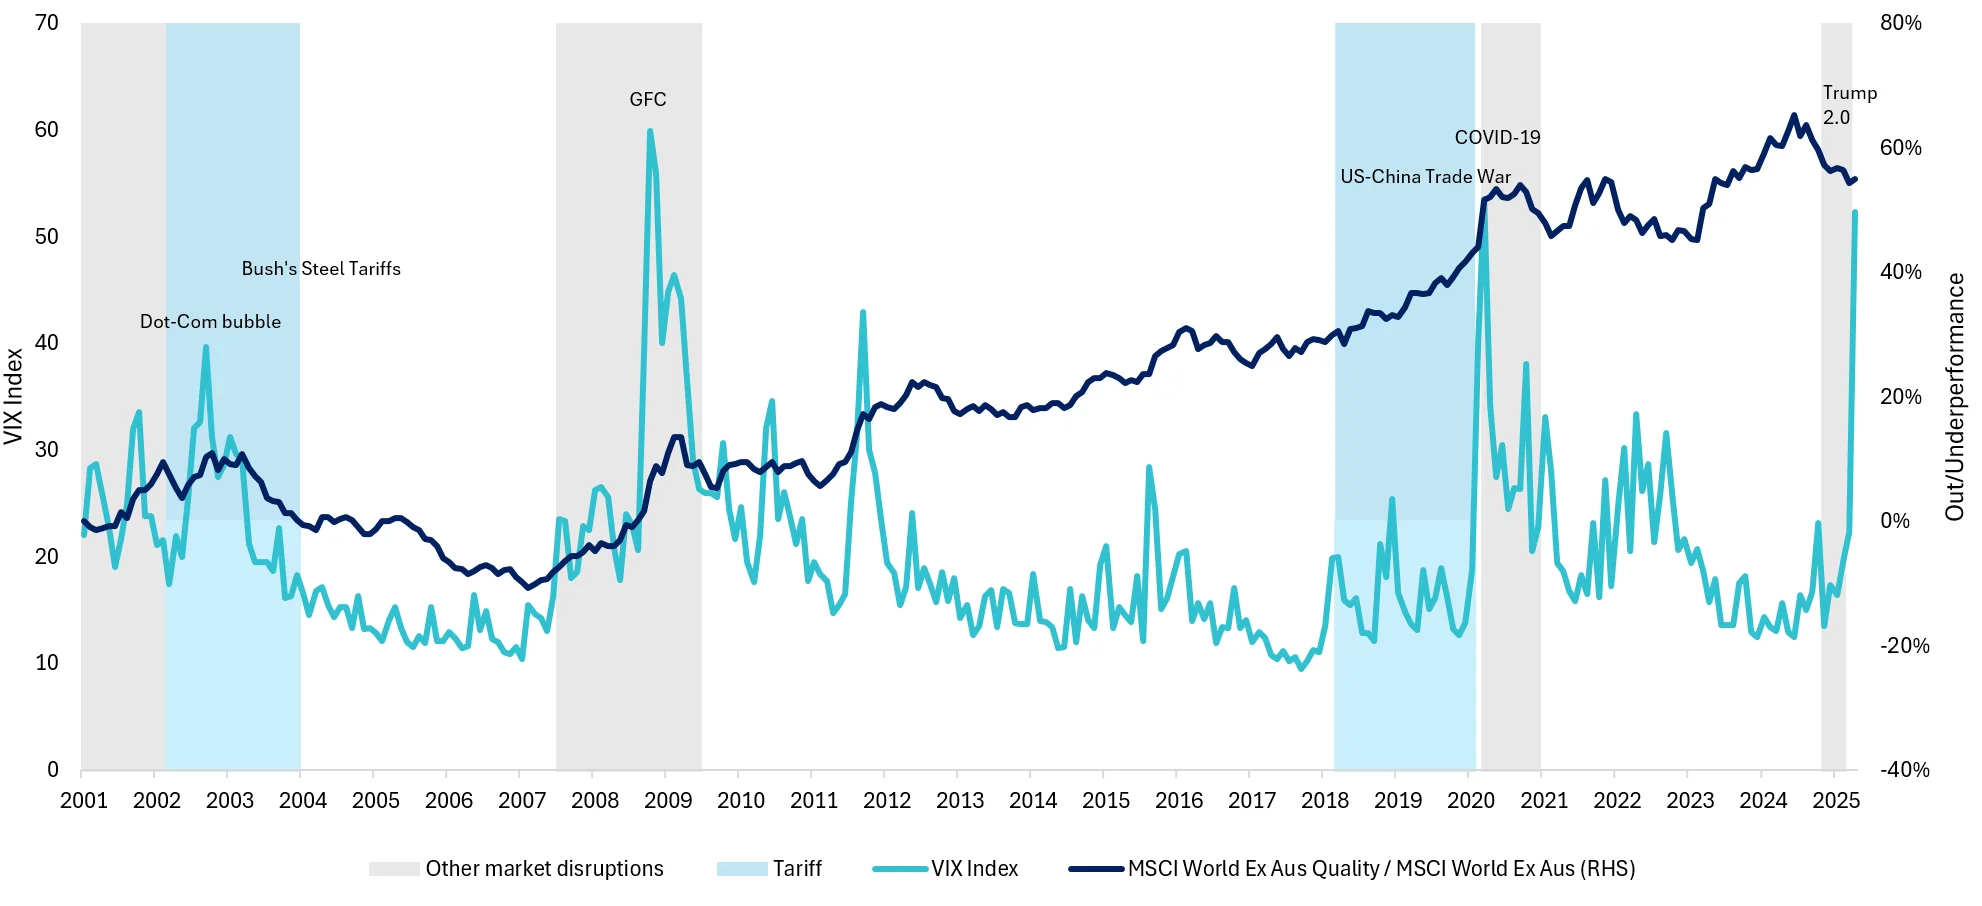
Source: VanEck Australia, Bloomberg. Performance in AUD. Past performance is not a reliable indicator of future performance. Index performance is not illustrative of fund performance.
The market capitulations in 2000, 2008-2009 and 2020 were followed by economic slowdowns with recessions following each of these stock market falls.
While not every pundit is calling a recession following Trump’s tariffs announcements and subsequent 90-day reprieve, a slowdown may be the base case.
Chart 4: Recession risk - US Recession Probability Forecast (%)
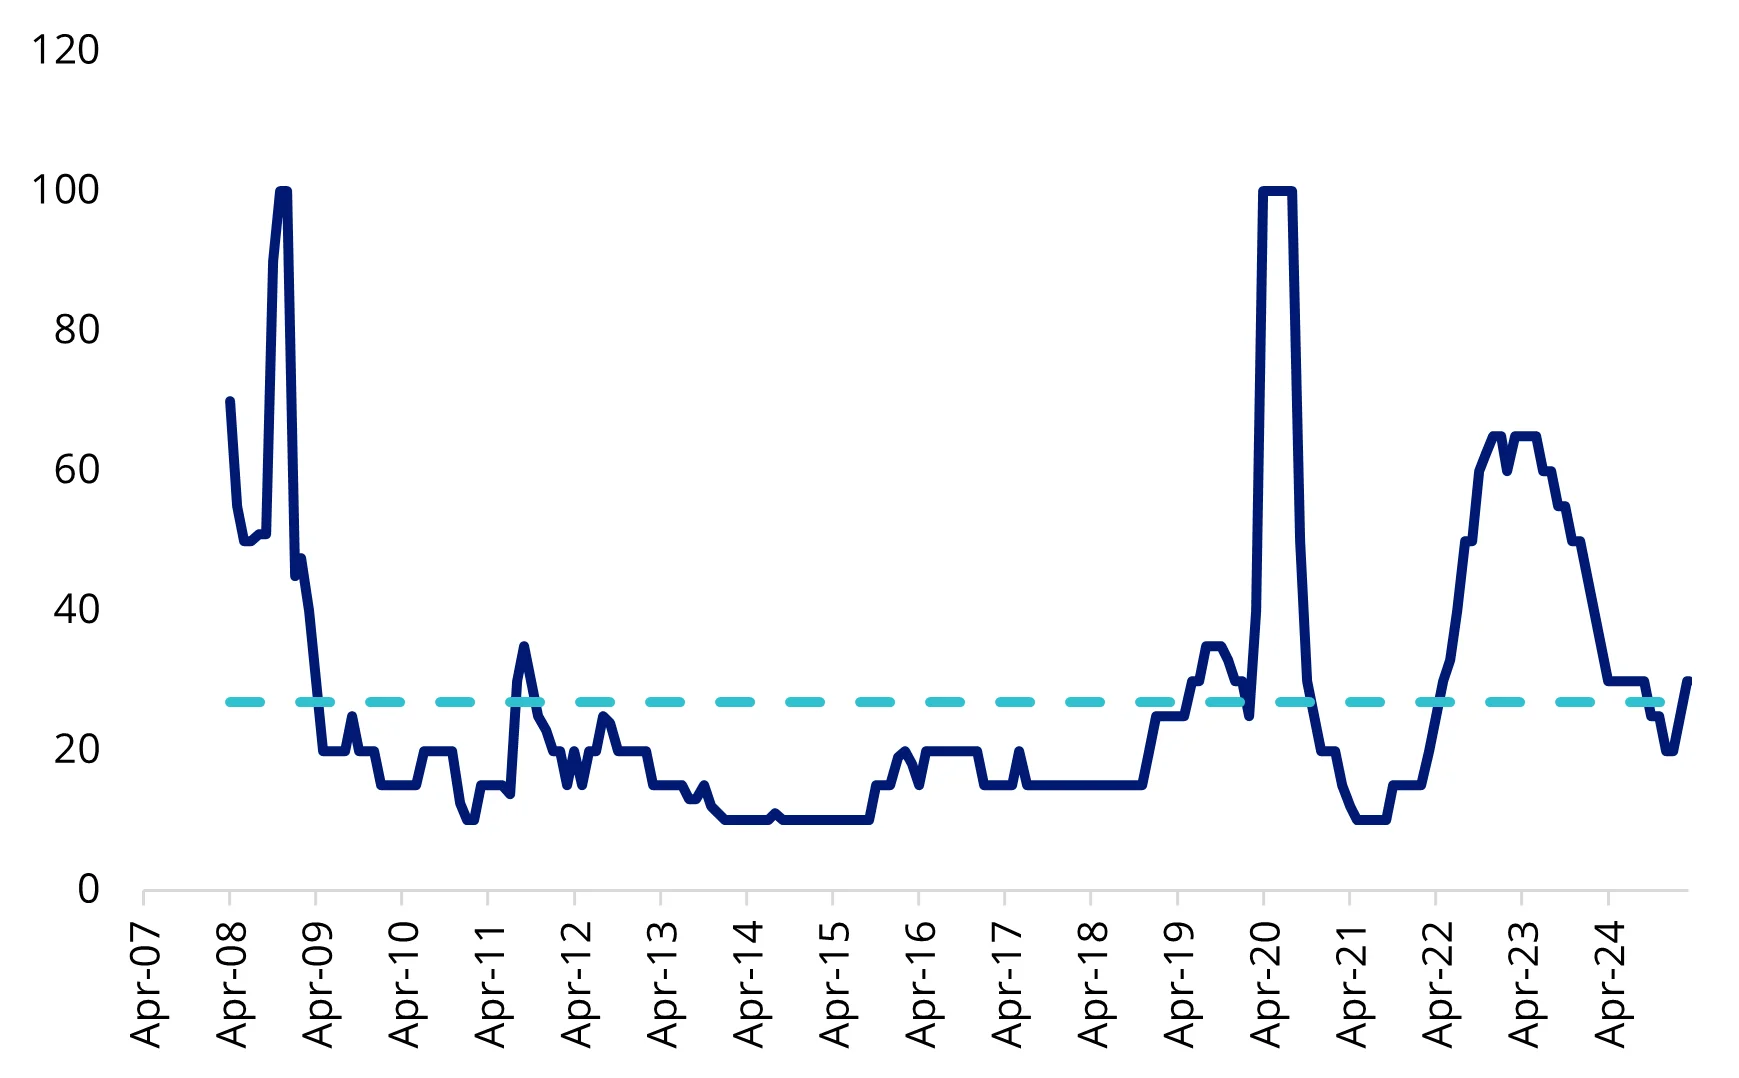
Source: Bloomberg
Historically, quality companies have lost less and recovered faster during periods associated with market falls and deteriorating economic conditions. In the table below, we have highlighted the dot-com bubble, GFC and the COVID-19 market meltdown. In all these episodes, quality international companies lost less and recovered faster. The table below compares the drawdowns of the MSCI World ex Australia Quality Index, versus the market benchmark, MSCI World ex Australia Index.
Table 1: Significant drawdowns events, 2000 to 2024
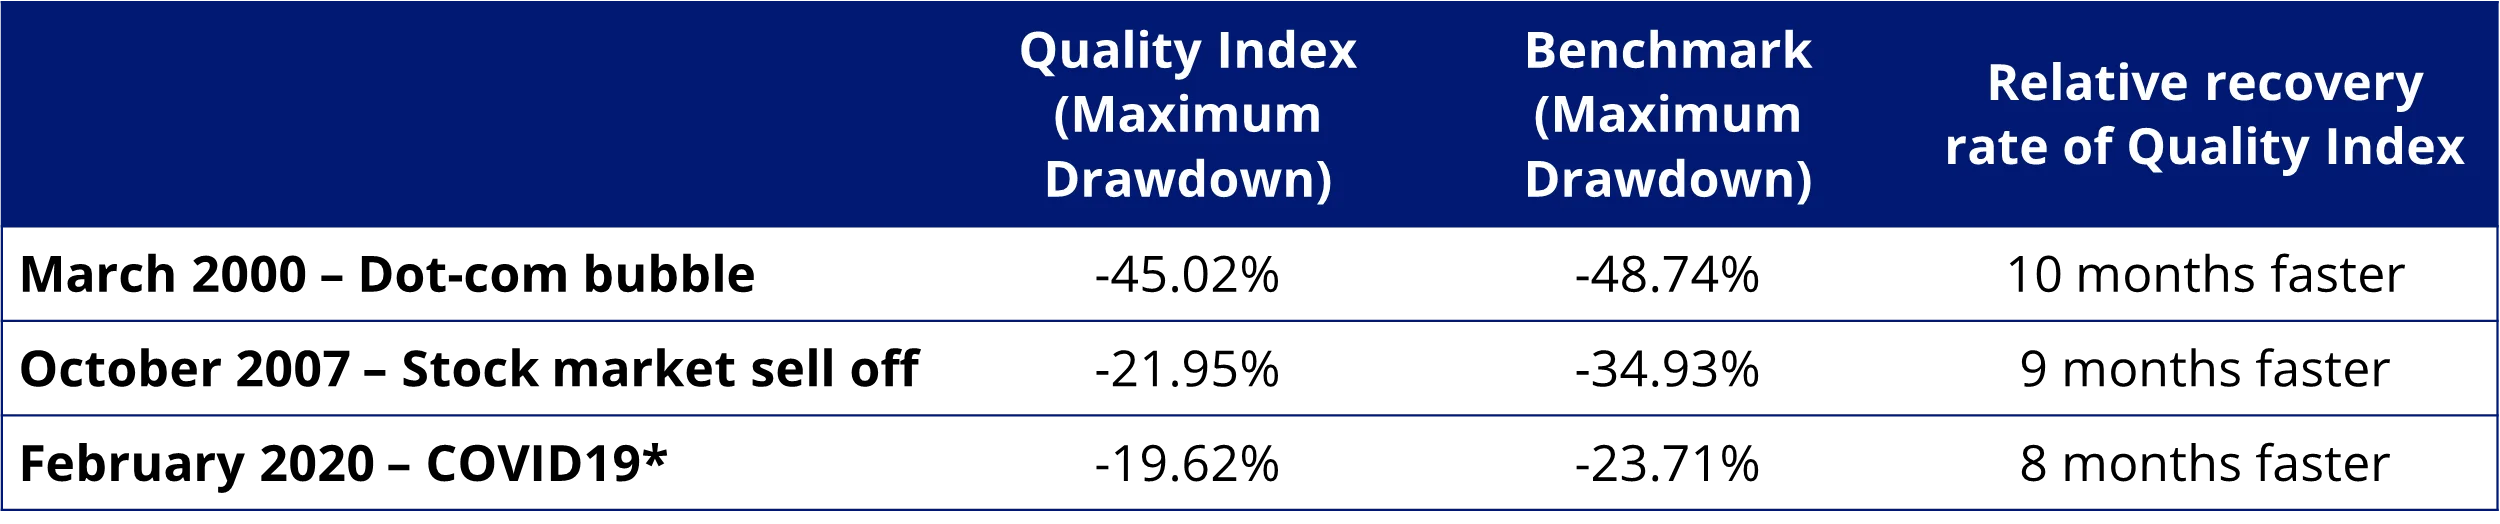
Source: MSCI, VanEck, Morningstar Direct. Comparison of drawdown between the MSCI World ex Australia Quality Index (‘Quality Index’) versus the MSCI World ex Australia Index (‘Benchmark’). Maximum drawdown is the peak to trough decline from the start of the month specified to the recovery date, expressed as a percentage. The rate of recovery is the number of periods taken to recover from the trough to peak incline. The calculations for the above include the reinvestment of all dividends but do not include fees and other costs associated with an investment in QUAL. You cannot invest in an index. Past performance is not a reliable indicator of future performance of the index or QUAL.
During the recent episode, some markets such as NASDAQ fell so far as to be in bear market territory. A bear market is generally accepted to describe market falls more than 20%. While the S&P 500 didn’t reach that nadir, it’s worth remembering that the US share market index has experienced 27 bear markets since 1928. The average length of the past bear markets was 289 days (9.5 months), with an average decline of about 36%. The longest was in 1973-74, which lasted 630 days.
Now, if we compare these to the subsequent bull markets. Bull markets tend to be longer, averaging 991 days (33 months). Looking at the last 26 bull markets, the average rise of the share market during a bull market is 114% and the longest was almost 11 years, from 2009 until the COVID-19 crisis.
It’s little wonder, then, why savvy investors are looking for opportunities.
If the global economy falters and we enter a recession, it could benefit quality companies, as they tend to offer investors relative protection during weaker economic environments and heightened market volatility.
A portfolio for all seasons
We recently wrote a whitepaper which analysed the performance of the quality factor alongside five other identifiable factors (momentum, minimum volatility, high dividend, size [equal weight], and enhanced value) during four identifiable regimes of the economic cycle (recovery, expansion, slowdown and contraction).
The following table of performance, split by each economic regime, was presented. The quality factor had outperformed in past recoveries, slowdowns and contractions.
Table 2: MSCI World and factor index performance since January 1999 (p.a.)

Source: Bloomberg, MSCI, 1 January 1999 to 31 January 2025. Figures are annualised. Quality is MSCI World Quality Index, Momentum is MSCI World Momentum Index, Minimum Volatility is MSCI World Minimum Volatility Index, High Yield is MSCI World High Dividend Yield Index, Equal weight is MSCI World Equal Weight Index, Enhanced value is MSCI World Enhanced Value Index. You cannot invest in an index. Past performance is not a reliable indicator of future performance.
During the most common economic environment, expansions, enhanced value and momentum performed best.
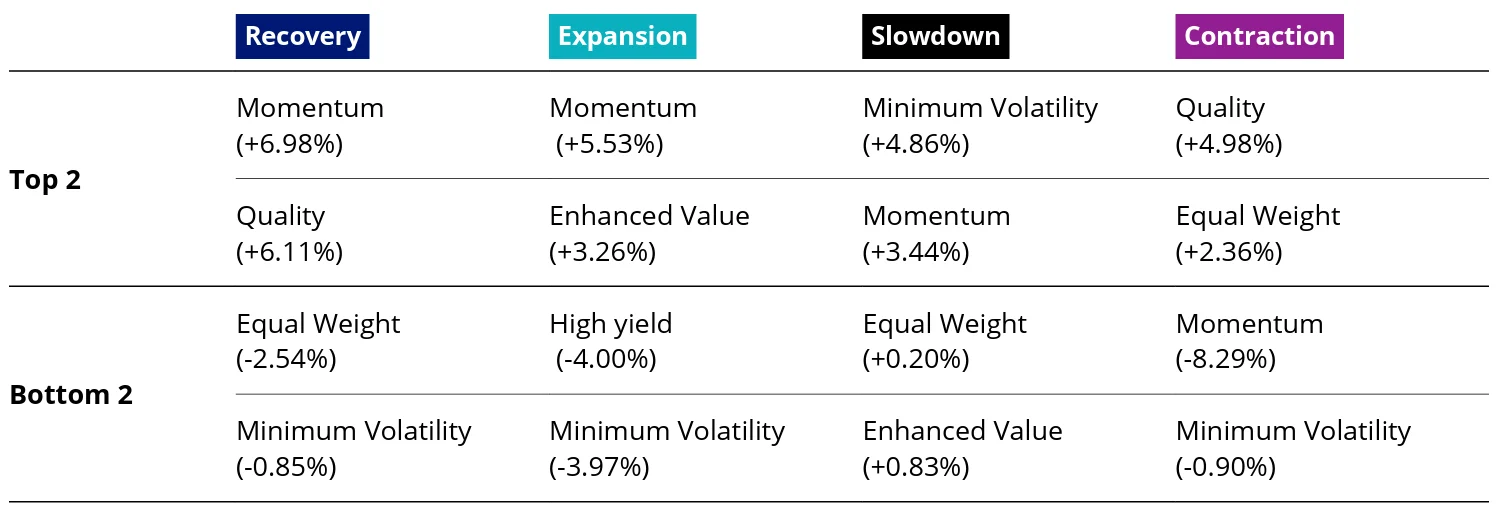
Over all four economic regimes, quality is the only factor that does not appear in the bottom two in the table below.
Table 3: Summarises the results by top and bottom factors (relative outperformance to MSCI World Index in brackets, p.a.)
Source: Bloomberg, MSCI, 1 January 1999 to 31 January 2025. Figures are annualised. Quality is MSCI World Quality Index, Momentum is MSCI World Momentum Index, Minimum Volatility is MSCI World Minimum Volatility Index, High Yield is MSCI World High Dividend Yield Index, Equal weight is MSCI World Equal Weight Index, Enhanced value is MSCI World Enhanced Value Index. You cannot invest in an index. Past performance is not a reliable indicator of future performance.
Momentum appears three times in the top two but also takes the winning spot (on an absolute basis) with its -8.29% p.a. underperformance during contractions. Maybe this would be better described as the losing spot; either way, it highlights the volatility of the momentum factor.
Quality is the only other factor that appears in the top two more than once. The two periods when quality was not in the top two were slowdowns and expansions. It outperformed by more than 2% p.a. during slowdowns. Its relative underperformance during expansion is dwarfed by its strong relative performance during the other three economic regimes, as evidenced by its outperformance of the MSCI World Index since 1999.
We think the results highlight the prudence of including a quality approach for international equities. While we describe it as the factor for all seasons, during expansions, when the quality factor isn’t as strong as other factors (such as the six or so months before Liberation Day) investors may want to consider blending quality with an enhanced value approach. An enhanced value approach has tended to do well during recoveries and expansions.
Chart 5: Uncorrelated outperformance
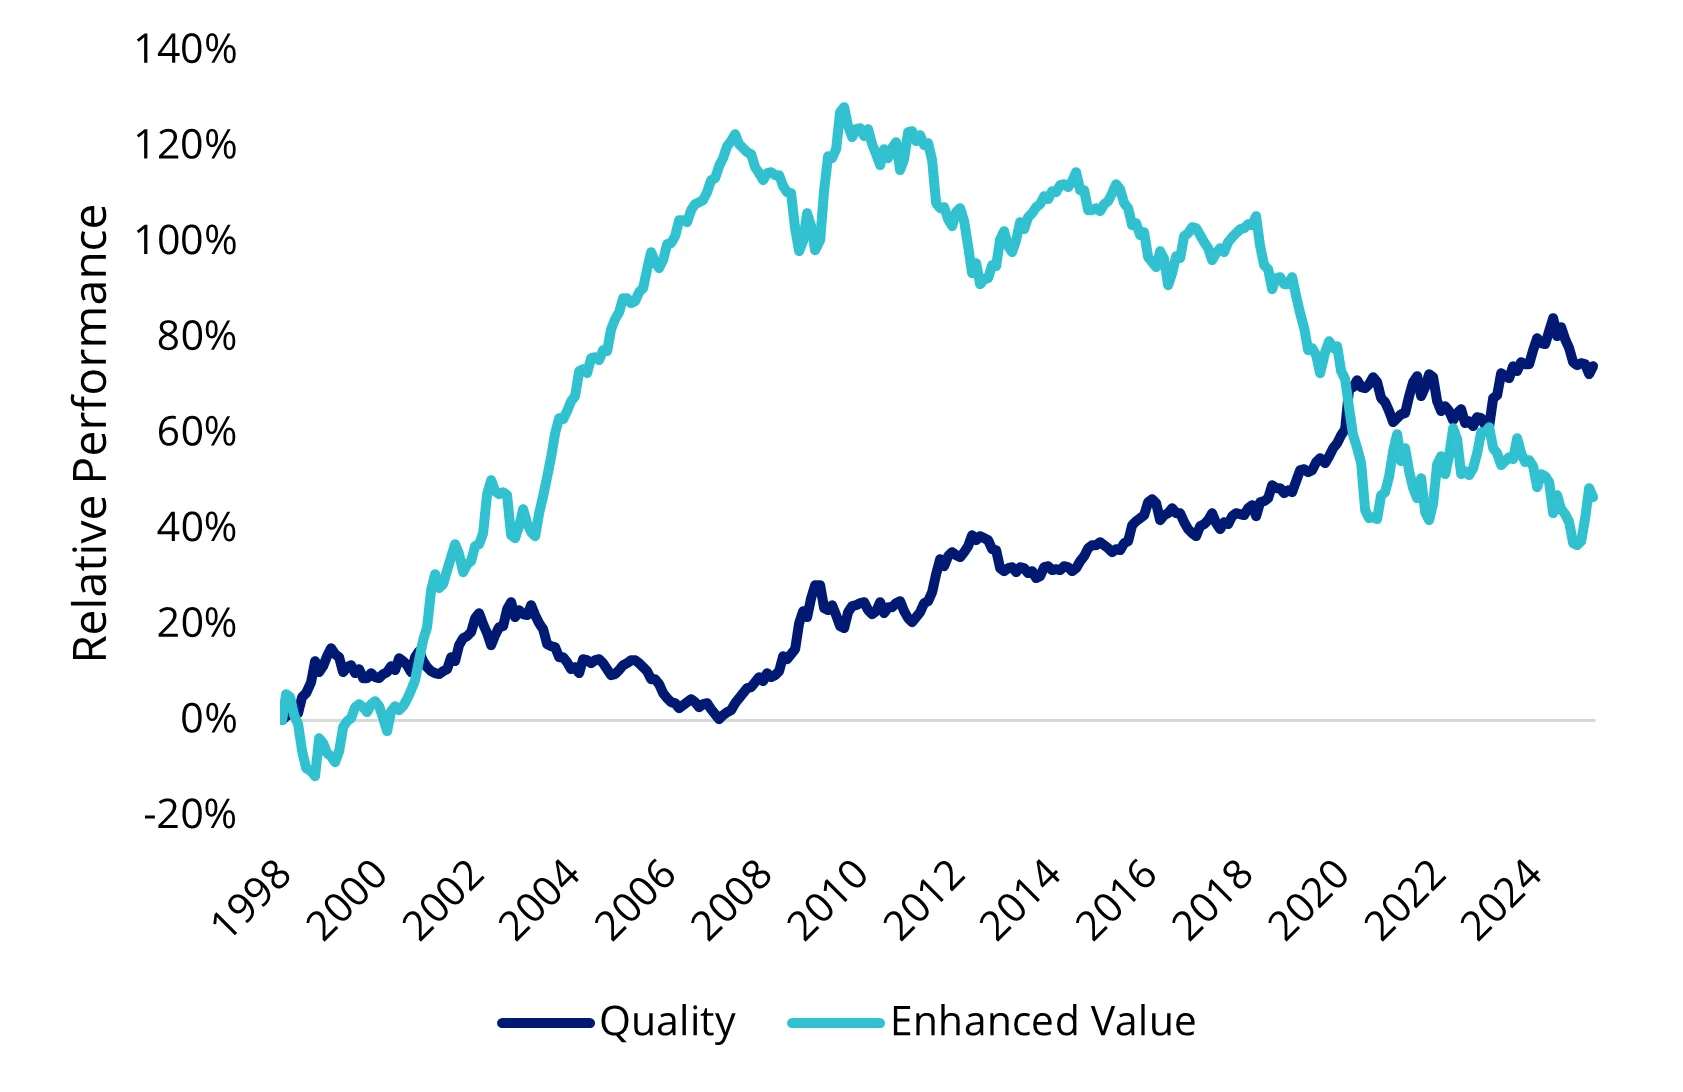
Chart 6: Quality versus Enhanced Value active return correlation
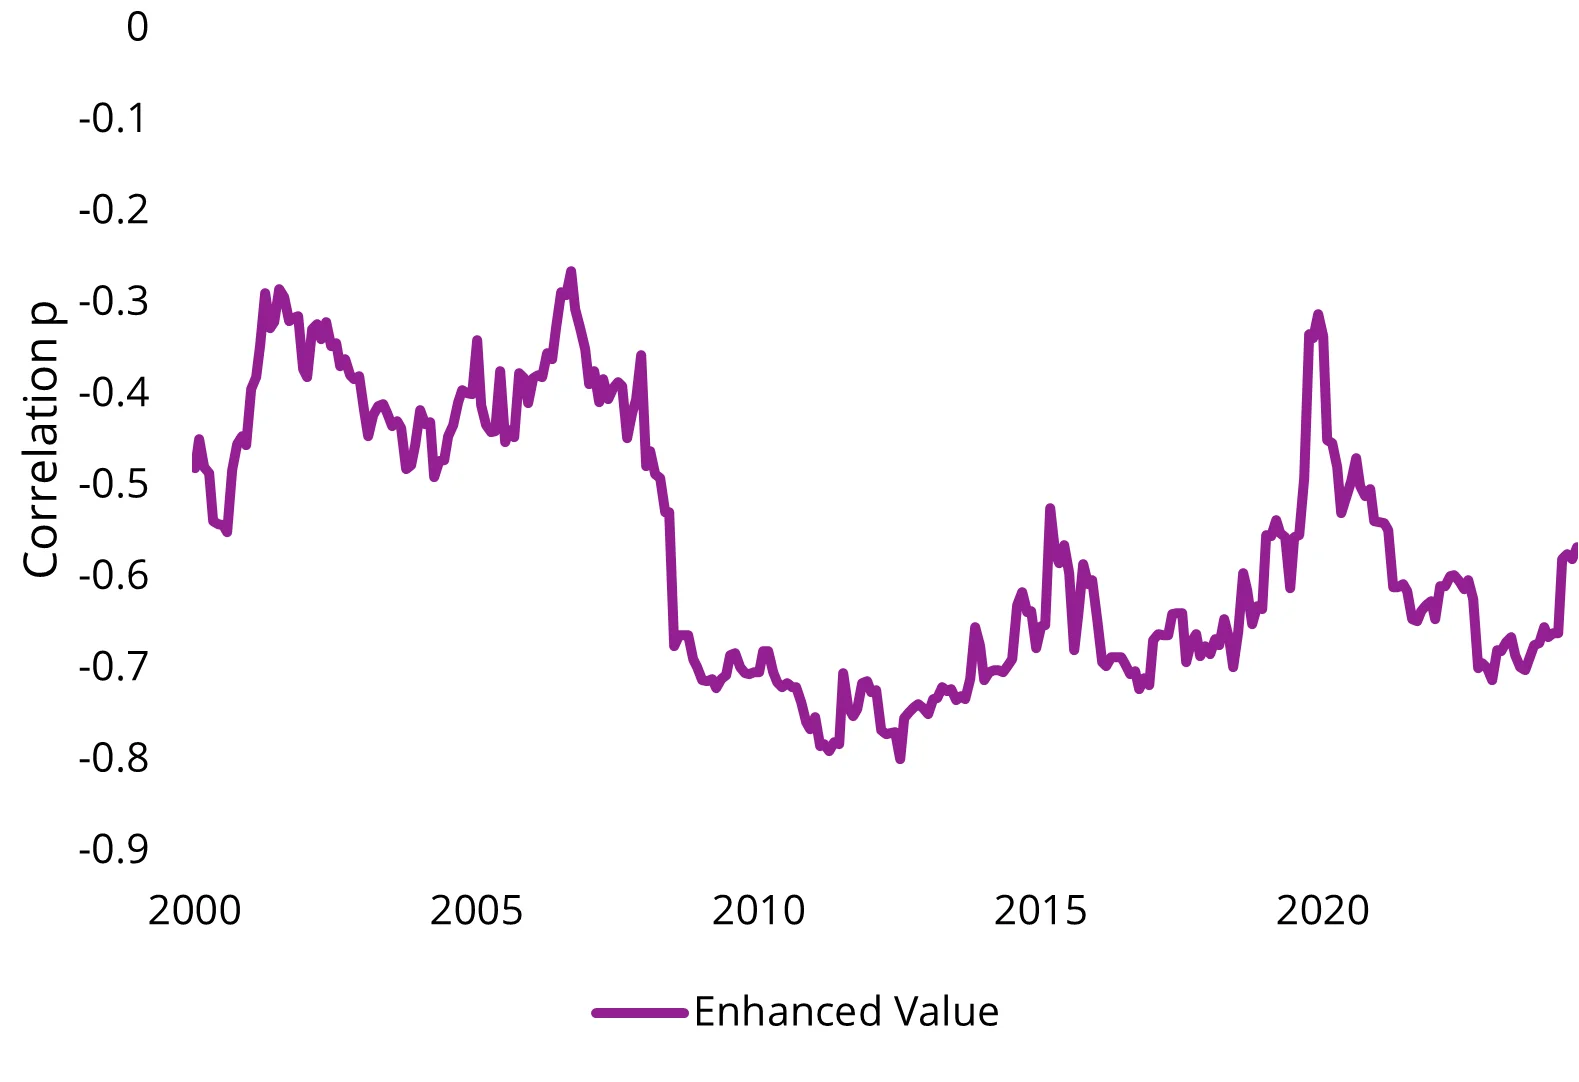
Charts 5 and 6: Source: MSCI, Bloomberg. Quality is the MSCI World Quality Index, Enhanced Value is the MSCI World Enhanced Value Index.
QUAL has delivered long-term outperformance
As noted above, QUAL has delivered on its raison d'être this month, outperforming the MSCI World ex Australia Index by 0.59%. Since its inception on 29 October 2014, QUAL has returned 15.19% p.a., outstripping the MSCI World ex Australia Index, by 2.35% p.a. As always past performance is not a reliable indicator of future performance.
Table 4: QUAL Performance to 15 April 2025
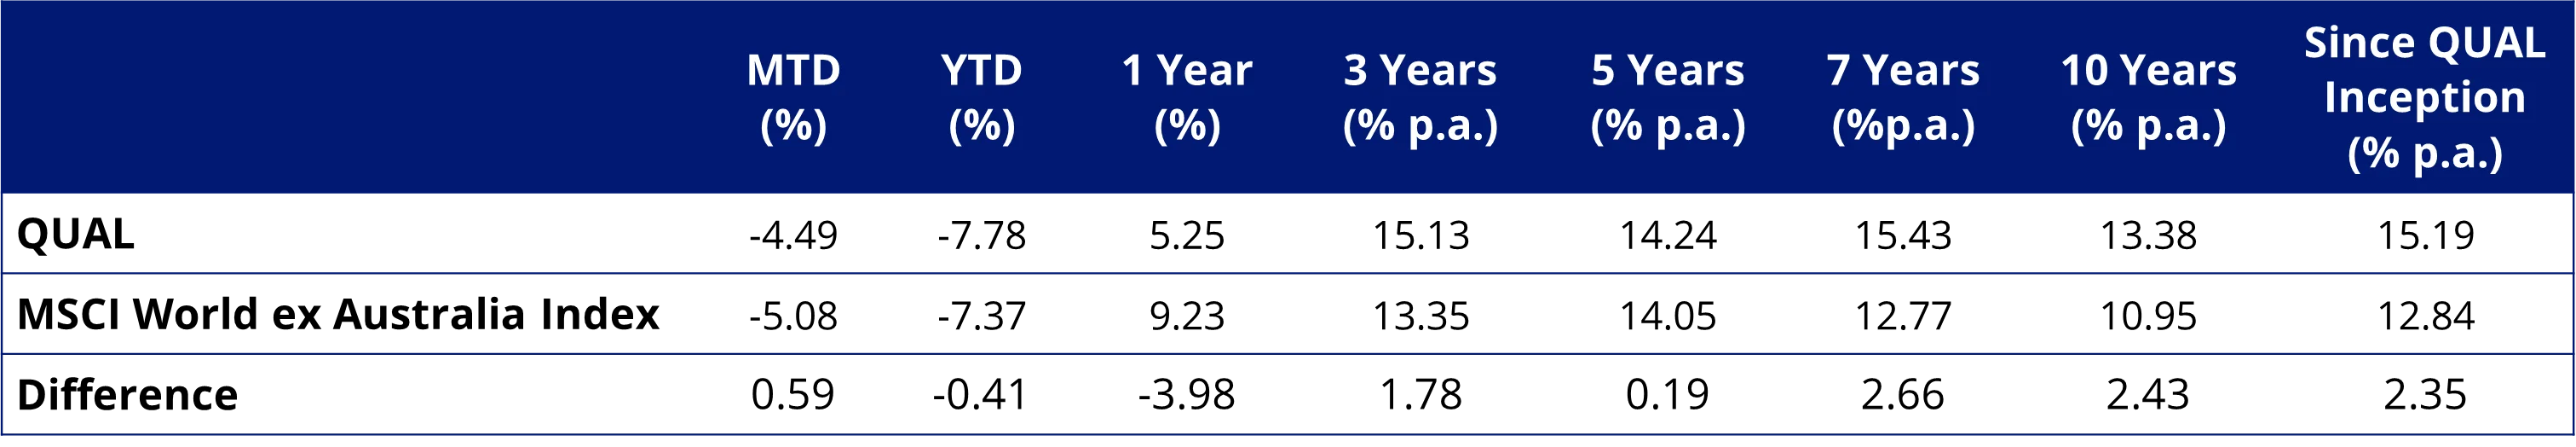
*Inception date is 29 October 2014.
Source: Morningstar Direct, VanEck. The chart above shows past performance of QUAL and of the MSCI World ex Australia Index. You cannot invest directly in an index. Results are calculated to the last business day of the month and assume immediate reinvestment of distributions. QUAL results are net of management fees and other costs incurred in the fund, but before brokerage fees and bid/ask spreads incurred when investors buy/sell on the ASX. Returns for periods longer than one year are annualised. Past performance is not a reliable indicator of future performance. The MSCI World ex Australia Index (“MSCI World ex Aus”) is shown for comparison purposes as it is the widely recognised benchmark used to measure the performance of developed market large- and mid-cap companies, weighted by market capitalisation. QUAL’s index measures the performance of 300 companies selected from MSCI World ex Aus based on MSCI quality scores, weighted by market cap x quality score at rebalance. Consequently QUAL’s index has fewer companies and different country and industry allocations than MSCI World ex Aus.
To prepare for the next cycle and capture international quality with one trade on the ASX, QUAL provides exposure to ~300 quality companies across geographies and sectors.
Furthermore, with QHAL, the Australian dollar hedged version of QUAL, investors can also manage their desired currency exposure.
Key risks: An investment in the QUAL and QHAL carries risks associated with ASX trading time differences, financial markets generally, individual company management, industry sectors, foreign currency, currency hedging, country or sector concentration, political, regulatory and tax risks, fund operations and tracking an index. See the PDS for details


Published: 17 April 2025
Any views expressed are opinions of the author at the time of writing and is not a recommendation to act.
VanEck Investments Limited (ACN 146 596 116 AFSL 416755) (VanEck) is the issuer and responsible entity of all VanEck exchange traded funds (Funds) trading on the ASX. This information is general in nature and not personal advice, it does not take into account any person’s financial objectives, situation or needs. The product disclosure statement (PDS) and the target market determination (TMD) for all Funds are available at vaneck.com.au. You should consider whether or not an investment in any Fund is appropriate for you. Investments in a Fund involve risks associated with financial markets. These risks vary depending on a Fund’s investment objective. Refer to the applicable PDS and TMD for more details on risks. Investment returns and capital are not guaranteed.
QUAL is indexed to a MSCI index. QUAL is not sponsored, endorsed or promoted by MSCI, and MSCI bears no liability with respect to QUAL or the MSCI Index. The PDS contains a more detailed description of the limited relationship MSCI has with VanEck and QUAL.