US absent the World Cup but winning in portfolios
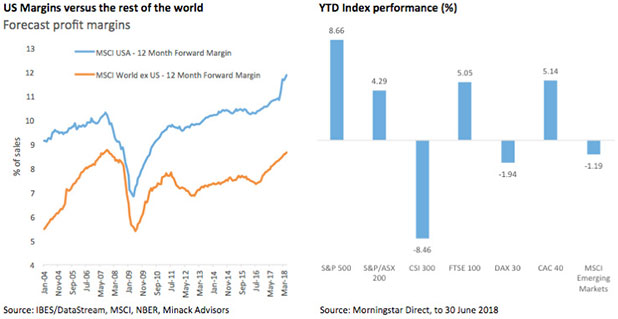
US equities have handsomely outperformed other markets since 2010. This has largely been an earnings story. The principal reason why earnings increased faster in the US than elsewhere was because US companies restored their margins quicker after the GFC.
Chart 1 below shows the US forecast margins recovered to their pre-GFC level by 2014, while margins outside the US were still well below prior peaks. More recently the chart shows expectations for US margins rose sharply again after the Trump tax cuts.
Importantly, forecast margins have continued to be revised higher even after taking account of the corporate tax cuts.
US economy is “great again”, although uncertainty looms
Fed chair Jerome Powell has flagged that the solid US economy supports Fed rate increases. Labour market tightness, inflation close to target, strong growth and confident households and businesses contribute to this view. Although the economic narrative is strong fiery trade rhetoric, strengthening US$ and rising rates have increased uncertainty and brought back the return of volatility. Compared to 2017, this year is giving investors cause to pause and revisit their exposure to risk assets to ensure that they remain attractively priced and are quality.
VanEck Vectors Morningstar Wide Moat ETF (MOAT)
MOAT tracks the Morningstar Wide Moat Focus Index (MOAT Index) which includes at least 40 of the most attractively priced US stocks that Morningstar® considers have wide ‘economic moats™’. These are companies with structural competitive advantages and high barriers to entry that Morningstar believes will ensure consistent earnings for at least 20 years.
Combining quality with value
Morningstar’s team of over 100 equity analysts assign a fair value to each company in its coverage universe. Using a combination of the qualitative economic moat data and the quantitative fair value data, Morningstar constructs its moat indices. The MOAT Index is comprised of the most compelling US wide moat constituents that trade at the lowest price/fair value ratio.
Top 10 comparison
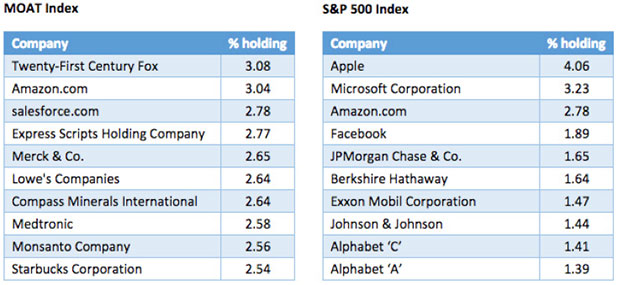
Source: Factset, 30 June 2018
A history of outperformance
The evidence of the long term success of Morningstar’s research is demonstrated by the long term performance of the MOAT Index
MOAT Index performance to 30 June 2018
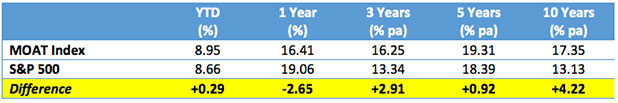
Source: Morningstar Direct, as at 30 June 2018. Performance is in Australian dollars. Results are calculated to the last business day of the month and assume immediate reinvestment of all dividends and exclude costs associated with investing in MOAT. You cannot invest directly in an index. Past performance is not a reliable indicator of future performance of the indices or MOAT.
VanEck Vectors Morningstar Wide Moat ETF (MOAT) tracks the MOAT Index. It is the only ETF in Australia that only includes US Wide Moat companies. MOAT offers clients the ability to capitalise on value US companies with a quality bias. The ETF is based in US dollars and is unhedged to the Australian dollar.


Published: 09 August 2018