A return to fundamental values
A quiet but meaningful shift is unfolding in global equities. The first two months of 2025 have seen a near-complete reversal in market leadership from last year, with European and Asian stocks outperforming, while US equities, though still attracting flows, are no longer the clear standout.
Stoxx 600: +10.4% YTD (vs. +2.2% in early 2024)
Hang Seng Index: +17.0% YTD (vs. -1.5% in early 2024)
S&P 500: +2.2% YTD (vs. +6.9% in early 2024)
Chart 1: Equity performance for the first two months of the year
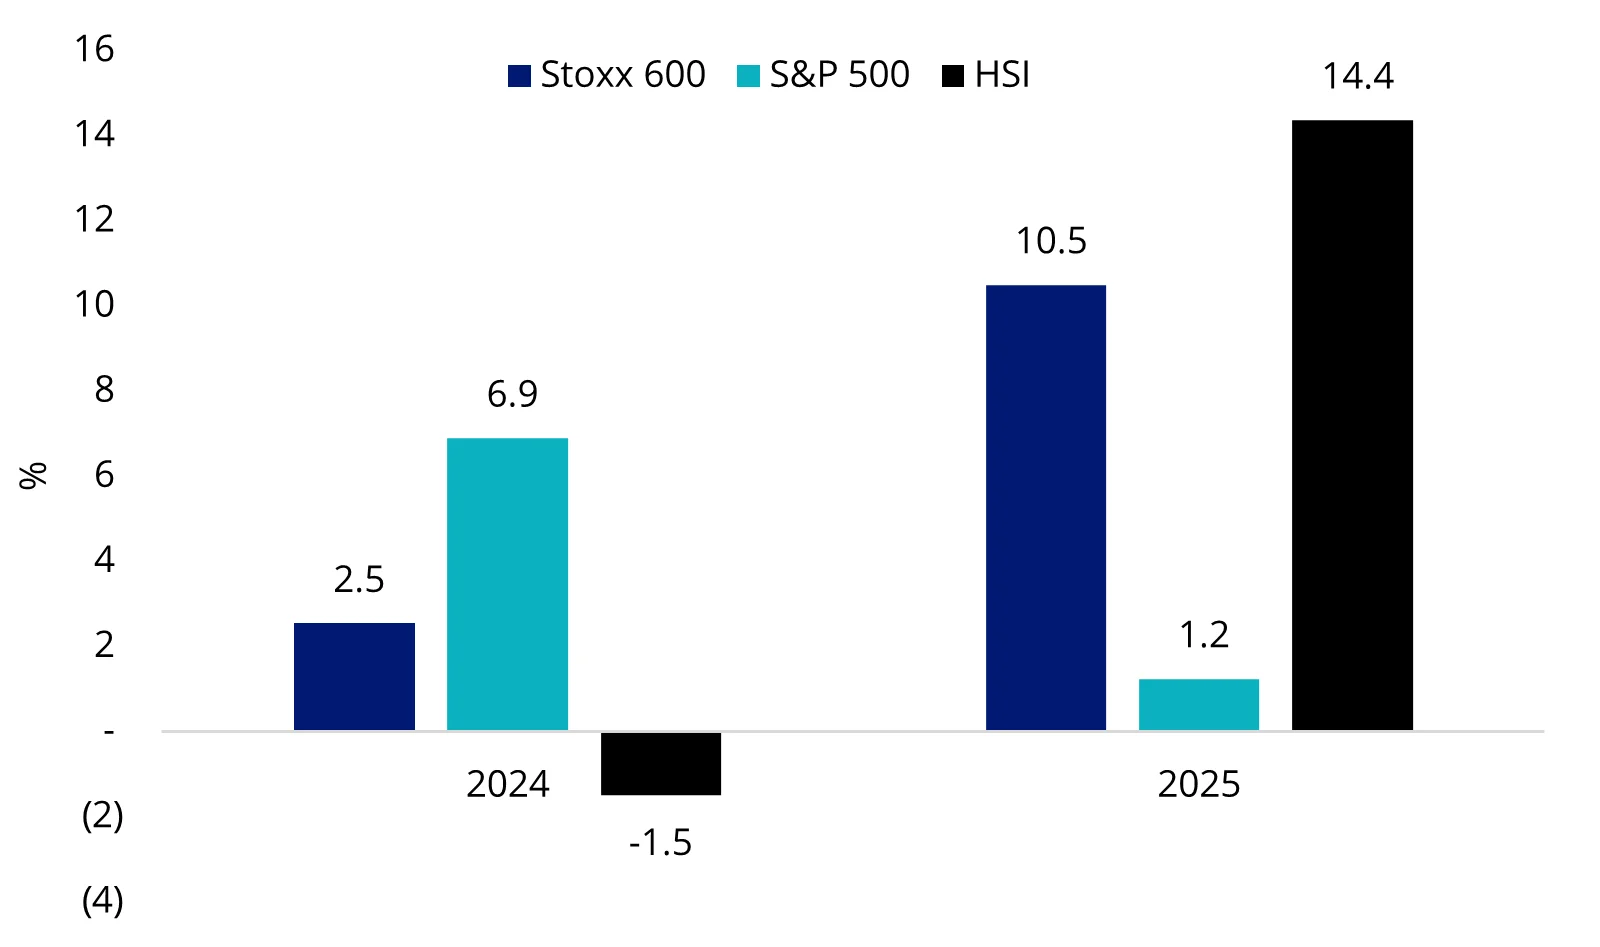
Source: Bloomberg, 2024 data to 28 February 2024. 2025 data to 28 February 2025. This is a short period of time, and past performance is not indicative of future performance. You cannot invest in an index.
This shift signals that a value rotation could be kicking off, and now is the time to position before it potentially becomes consensus. Investors are starting to move away from concentrated US mega-cap exposure toward more attractively valued international equities.
Factors driving a potential value rotation
Attractive valuations and earnings catch-up – The valuation gap between US growth stocks and international value names has widened to levels not seen since the early 2000s.
Chart 2: Valuation gap highest in the last 20 years
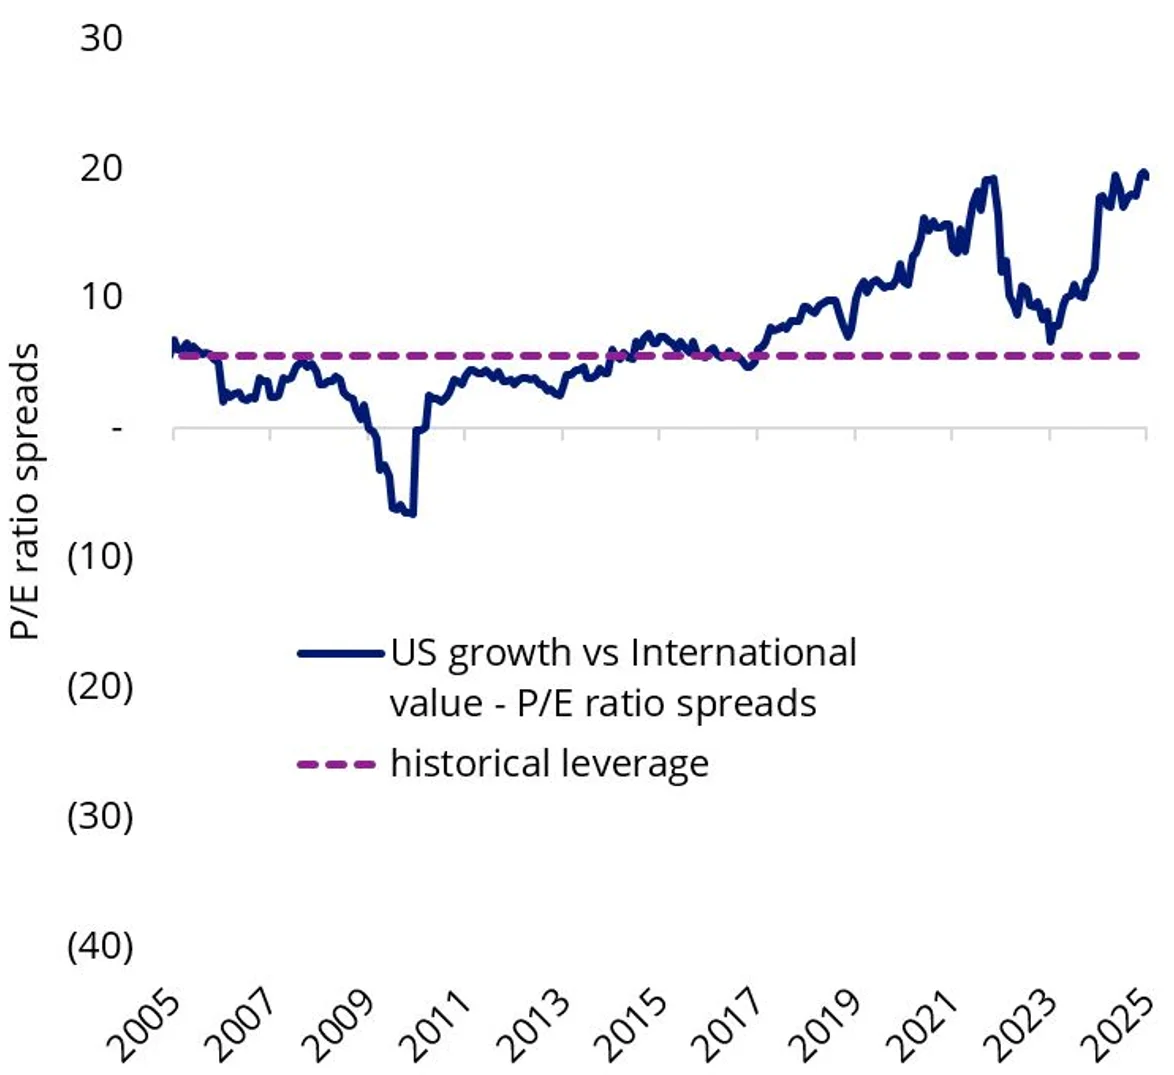
Source: VanEck, Bloomberg. Data as at 25 February 2025. US growth is represented by the S&P 500 Growth Index. International value is represented by MSCI World Value Index. You cannot invest in an index.
Meanwhile, earnings growth outside the US is accelerating, particularly in Europe and Japan, where companies have posted stronger revisions.
Economic recovery outside the US – The Eurozone and Japan have surprised to the upside with stronger-than-expected GDP growth, while China’s recent stimulus measures have fuelled a sharp rebound in equities. In contrast, US growth is moderating, making international markets more attractive.
Chart 3: Economic surprises outside the US
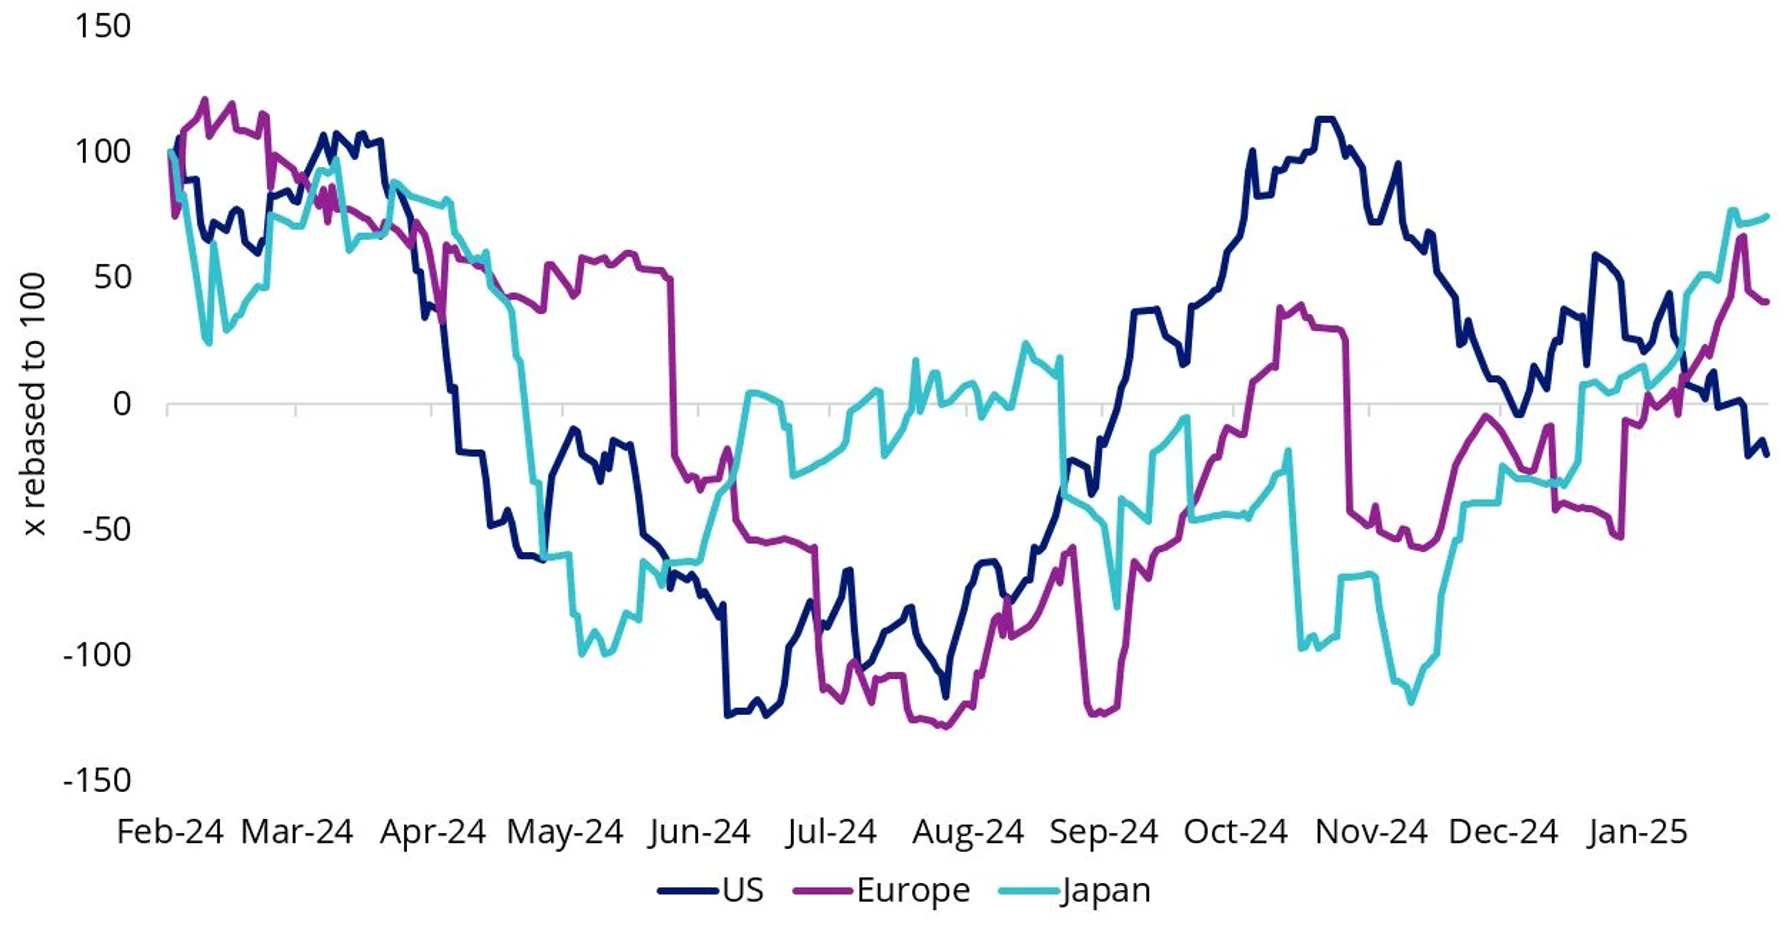
Source: VanEck, Bloomberg. Data as at 25 February 2025. US is represented by the Citi Economic Surprise Index - United States. Europe is represented by the Citi Economic Surprise Index - Eurozone. Japan is represented by Citi Economic Surprise Index - Japan.
Inflation fears and the rates environment – Since the Fed started cutting US rates in September last year, the US 10-year yield has shot up from its September nadir of around 3.60%, to as high as 4.80%. This rise reflected fears that inflation in the US may remain stubbornly higher due to the strength of the US economy and the potential impact of tariffs and other policies proposed by the Trump administration.
While the 10-year yield has dropped to below 4.30%, following a report showing that more US workers applied for unemployment benefits than economists had expected, we think the market is still wary. After the US Federal Reserve’s last meeting, in which rates were kept on hold, Chair Jerome Powell indicated that there would be no rush to cut rates again until inflation and jobs data made it appropriate to do so.
Chart 4: US 10-year treasury yields are higher since the Fed started cutting
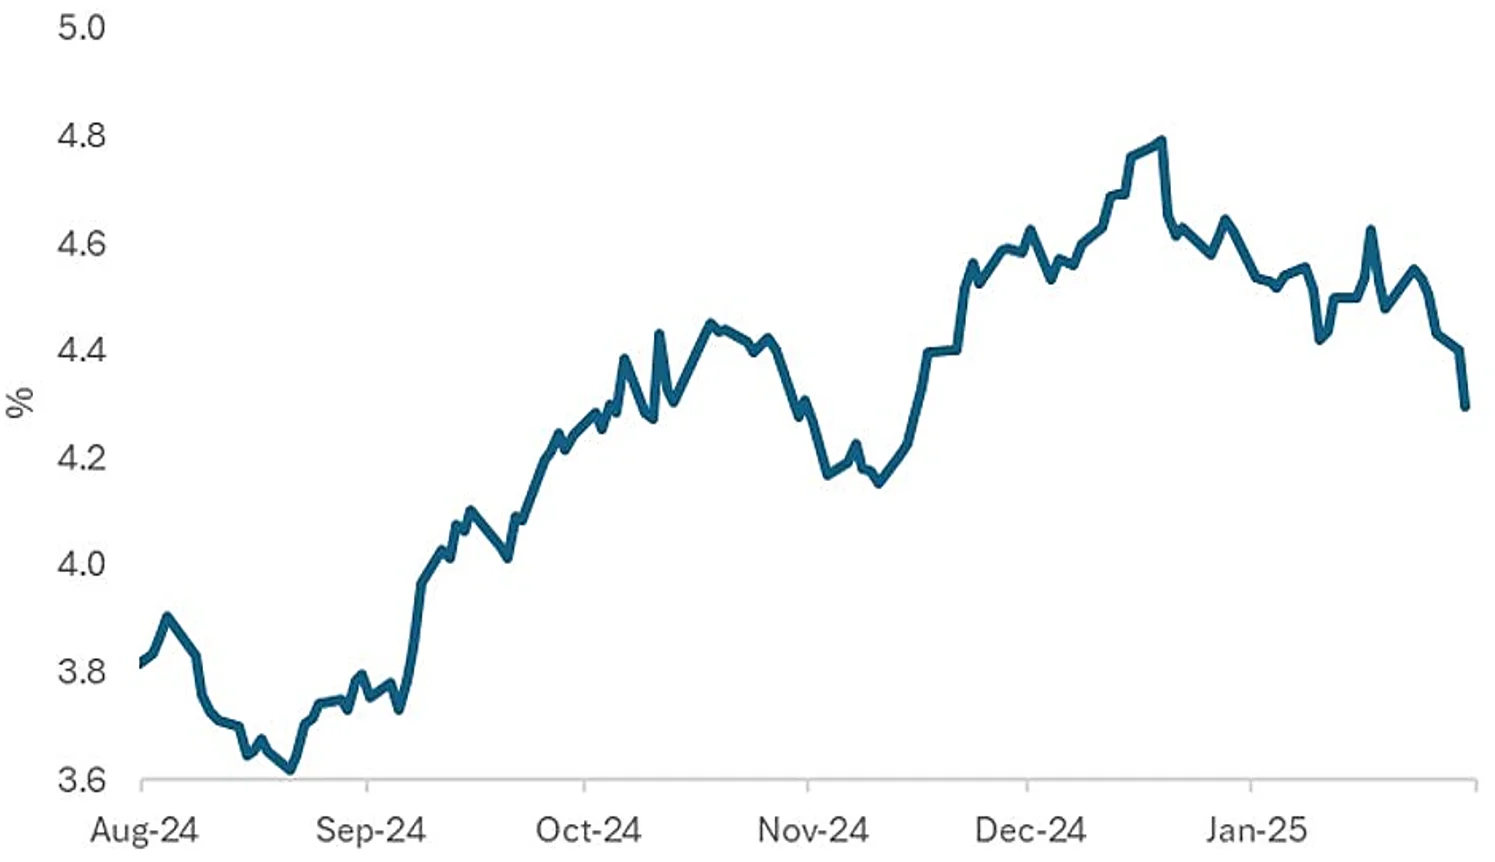
Source: Bloomberg, 25 February 2024.
Higher rates environments tend to have more of a negative impact on growth stocks than value stocks.
Many investors value stocks using a net present value (NPV) model. This is important in valuing high-growth stocks, which have little or no earnings yet, so investors assess expected earnings in the future. This means they discount projected earnings back to the present using a discount rate, typically the yield on 10-year US treasuries. Therefore, when this rate goes up, as it has, valuations go down.
In this environment, expensive stocks in areas like growing tech companies underperform the cheapest companies.
Market sentiment shift – The concentration in US tech stocks (Magnificent 7) has raised concerns about stretched valuations and limited upside. As a result, investors are reallocating toward international equities and value sectors that offer better long-term risk-reward.
There are growing signs that the conditions for a value rotation are falling into place, with early indications already showing in market performance. The best time to reposition is generally before the shift becomes consensus.
Access international equity value
Given this, investors seeking to tap the current trends may wish to consider the VanEck MSCI International Value ETF (VLUE) or its AUD hedged equivalent, HVLU.
As at 28 February 2025 the VanEck MSCI International Value ETF (ASX: VLUE) is up 6.34% so far in 2025 while the international benchmark, the MSCI World ex Australia Index, has returned 2.37% (as at 28 February 2025, source Morningstar Direct). As we would always say, past performance should not be relied upon for future performance. VLUE’s full performance is here.
Key risks
An investment in VLUE or HVLU carries risks associated with: ASX trading time differences, financial markets generally, individual company management, industry sectors, foreign currency (VLUE), currency hedging (HVLU) country or sector concentration, political, regulatory and tax risks, fund operations, liquidity and tracking an index. Read the PDS and respective TMD for more details.


Published: 04 March 2025
Any views expressed are opinions of the author at the time of writing and is not a recommendation to act.
VanEck Investments Limited (ACN 146 596 116 AFSL 416755) (VanEck) is the issuer and responsible entity of all VanEck exchange traded funds (Funds) trading on the ASX. This information is general in nature and not personal advice, it does not take into account any person’s financial objectives, situation or needs. The product disclosure statement (PDS) and the target market determination (TMD) for all Funds are available at vaneck.com.au. You should consider whether or not an investment in any Fund is appropriate for you. Investments in a Fund involve risks associated with financial markets. These risks vary depending on a Fund’s investment objective. Refer to the applicable PDS and TMD for more details on risks. Investment returns and capital are not guaranteed.VLUE and HVLU are not sponsored, endorsed, or promoted by MSCI, and MSCI bears no liability with respect to VLUE and HVLU, or Parent Index. The PDS contains a more detailed description of the limited relationship MSCI has with VanEck and VLUE and HVLU.