When Value investing becomes valuable again
It's worth remembering a low price alone does not indicate good value. Learn what makes a true value opportunity.
In recent months, Value has been a hot topic among international equity investors as ‘value’ companies outperformed ‘growth’ companies in the first quarter of 2025.
Value investing, like bargain hunting, is about buying companies trading at prices lower than their worth. This often means buying companies that are out of favour with investors. In some cases, these companies may have been oversold, and investors can make great returns when they return to their intrinsic value. The danger is that sometimes the market’s pessimism is justified due to poor financial prospects or poor management. These stocks can become ‘value’ traps, and avoiding them is also important.
First, let’s examine how a company’s ‘value’ is calculated. Many finance-related websites include valuation metrics, such as price-to-book value or price-to-earnings. These ratios have traditionally been used to measure value. Those companies with low metrics are considered ‘value’.
Economists Benjamin Graham and David Dodd recognised the concept of value in the 1920s. Their book Security Analysis (1934) and Graham’s later book The Intelligent Investor (1949) introduced investors to methods that helped identify ‘value’.
Graham and Dodd believed that a company’s true value could be determined based on its assets, future earnings, dividends and prospects. The lower the price of the company relative to this intrinsic value, the higher the ‘margin of safety’. Graham and Dodd developed a methodology to identify and buy securities priced well below their intrinsic value. Behind this concept of value investing is the belief that ‘cheaply’ valued assets tend to outperform more expensive stocks over a long horizon.
Over the very long term, this has proven to be true. One of the world’s most successful investors, Warren E. Buffett, got an A+ from Ben Graham at Columbia in 1951, and he has made his fortune since using the principles of Graham and Dodd's as the CEO and shareholder in Berkshire Hathaway Inc. Buffett has made a career identifying value when others have been selling.
A low price alone, however, does not indicate good value, and those who pursue low price alone can easily fall into ‘value traps,’ or “trying to catch a falling knife”. The possibility of these ‘value traps’ means investors must be aware of what to consider to avoid these potential pitfalls.
Earnings stability and dividends were two of the seven fundamental measures Graham cited in The Intelligent Investor to use when assessing a company’s value. These metrics represent what has happened in the company’s past. While backward-looking measures are important, investors are investing for a future benefit, so value investors should also consider a company’s potential, so forward earnings estimates could be a better guide.
By using forward earnings estimates, value investors can help mitigate the potential for investing in ‘value traps’, those companies whose valuation might appear favourable, but where earnings growth is low or negative, which would cause book value to stagnate.
Much of the world has changed since the time of Graham and Dodd, especially concerning company valuations. Today, investors also consider the value of intangible assets, which have become increasingly important. To overcome this, many value managers now emphasise enterprise value, a measure of the company’s total value (typically based on debt plus equity market cap less cash). It also serves as the basis for many financial ratios that measure a company’s performance. Firms with high enterprise multiples have high expected cash flows relative to operating income, implying high growth opportunities.
Traditionally, the only investors have been able to access an international ‘value’ portfolio have been via high-fee active funds focused on identifying ‘value’ opportunities.
ETFs are changing that.
Our international Value ETF (VLUE) tracks the MSCI World ex Australia Enhanced Value Top 250 Select Index. MSCI’s Enhanced Value Index applies three valuation ratio descriptors on a sector relative basis:
- price-to-book value;
- price-to-forward earnings; and
- enterprise value-to-cash flow from operations.
Compared to a traditional value approach, MSCI’s enhanced value index overcomes many criticisms of ‘value’. It does this because it puts less weight on price-to-book as a metric and moves away from backward-looking dividend yield altogether. It also uses a whole-firm valuation measure in enterprise value that could reduce concentration in leveraged companies. In addition, a feature of the index design is that it employs a sector-neutral approach that MSCI found mitigates some of the drawdown inherent with the value investing style.
So, let’s walk through the difference between the VLUE and its index and the standard international equity market capitalisation index, the MSCI World ex Australia Index.
VLUE vs MSCI World ex Australia Index– Fundamentals
Table 1: Statistics and fundamentals
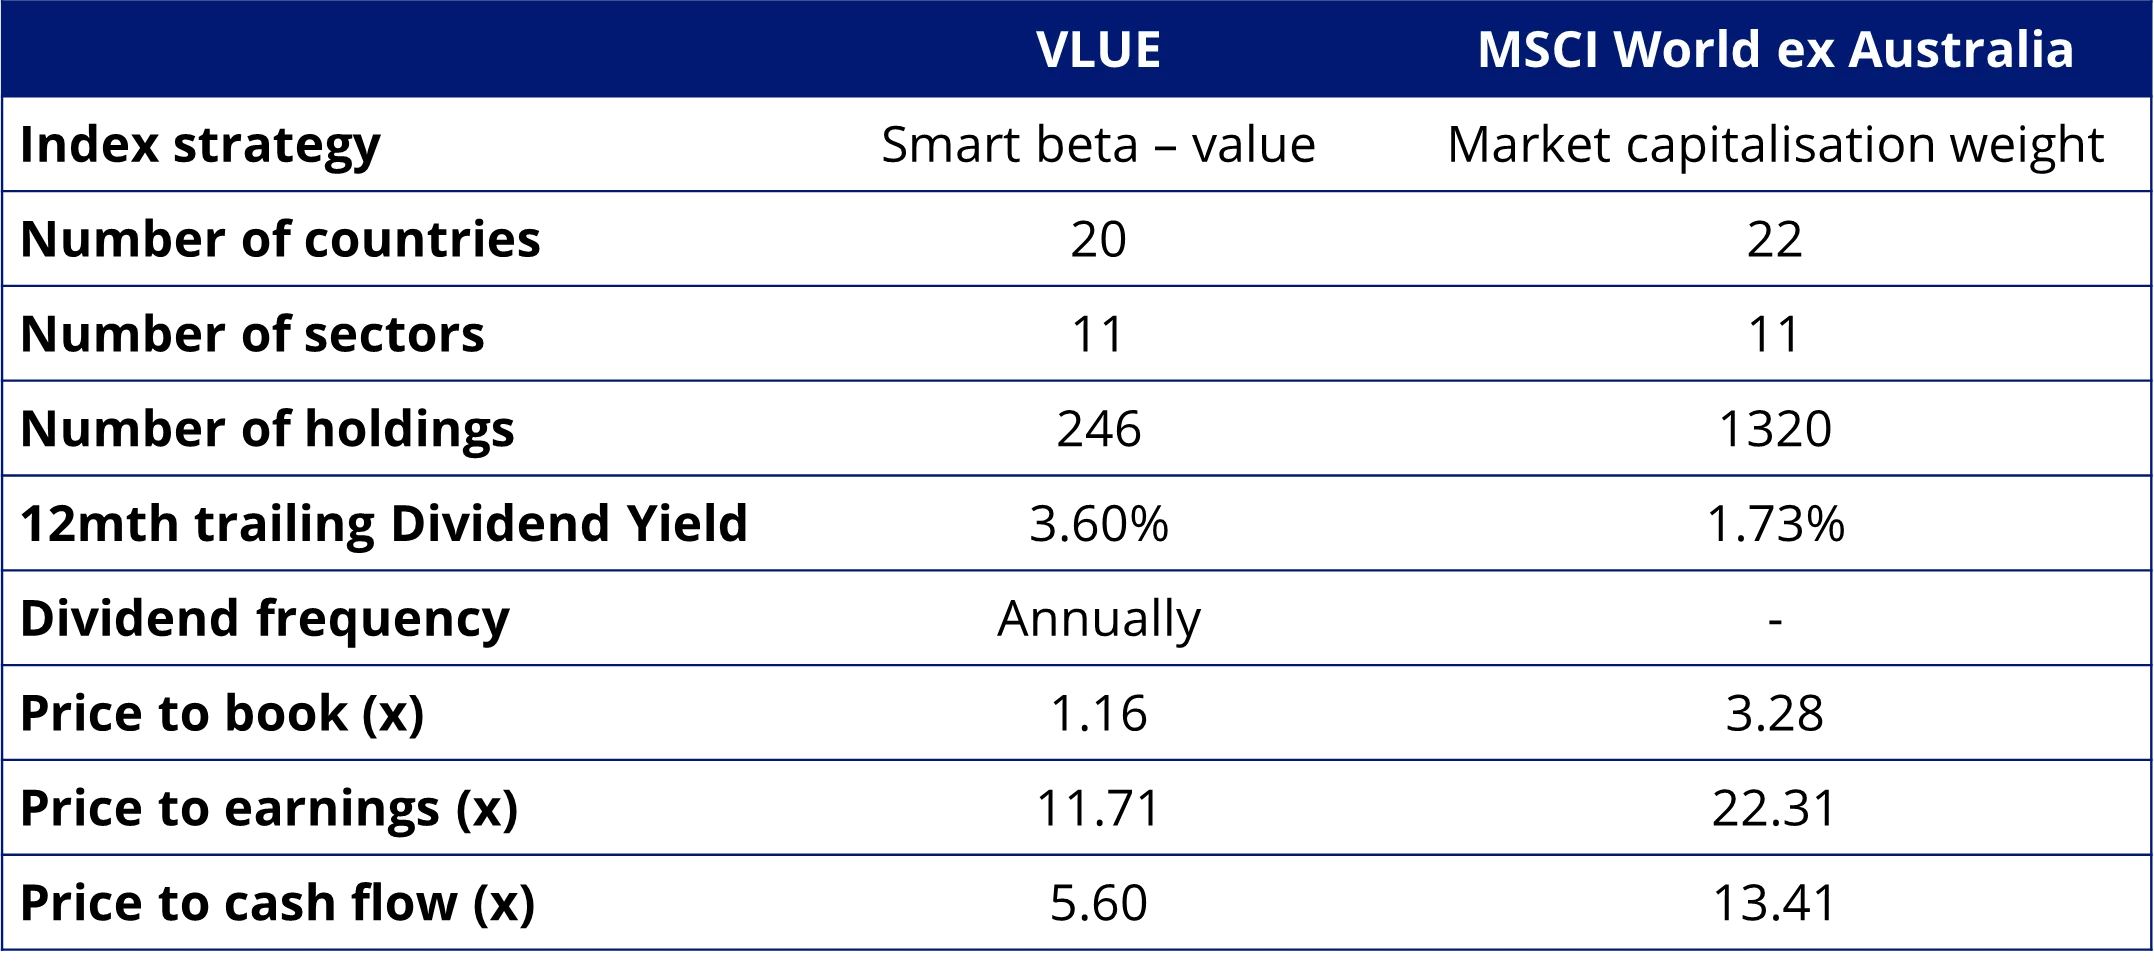
Source: FactSet as at 31 March 2025. Past performance is not a reliable indicator of future performance
As you would expect, VLUE has a lower price to book, price to earnings, and price to cash flow. As is typical of value strategies, VLUE has a higher dividend. This is because, on average, value companies tend to be more mature than many growth companies that do not yet have dividends.
VLUE vs MSCI World ex Australia Index- Top 10 holdings
Below you can see the top 10 companies. There are no common companies in each top 10 list, yet each includes companies that investors can relate to in their day-to-day lives – to see all the holdings in VLUE and their weightings, click here.
Table 2 & 3: Top 10 holdings VLUE and Top 10 MSCI World ex Australia Index
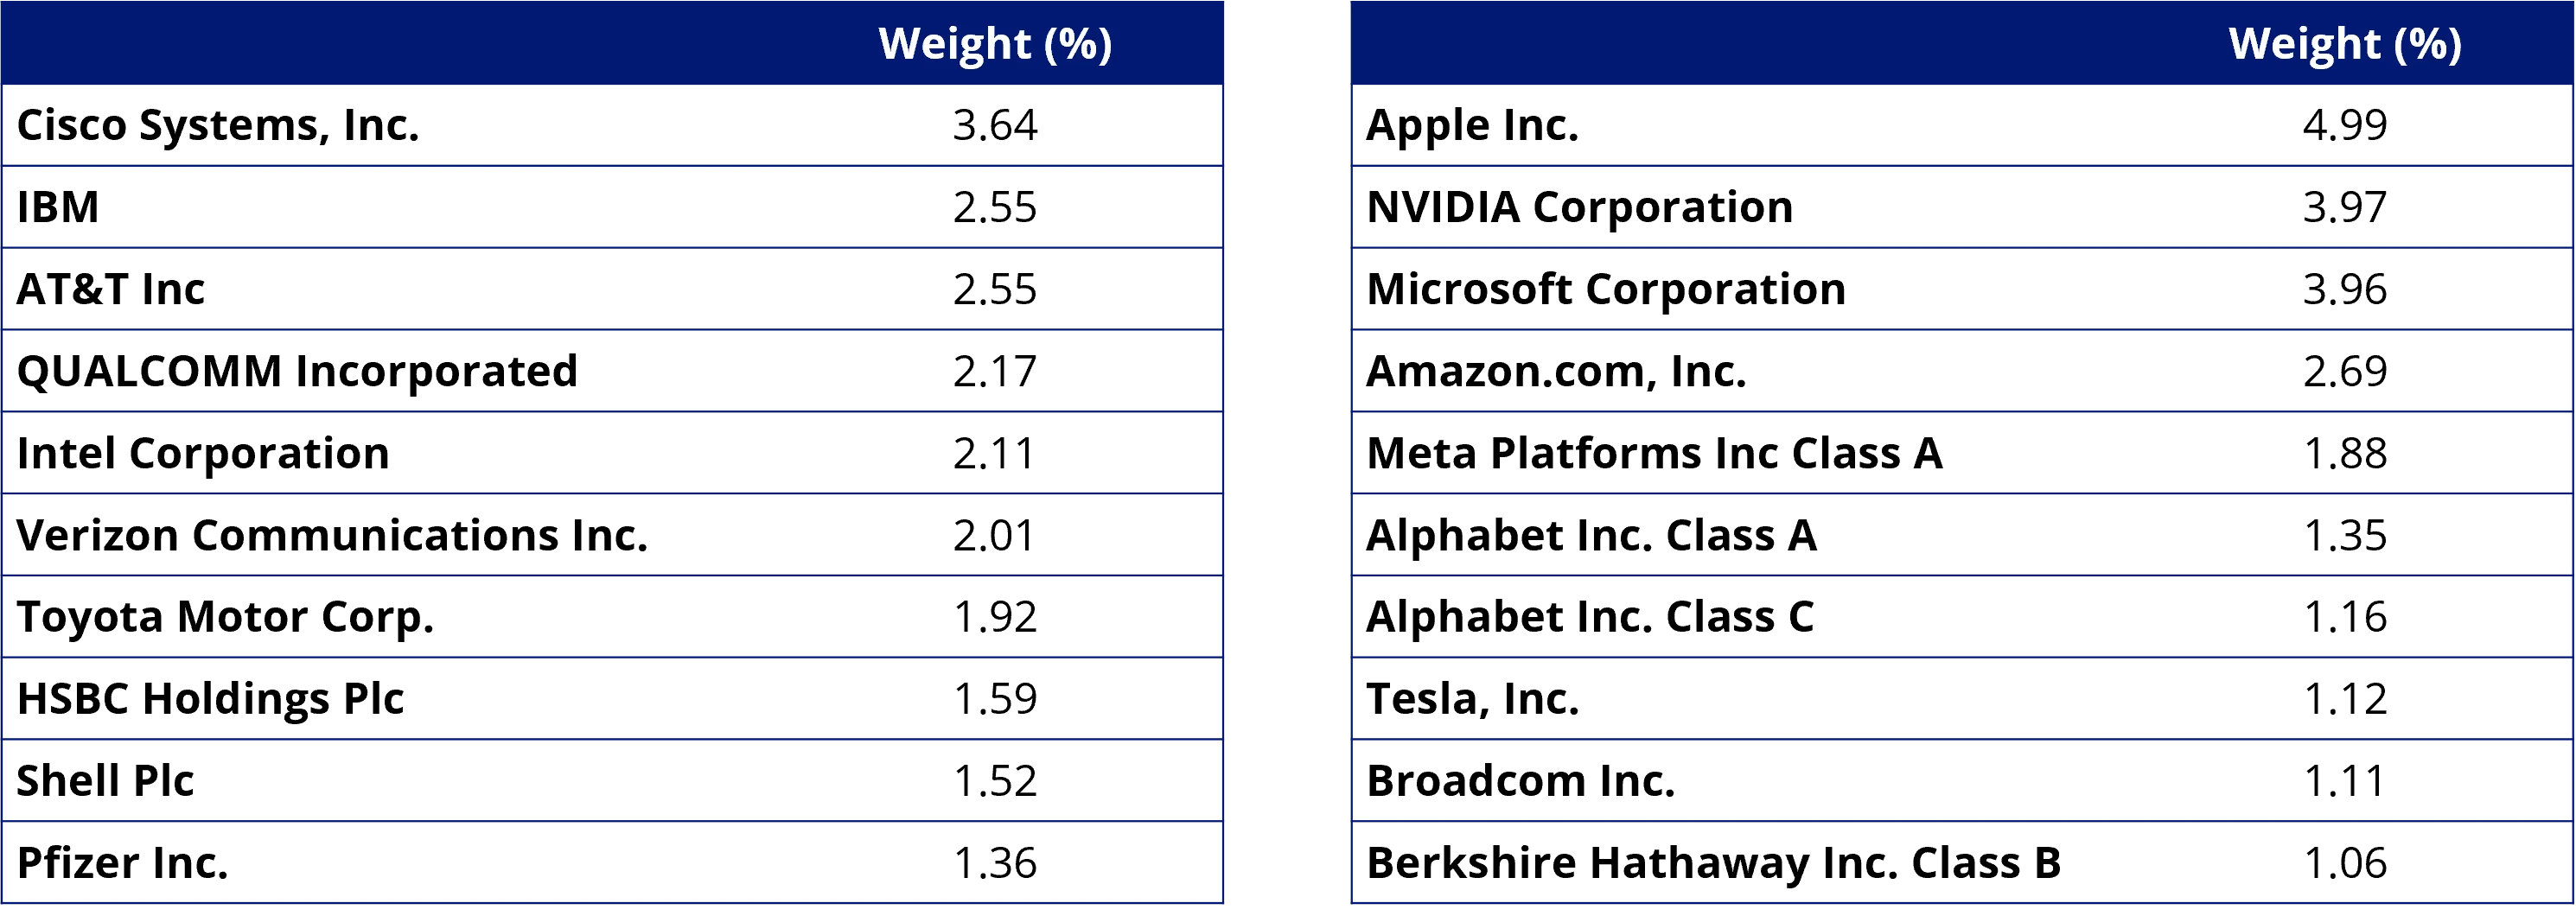
Source: FactSet, VanEck, MSCI, as at 31 March 2025
VLUE vs International Equity Index – Country allocation
We noted above that a feature index VLUE tracks is that it employs a sector-neutral approach, so the sector allocation between the two indices is similar. The same neutral approach does not apply to the country allocation, and you can see below that VLUE has significantly less exposure to the US than the MSCI World ex Australia Index, and is overweight to Japan, France, Germany and Italy.
Table 4: Country breakdown
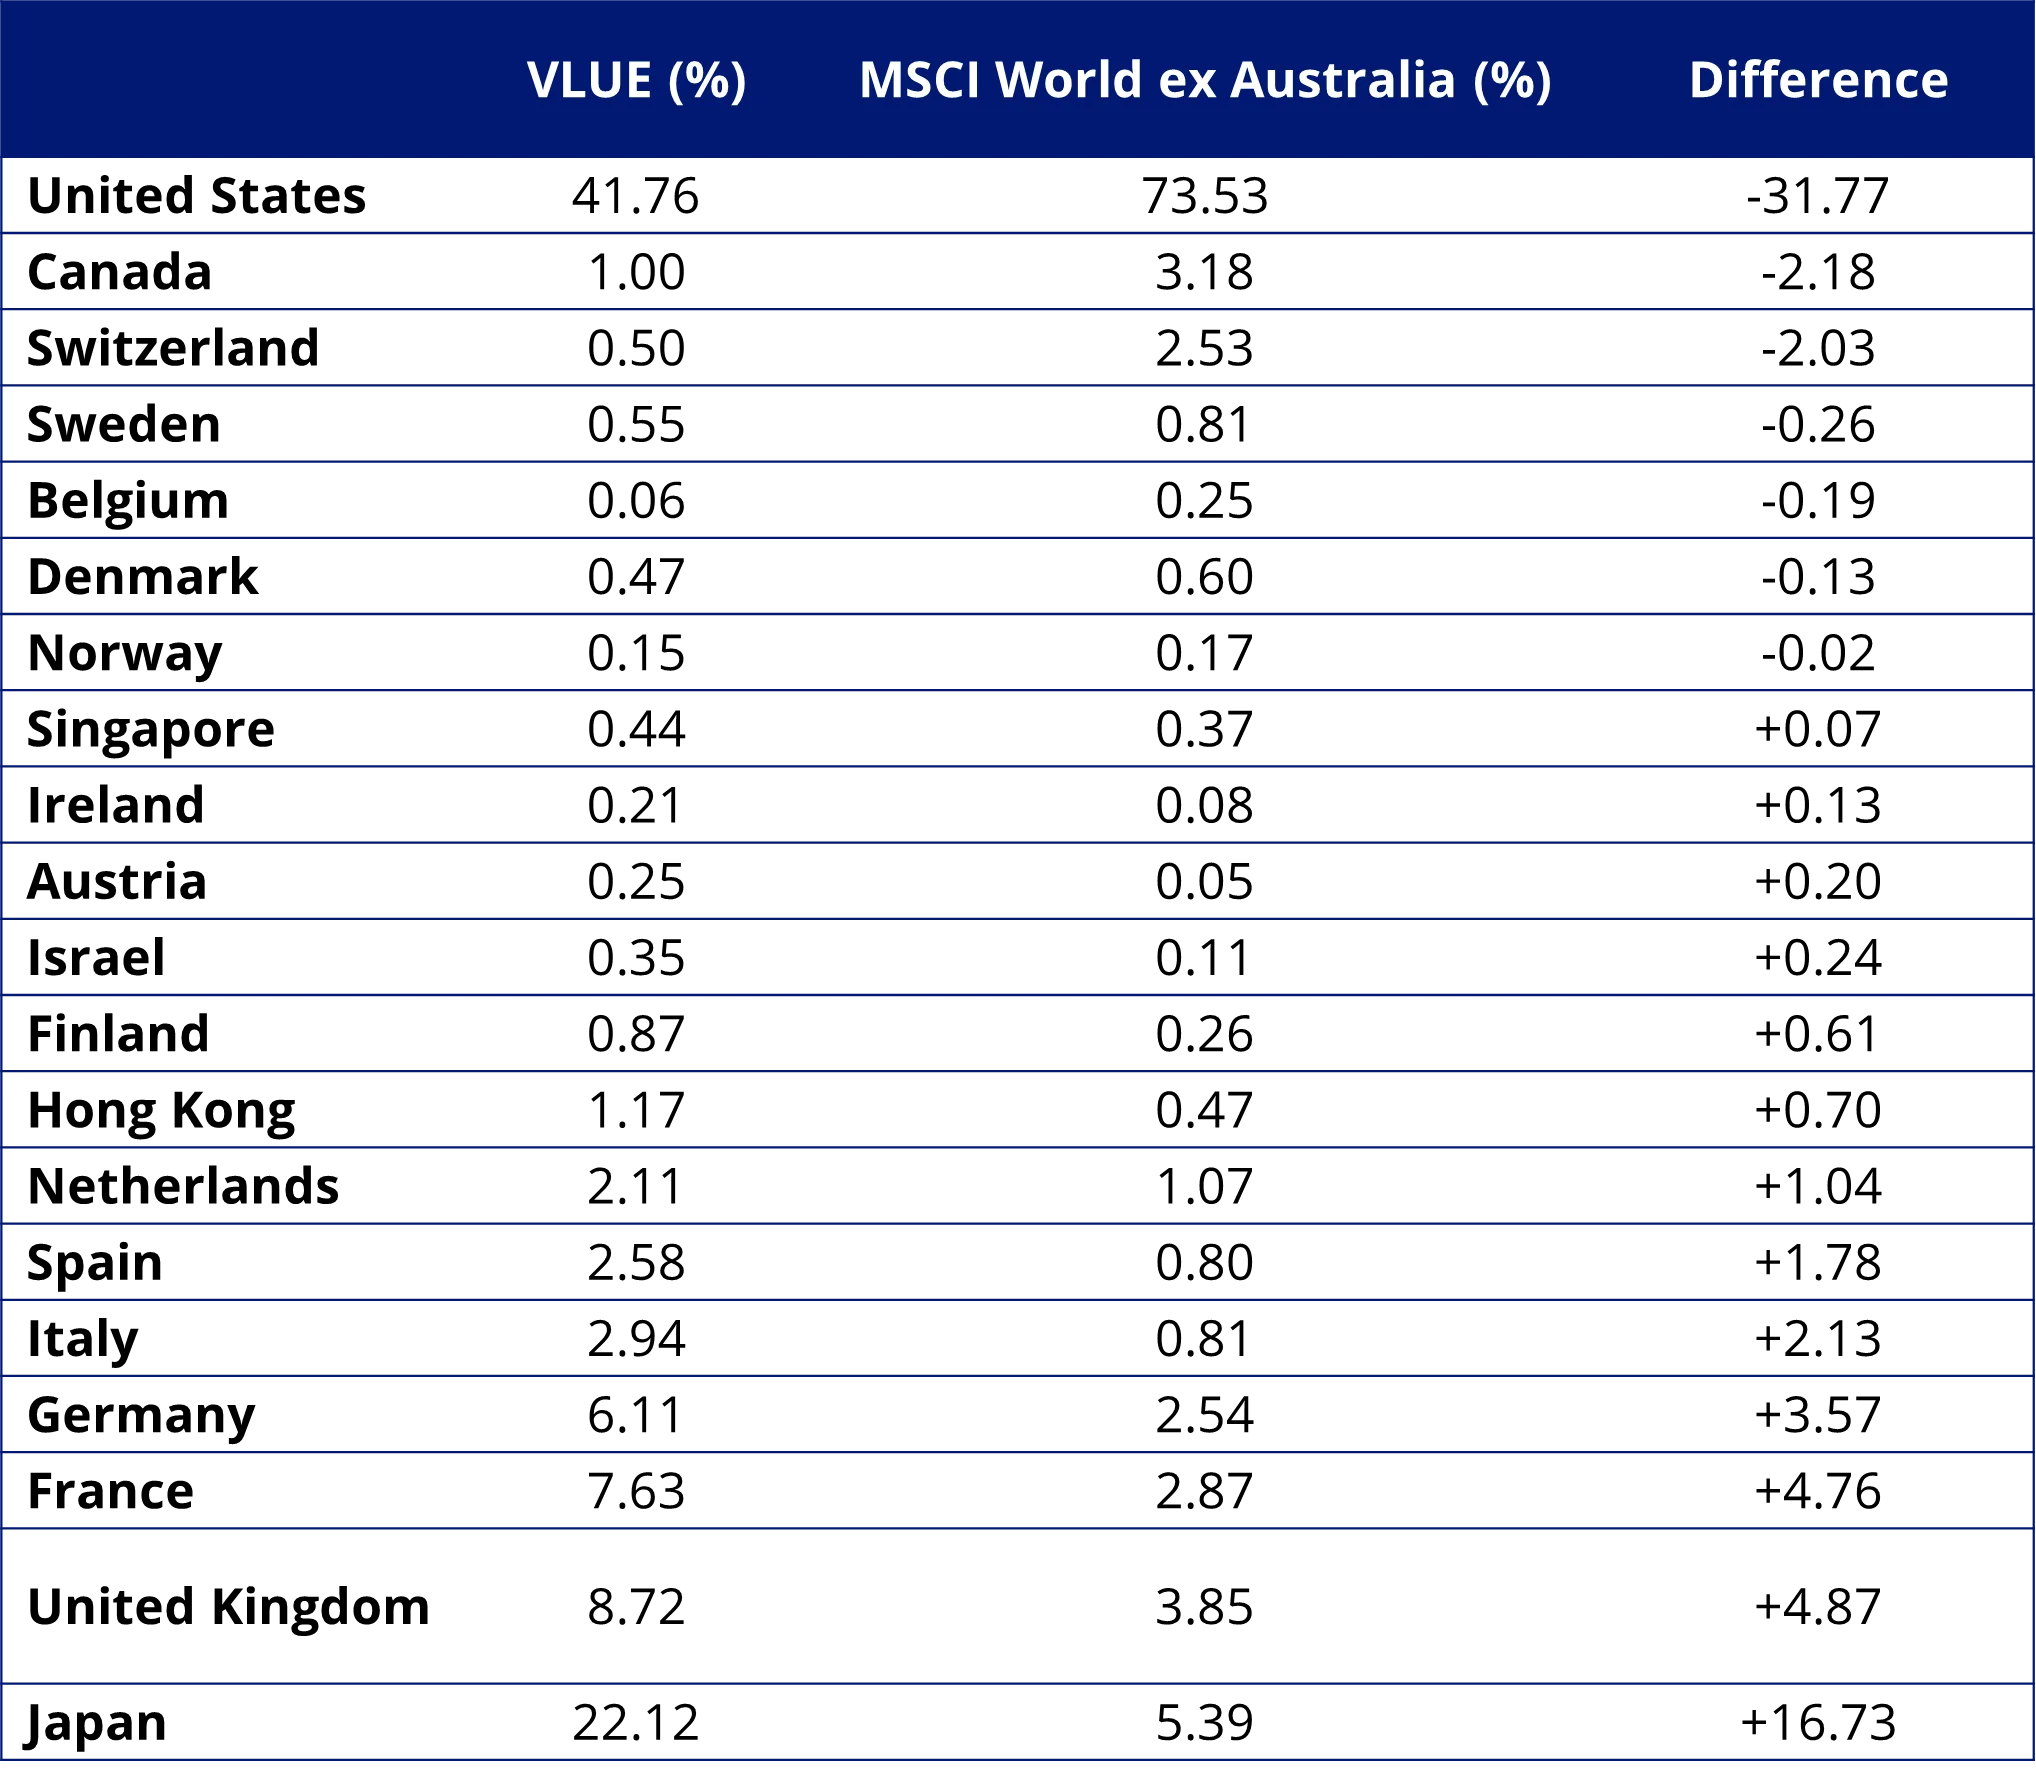
Source: FactSet, VanEck, MSCI, as at 31 March 2025
VLUE vs International Equity Index - Style
When looking at portfolios it is important to determine what style eg value or growth and what size bias a portfolio holds eg giant, large, mid or small. Below we can see VLUE’s. Importantly VLUE holds large companies with a value- orientation relative to the International Equity Index.
Chart 1 & 2: VLUE holdings based style map and MSCI World ex Australia Index holdings based style map
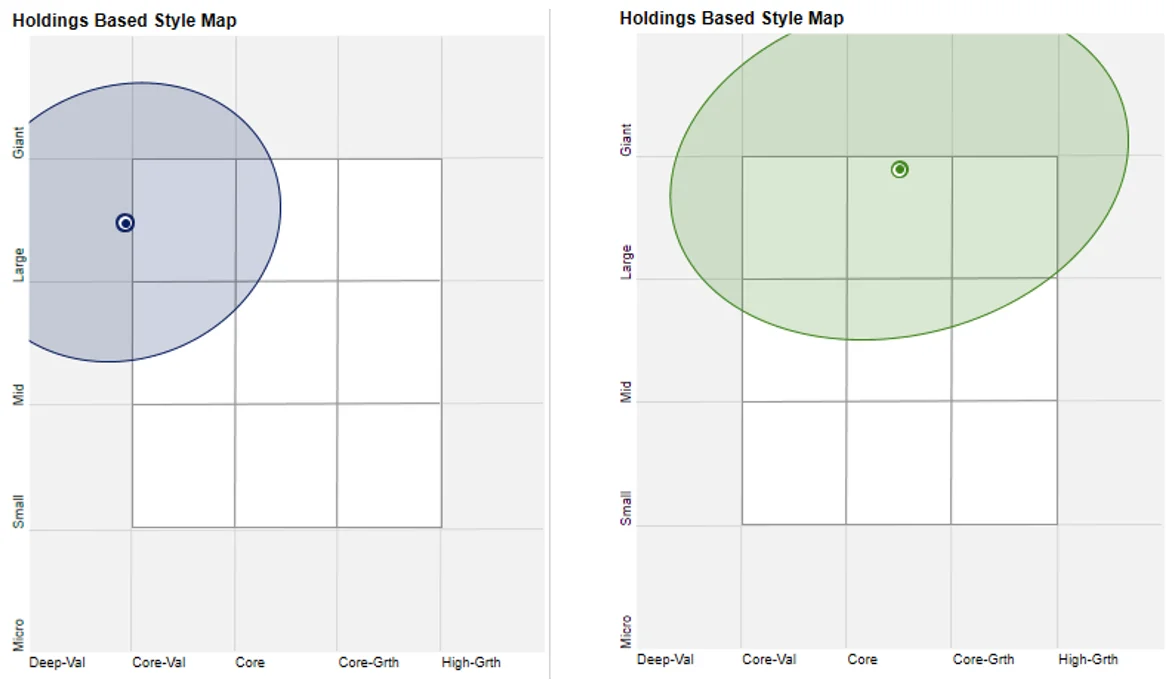
Source: Morningstar Direct, as at 31 Marc h 2025
VLUE vs International Equity Index – Performance
Over the past quarter, you can see that VLUE has come to the fore, outperforming the MSCI World ex Australia Index by 8.31%.
Table 5: Performance as at 31 March 2025
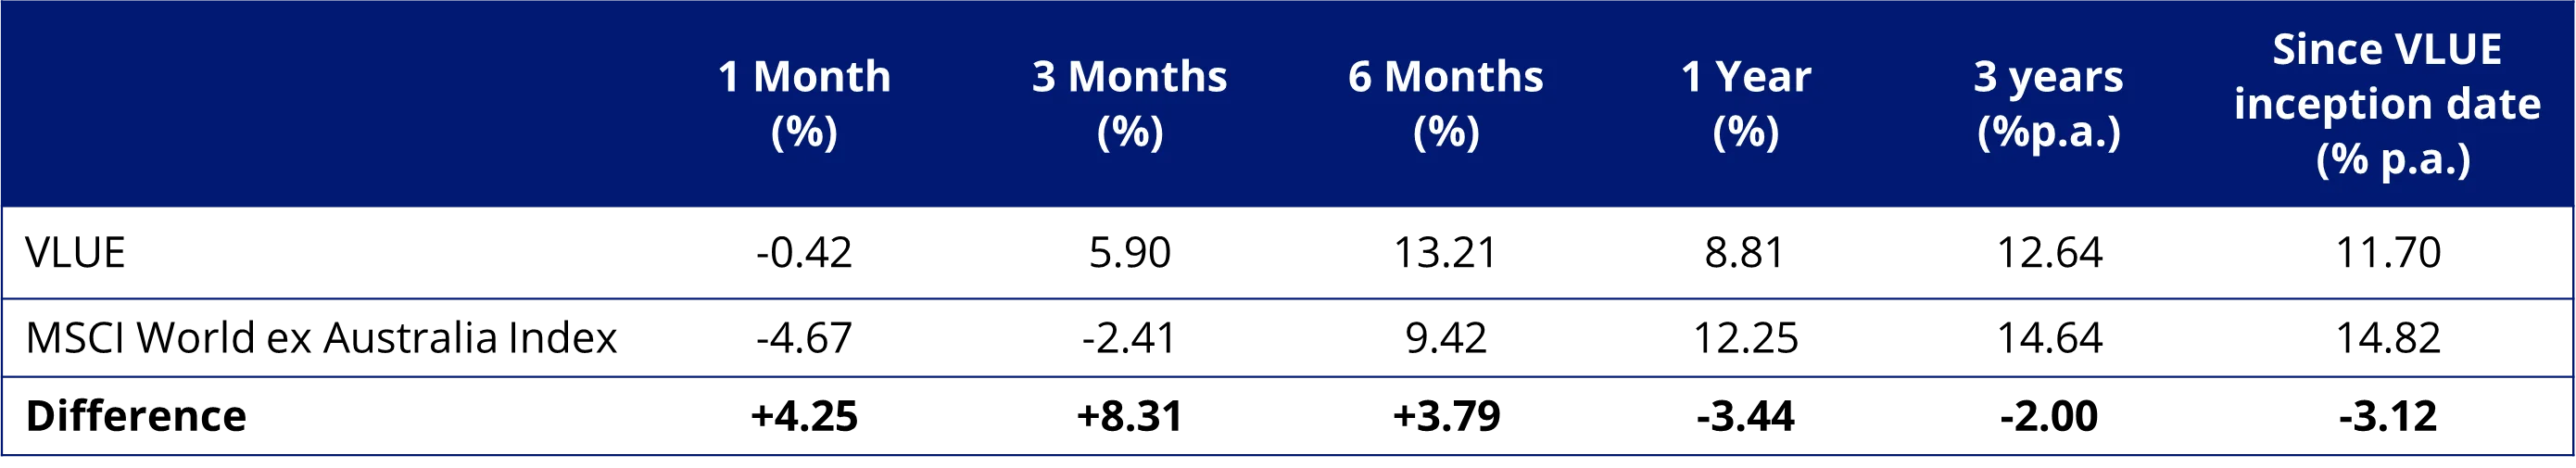
Source: VanEck, Morningstar, Bloomberg. Results assume immediate reinvestment of all dividends and include management fees but exclude brokerage costs and taxes. Past performance is not a reliable indicator of future performance.
VLUE inception date is 8 March 2021 and a copy of the factsheet is here.
The MSCI World ex Australia Index (“MSCI World ex Aus”) is shown for comparison purposes as it is the widely recognised benchmark used to measure the performance of developed market large- and mid-cap companies, weighted by market capitalisation. VLUE’s index measures the performance of 250 international large- and mid-cap companies selected from the MSCI World ex Australia Index with high value scores relative to their peers at rebalance. Exclusions apply for weapons and tobacco. Consequently, VLUE’s index has fewer companies and different country and industry allocations than MSCI World ex Aus. ‘Click here for more details’.
You may have seen in the news that this recent performance has been the result of a rotation to ‘value’ stocks, and away from US equities, in response to higher inflation predicted from tariffs. While VLUE has underperformed since we launched it in 2021, it is worthwhile noting that its recent outperformance is not an historical aberration. Since the turn of the century, the value factor has outperformed the MSCI World ex Australia Index, noting of course, that it does have periods of underperformance.
Based on back testing, the index VLUE tracks displays strong long-term performance since its inception, as highlighted by the chart below.
Chart 3: Modelled cumulative performance of VLUE’s index.
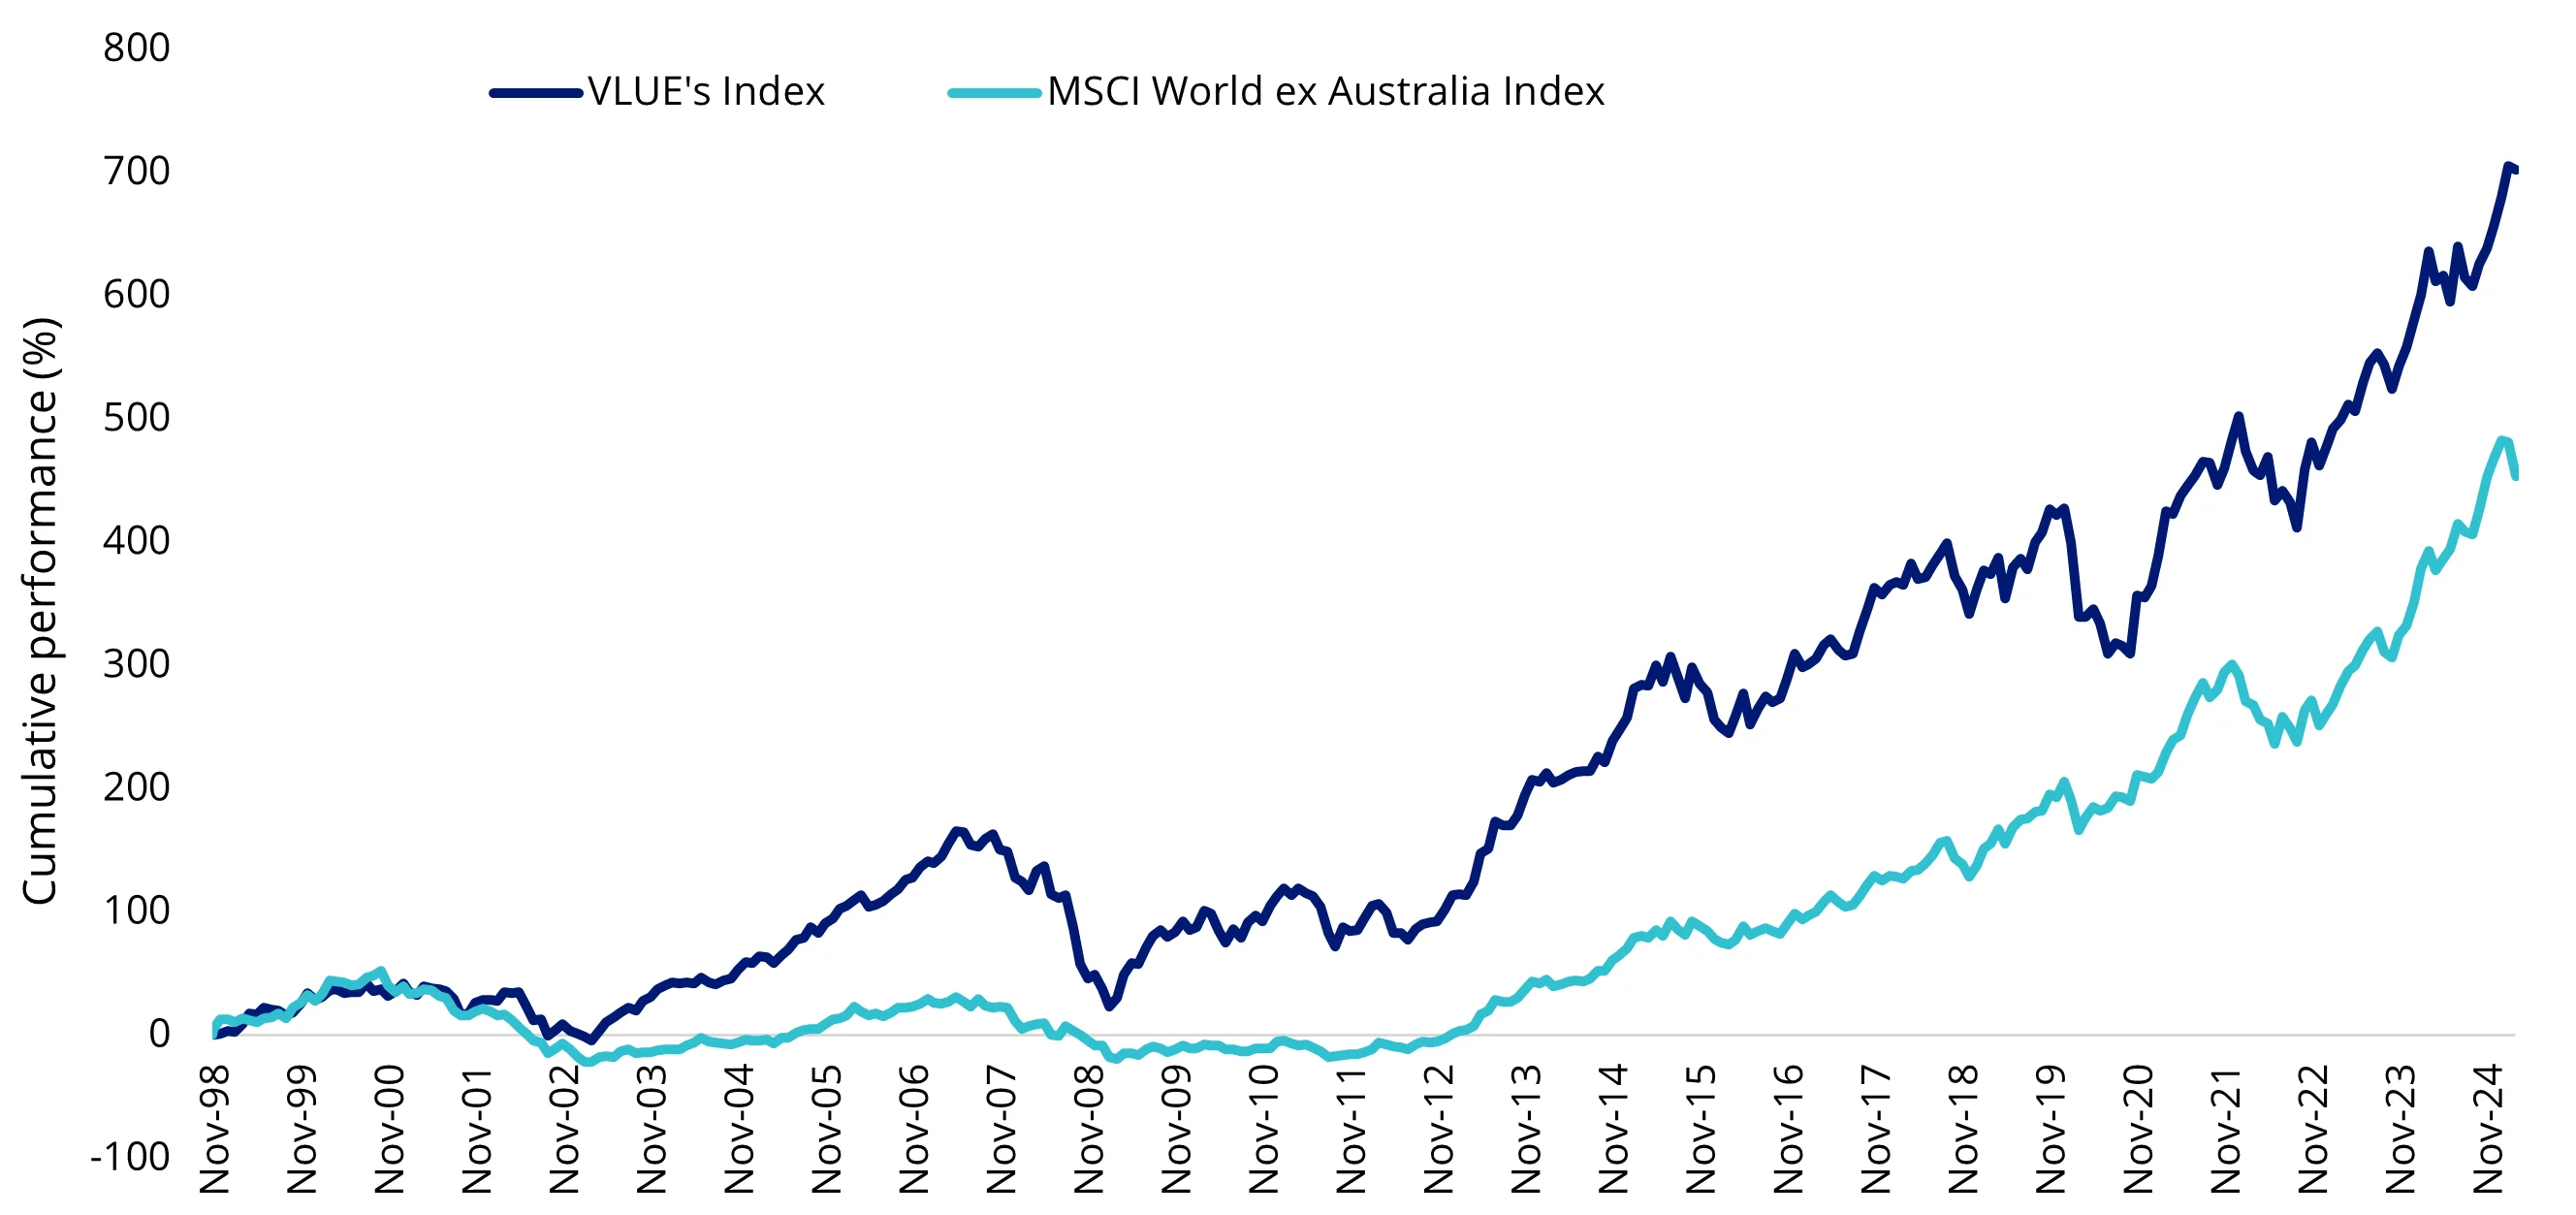
Source: VanEck, Morningstar, Bloomberg from 30 November 1998 as to 31 March 2025. VLUE’s Index is MSCI World ex Australia Enhanced Value Top 250 Select Index. Results assume immediate reinvestment of all dividends and exclude costs associated with investing in the ETF and taxes. Past performance of VLUE's index is not to be relied upon for future performance of the VLUE.. You cannot invest in an index. VLUE’s Index base date is calculated at 30 November 1998. VLUE Index performance prior to its launch on 15 February 2021 is simulated.
The MSCI World ex Australia Index (“MSCI World ex Aus”) is shown for comparison purposes as it is the widely recognised benchmark used to measure the performance of developed market large- and mid-cap companies, weighted by market capitalisation. VLUE’s index measures the performance of 250 international large- and mid-cap companies selected from the MSCI World ex Australia Index with high value scores relative to their peers at rebalance. Consequently, VLUE’s index has fewer companies and different country and industry allocations than MSCI World ex Aus. ‘Click here for more details’. ‘Click here for more details’.
Past performance is no guarantee of future performance. The above is not a recommendation. Please speak to your financial adviser or stock broker.
For further information you can contact us at +61 2 8038 3300.
Key risks
An investment VLUE carries risks associated with: ASX trading time differences, financial markets generally, individual company management, industry sectors, foreign currency, country or sector concentration, political, regulatory and tax risks, fund operations and tracking an index. See the PDS for details.


Published: 04 April 2025
Any views expressed are opinions of the author at the time of writing and is not a recommendation to act.
VanEck Investments Limited (ACN 146 596 116 AFSL 416755) (VanEck) is the issuer and responsible entity of all VanEck exchange traded funds (Funds) trading on the ASX. This information is general in nature and not personal advice, it does not take into account any person’s financial objectives, situation or needs. The product disclosure statement (PDS) and the target market determination (TMD) for all Funds are available at vaneck.com.au. You should consider whether or not an investment in any Fund is appropriate for you. Investments in a Fund involve risks associated with financial markets. These risks vary depending on a Fund’s investment objective. Refer to the applicable PDS and TMD for more details on risks. Investment returns and capital are not guaranteed.
VLUE is indexed to a MSCI index. VLUE is not sponsored, endorsed or promoted by MSCI, and MSCI bears no liability with respect to VLUE or the MSCI Index. The PDS contains a more detailed description of the limited relationship MSCI has with VanEck and VLUE.