Australia's Mighty MidCaps
In the world of investing the S&P/ASX 200 gets the most attention for Australian equities. It is on the newswires and is the market benchmark that fund managers either track or aim to outperform. However, another S&P/ASX market capitalisation index, one that is often overlooked, is the one that has the most outstanding performance track record - the S&P/ASX MidCap 50 Index, aka the Mighty MidCaps.
The S&P/ASX indices recently celebrated their 25thanniversary as Australia’s share market barometers. Among them, the MidCap 50 Index stands out.
How sweet it is
Australian Mid-Caps are the 'sweet spot' of the Australian equity universe and represent companies with the spirit of small companies combined with the maturity of large companies.
There are several reasons mid-caps are often referred to as the ‘sweet spot’ of the Australian stock market:
- This is often where M&A can happen;
- Capital expenditure is generally higher. Mid-caps tend to reinvest more in their business than large-caps;
- Greater agility. Due to their size mid-caps are able to respond more quickly to growth opportunities; and
- Room for growth. MidCaps often experience higher revenue and net income growth than large-caps.
Performance
Since their inception in April 2000, the S&P/ASX MidCaps Index has been the star performer compared to the S&P/ASX Small Ordinaries Index and the large-cap dominated indices.
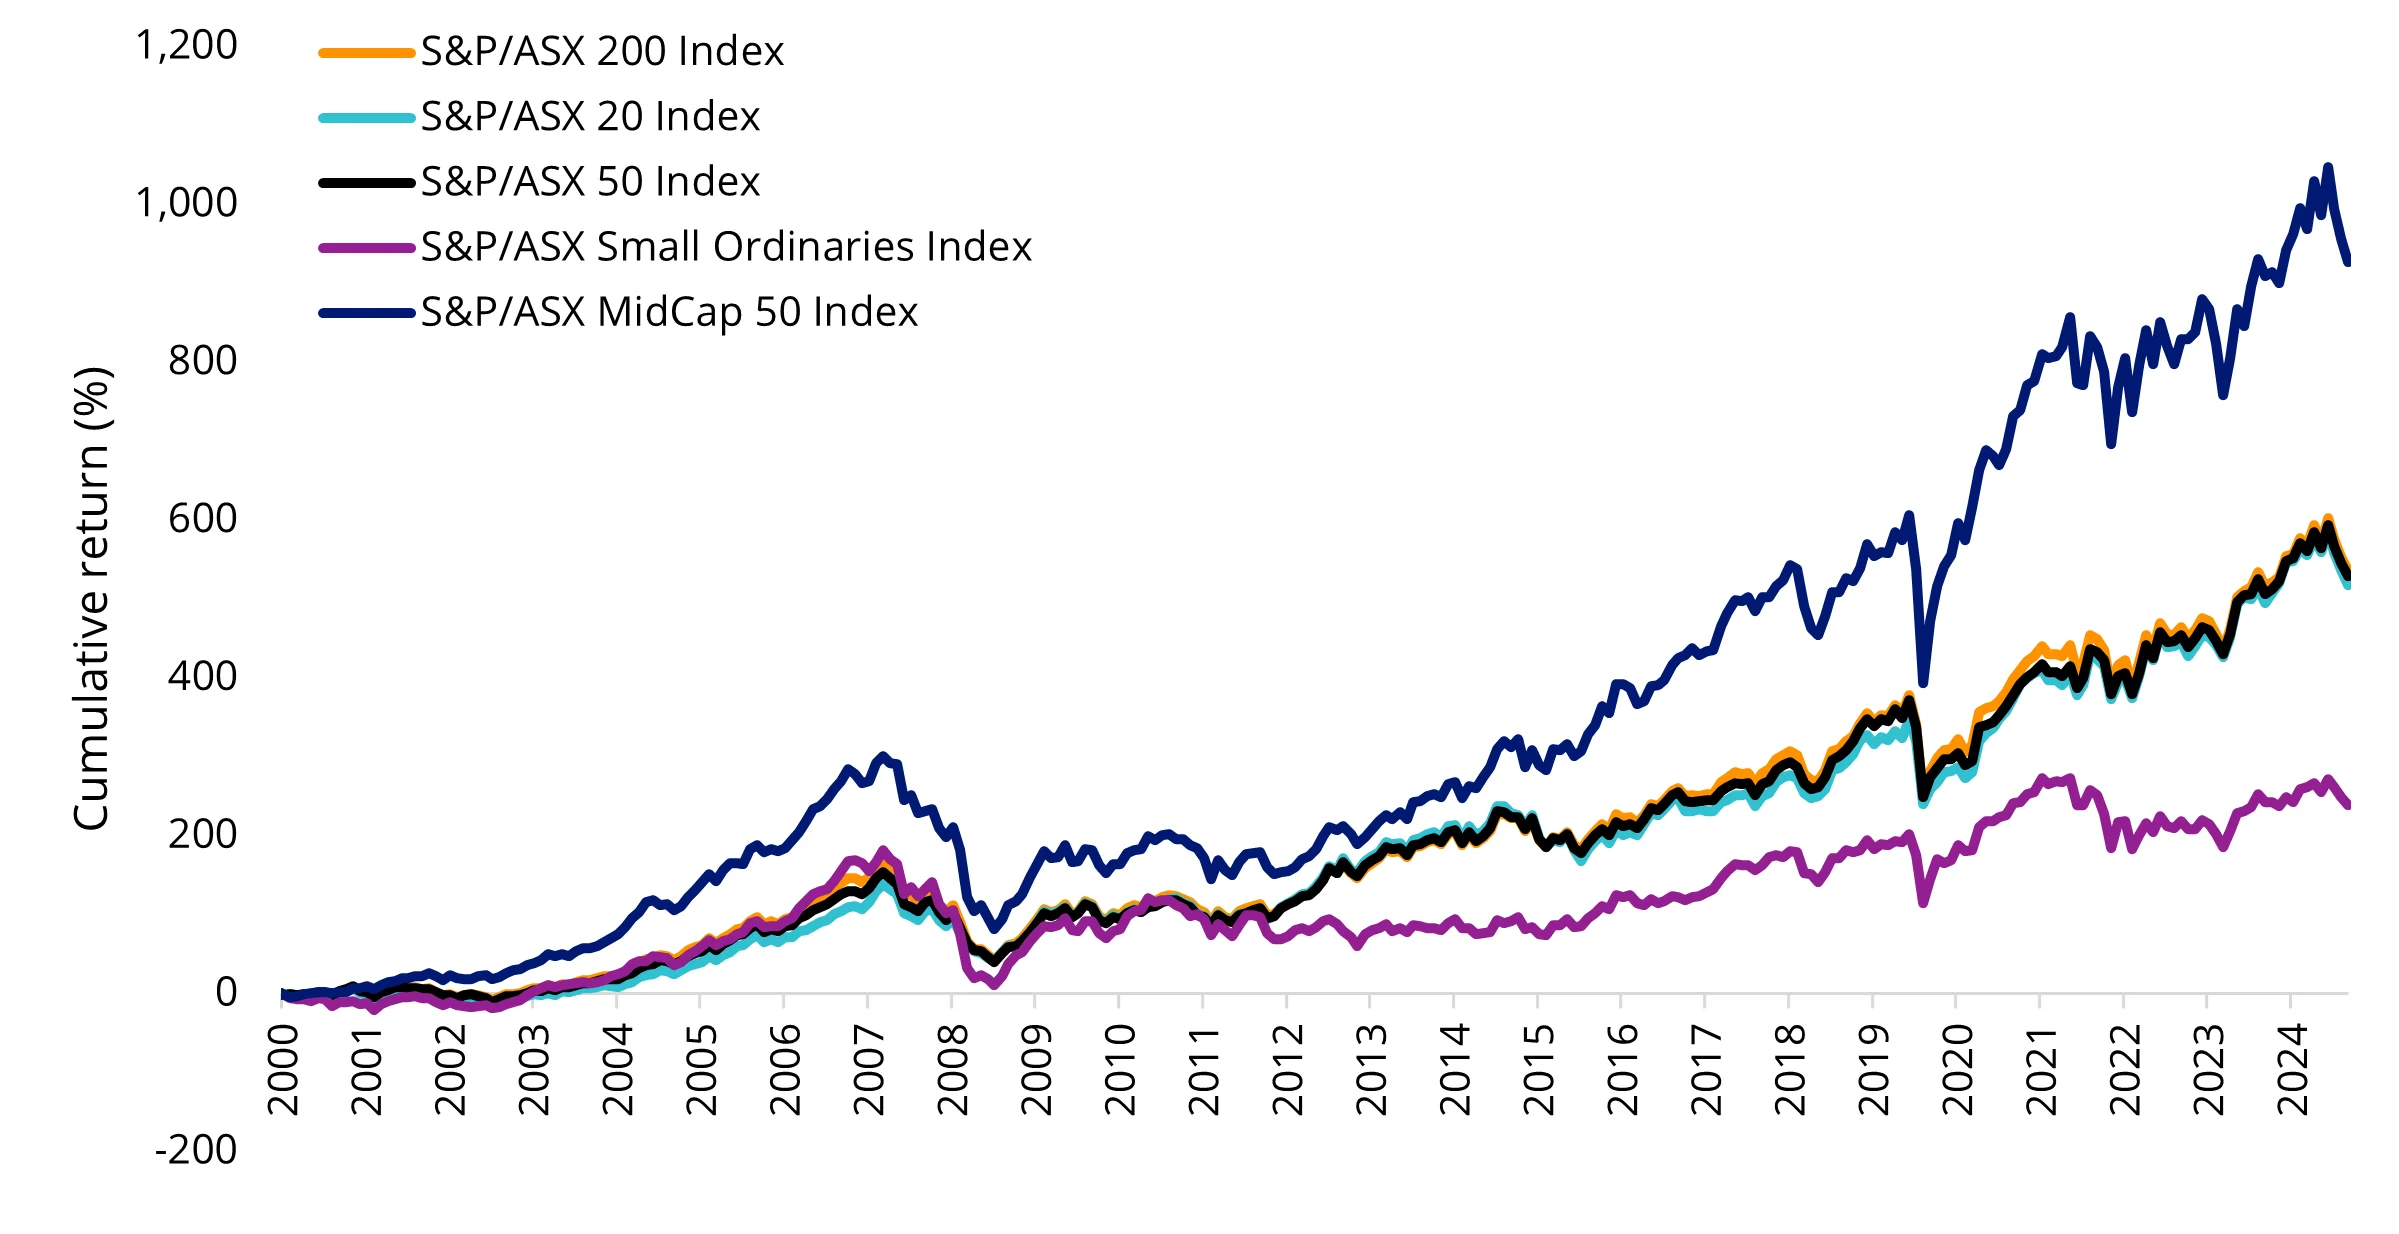
Source: VanEck, Morningstar, as at 12 April 2025. S&P/ASX indices commenced 4 April 2000. Results are calculated to the last business day of the month and assume immediate reinvestment of all dividends and exclude costs associated with investing in MVE. You cannot invest directly in an index. Past performance of the S&P/ASX MidCap 50 Index is not a reliable indicator of future performance of MVE.
Using the Sharpe ratio as a measure, which takes into account returns and volatility, the S&P/ASX MidCap 50 Index also has favourable risk adjusted performance compared to other S&P/ASX indices The greater the value of the Sharpe ratio, the better the risk adjusted return. The table below shows that the S&P/ASX MidCap 50 Index has delivered the best risk-adjusted returns over 5, 10, 15 and 25 years.
Table 1: Risk-adjusted returns (Sharpe ratio)
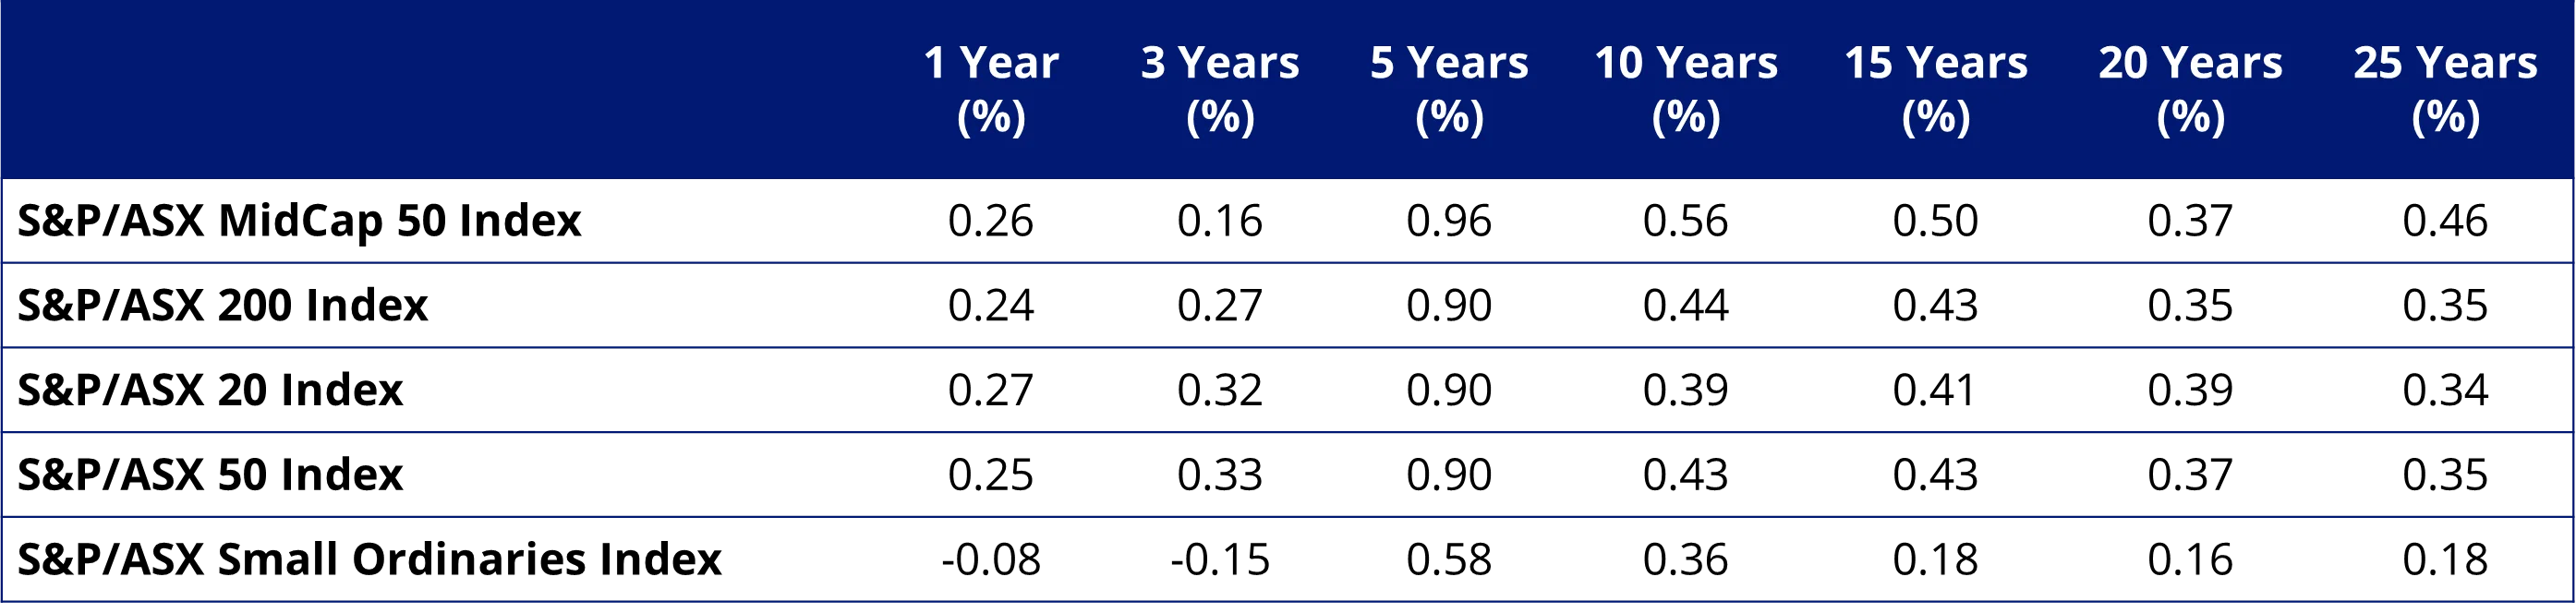
Source: VanEck, Morningstar, as at 12 April 2025. Bolded results are highest. Results are calculated to the last business day of the month and assume immediate reinvestment of all dividends and exclude costs associated with investing in MVE. You cannot invest directly in an index. Past performance of the S&P/ASX MidCap 50 Index is not a reliable indicator of future performance of MVE.
Diversity
The chart below illustrates the greater sector diversity of the S&P/ASX MidCap 50 Index compared to the S&P/ASX 200 Index, which is dominated by financials.
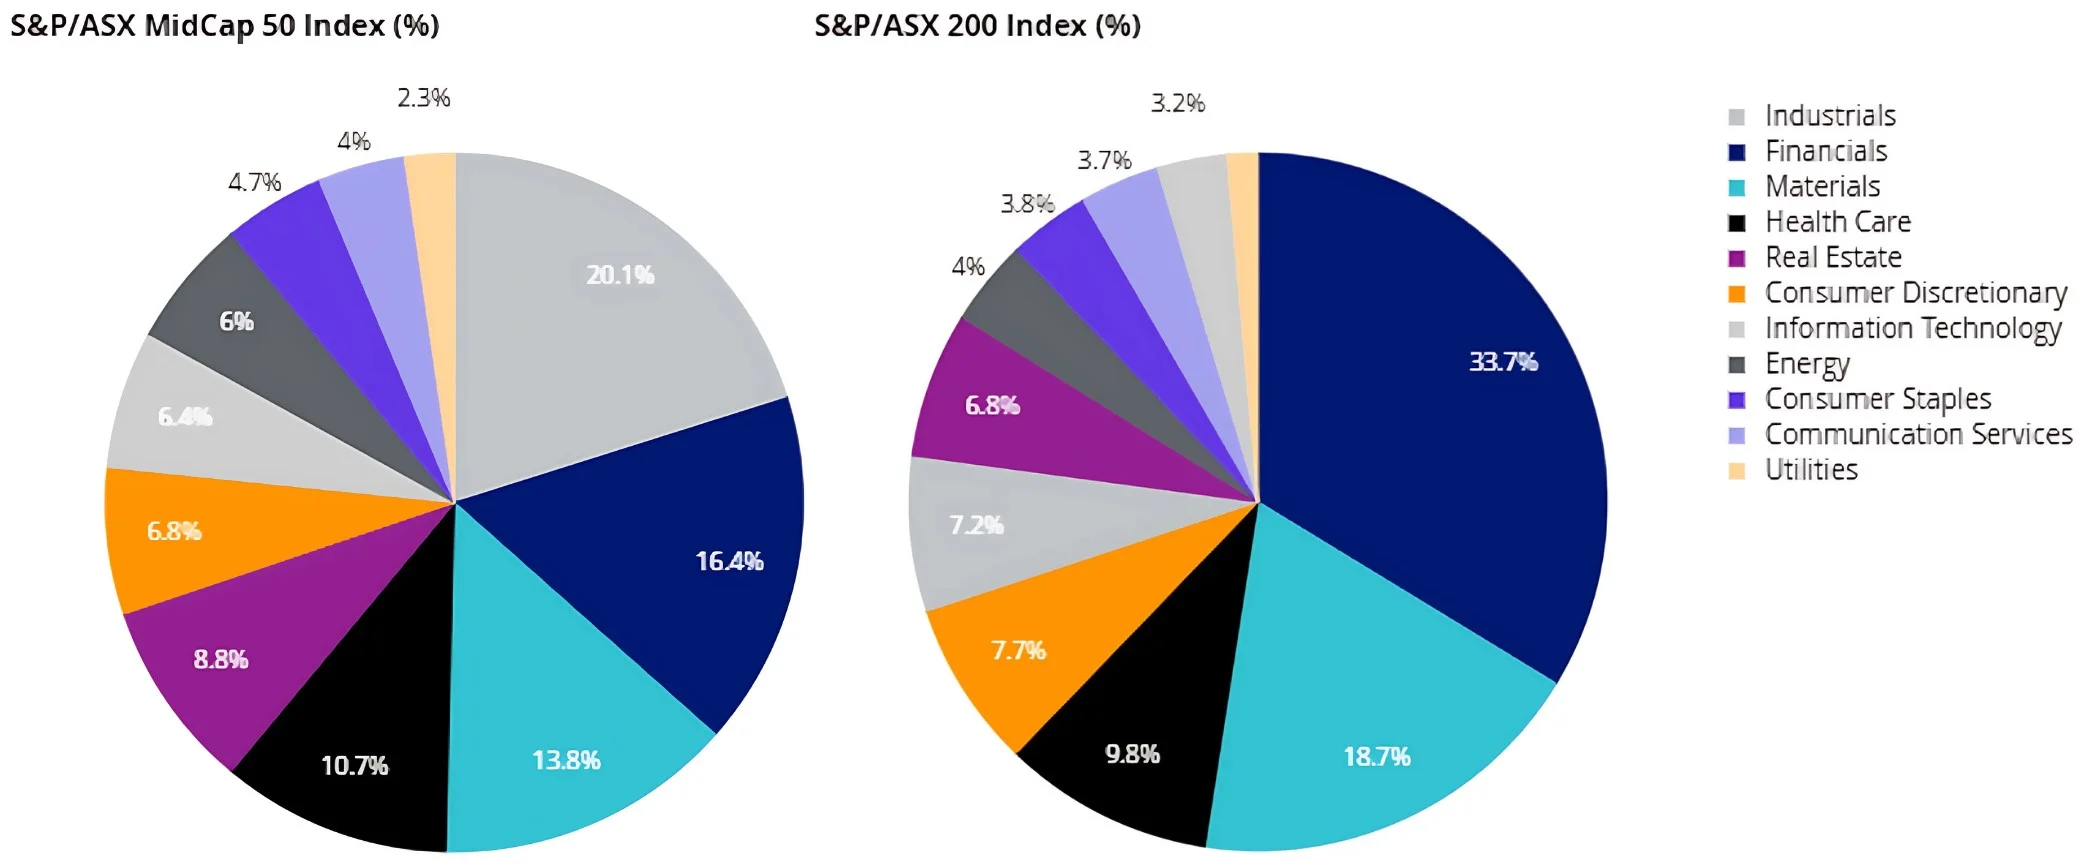
Source: VanEck, S&P Dow Jones Indices; as at 31 March 2025.
The VanEck S&P/ASX MidCap ETF (ASX: MVE) is the only ASX ETF which tracks the S&P/ASX MidCap 50 Index.
Key risks
An investment in our mid-caps ETF carries risks associated with: financial markets generally, individual company management, industry sectors, fund operations and tracking an index. See the VanEck S&P/ASX MidCap ETF PDS and TMD for more details.


Published: 17 April 2025
Any views expressed are opinions of the author at the time of writing and is not a recommendation to act.
VanEck Investments Limited (ACN 146 596 116 AFSL 416755) (VanEck) is the issuer and responsible entity of all VanEck exchange traded funds (Funds) trading on the ASX. This information is general in nature and not personal advice, it does not take into account any person’s financial objectives, situation or needs. The product disclosure statement (PDS) and the target market determination (TMD) for all Funds are available at vaneck.com.au. You should consider whether or not an investment in any Fund is appropriate for you. Investments in a Fund involve risks associated with financial markets. These risks vary depending on a Fund’s investment objective. Refer to the applicable PDS and TMD for more details on risks. Investment returns and capital are not guaranteed.
The S&P/ASX MidCap 50 Index is a product of S&P Dow Jones Indices LLC or its affiliates (“SPDJI”) and ASX Limited (“ASX”) and licensed for use by VanEck. S&P® is a registered trademark of Standard & Poor’s Financial Services LLC (“S&P”); Dow Jones® is a registered trademark of Dow Jones Trademark Holdings LLC (“Dow Jones”); and these trademarks have been licensed for use by SPDJI and sublicensed by VanEck. The Fund is not sponsored, endorsed, sold or promoted by SPDJI, Dow Jones, S&P, their respective affiliates, or ASX, and none of them makes any representation regarding the advisability of investing in the Fund. Such parties do not accept liability for any errors, omissions or interruptions of the S&P/ASX MidCap 50 Index and do not give any assurance that the Fund will accurately track the performance of the index or provide positive investment returns. Inclusion of a security within the index or Fund is not a recommendation by any party to buy, sell or hold such security.