Celebrating the middle-est companies on ASX
Mid-cap stocks were the star performers in the latest earnings season yet most Australian portfolios are underweight mid-caps, in favour of large caps.
Being in the middle can be tough. Middle children, middle school, mid-life crisis… even the concept of being in the middle has taken on a negative connotation. The word ‘mediocre’ comes from the Latin word mediocris, which means “of medium size, moderate, middling, commonplace.” Yet to rate something ‘mediocre’ typically means it fell short of expectations.
Certainly, the English language doesn’t support the idea that you can be the best at being in the middle. You can be the biggest. You can be the smallest. But you cannot be the middle-est.
The ideal state is typically to be ‘the biggest’, and this is often why large-cap stocks on the ASX, such as Telstra, Woolworths, CBA and BHP receive the lion’s share of attention and investment. Market cap is used as a proxy for companies that have demonstrated longevity and stability, and this is how the S&P/ASX 200 is constructed, with bigger companies allocated a larger slice of the index.
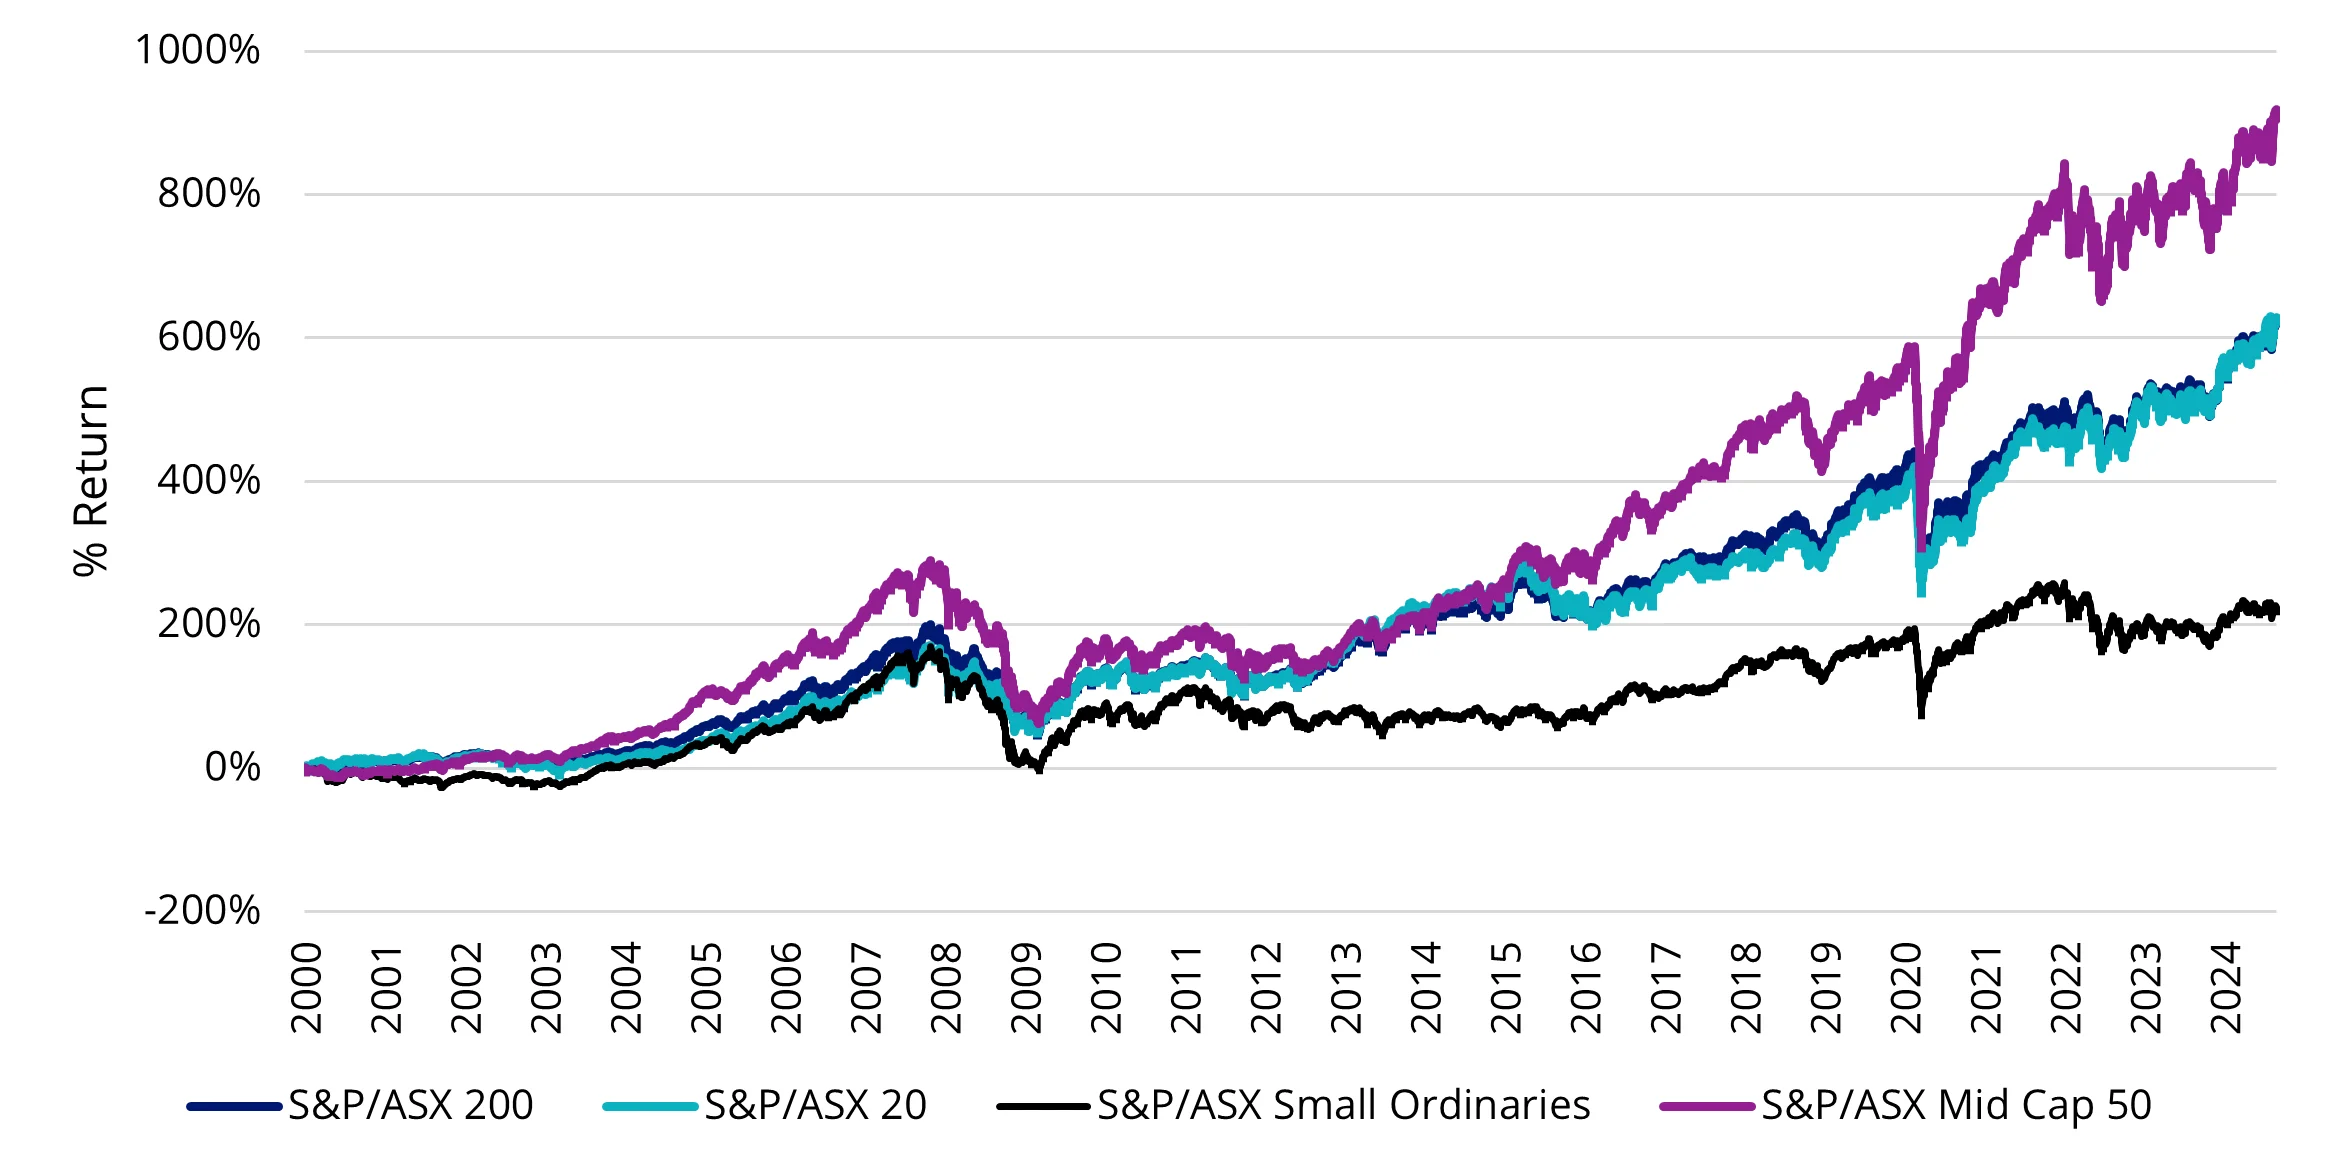
However, this focus on large-caps means that mid-cap exposure is often underrepresented. Historically, mid-caps have outperformed the S&P/ASX 200 and other indices in the ASX equity universe for more than 20 years.
This bias for bigger companies underscores the potential for overlooked opportunities within the Australian equities market, particularly with the ‘middle-est’ companies on the ASX.
Chart 1: Performance of S&P/ASX equities since 2000

Source: VanEck, Bloomberg, 1 January 2000 to 31 August 2024. Results are calculated to the last business day of the month and assume immediate reinvestment of all dividends and exclude costs associated with investing in MVE. You cannot invest directly in an index. Past performance is not a reliable indicator of future performance.
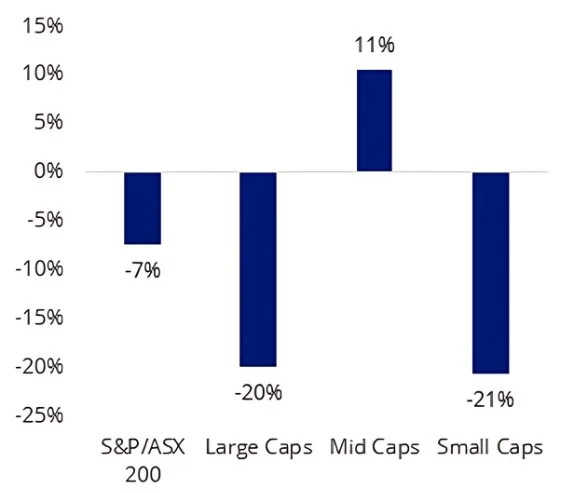
Looking at the results from this year’s earning season, mid-caps – defined as the largest companies ranked 51 to 100 in the S&P/ASX 200 and have a median market cap of $6 billion – were the star performers once again, reporting more net beats than misses.
Chart 2: August 2024 earnings season net beats by size

Source: Bloomberg, as at 28 August 2024.
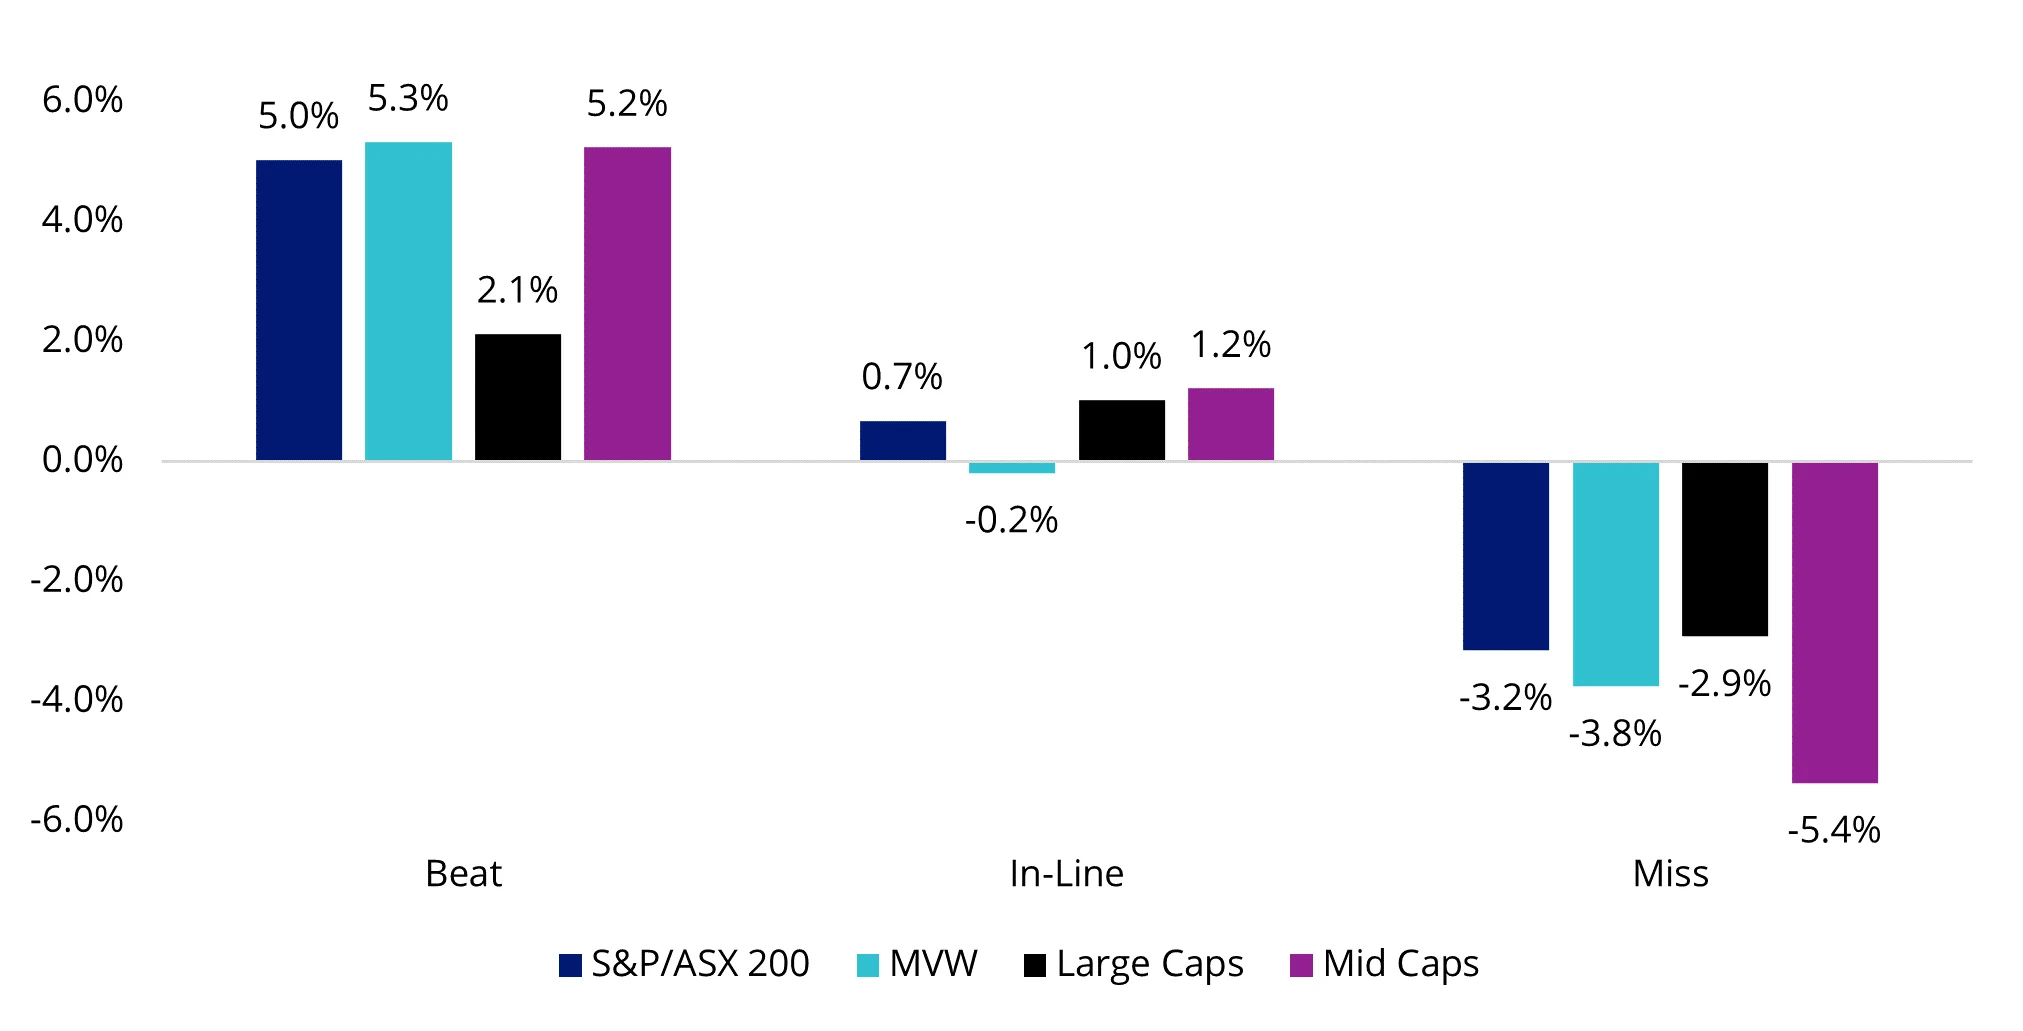
The results are anecdotal of a resilient Australian consumer, despite a prolonged period of higher interest rates and elevated inflation. Mid-cap stocks that reported in line and beats ahead of expectation mostly saw strong one day price moves as well.
Chart 3: August 2024 earnings season one day price reaction post earnings release by size

Source: Bloomberg, as at 28 August 2024.
Yet another area where mid-caps outperformed was in the average upward price target revision. Here, sell-side analysts had the highest confidence in the capital appreciation potential for mid-caps moving forward.
Chart 4: Mid-caps with most upward price target revisions in August 2024 earnings

Source: Bloomberg, as at 28 August 2024.
Large caps have not been so fortunate. One of the key insights out of this earnings season was the need to exercise caution about heavy exposure to Australia’s mega cap banks and mining companies, which make up eight out of the top ten S&P/ASX 200 companies.
CBA is currently the largest listed company, however there are no sell-side analysts recommending it at the current price, which is considered to be significantly overvalued. Further, CBA’s outlook is hindered by stagnant earnings growth and incrementally rising non-performing loans.
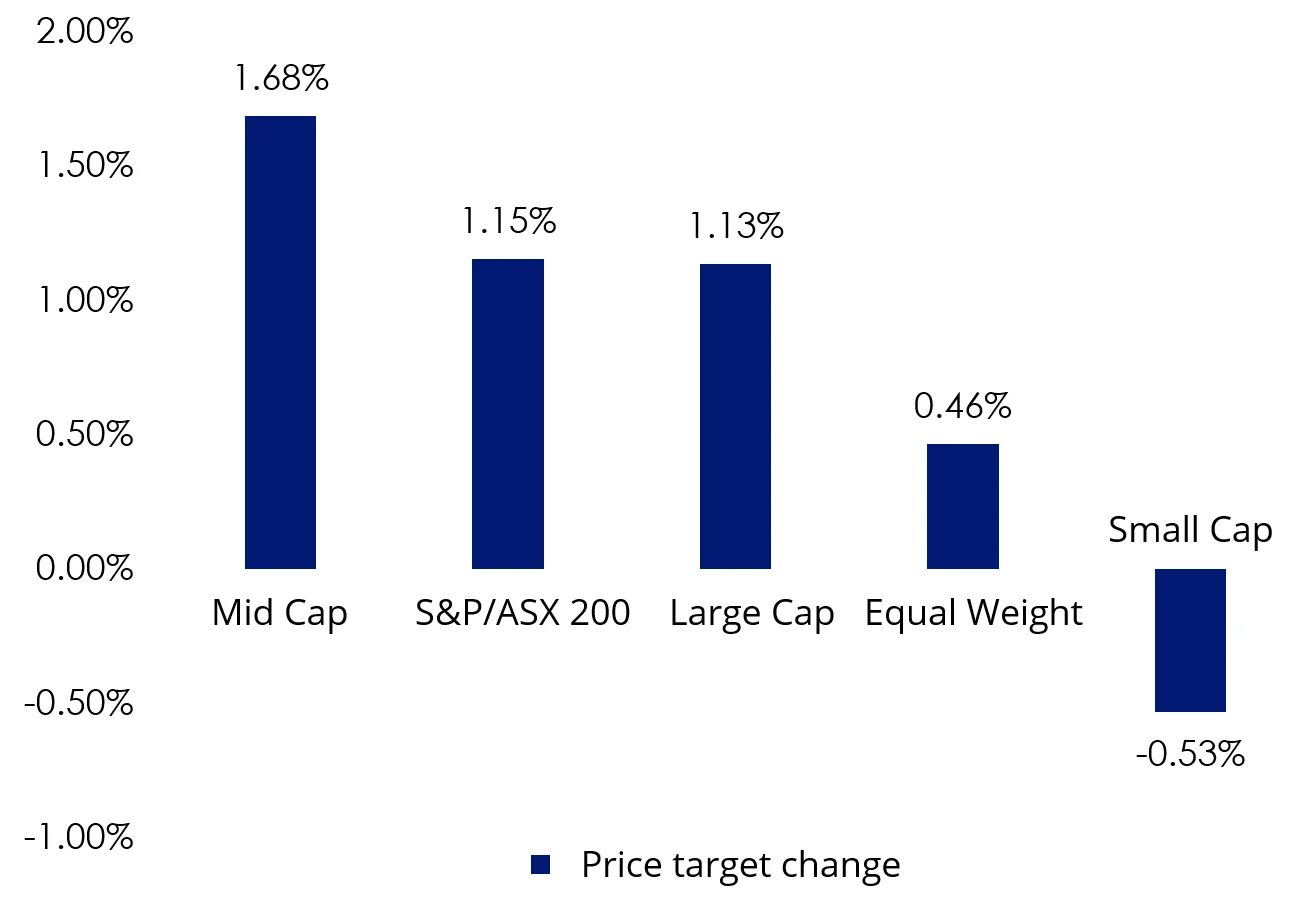
With China’s steel industry slowing down, major mining companies like BHP Group (formerly Australia’s largest listed company) have expressed concerns about declining demand after decades of growth. Sell side consensus aligns with large caps, offering the lowest 12-month price target returns.
Chart 5: Mid-caps offer highest consensus 12-month price target return

Source: Bloomberg, as at 28 August 2024.
Given historical performance and the most recent earnings, it would make sense for equity portfolios to be overweight mid-caps. However, given this is not the case, most passive and active Australian equity portfolios (which are mostly linked to the S&P/ASX 200 Index) are likely to have more significant exposure to large caps.
This is where an approach that better suits the dynamics of the Australian equities universe could be a better play. We believe a fund tracking mid-caps can offer investors better returns and greater sector diversification than the S&P/ASX 200.
Mid-caps tend to have experienced management teams, established brands and client bases, infrastructure and access to capital markets — advantages that small-caps often lack. At the same time, they can grow more quickly than their large-cap counterparts, benefiting from flatter management structures, entrepreneurial drive and quicker decision-making. This agility helps them to respond more quickly to market forces and opportunities.
With a mix of technology players, healthcare stocks, consumer discretionary companies, retailers and others, the mid-cap sector also has more exposure to a wide range of growth industries than large-caps, with no single sector dominating.
The VanEck S&P/ASX MidCap ETF (ASX: MVE) is the only ETF listed on the ASX that tracks the middle portion of the ASX equity universe. Through one trade, investors can access a portfolio of the 50 ‘middlest-est’ stocks and gain instant access to this ‘sweet spot’ of the Australian equity universe, with the companies representing a mix of established and still developing companies, and a balance between the spirit and youth of small-caps and the stability of large companies.
Key risks
An investment in MVE carries risks associated with: financial markets generally, individual company management, industry sectors, stock and sector concentration, fund operations and tracking an index. See the PDS for details. No member of the VanEck group of companies guarantees the repayment of capital, the payment of income, performance, or any particular rate of return from any fund.
Published: 05 September 2024
Any views expressed are opinions of the author at the time of writing and is not a recommendation to act.
VanEck Investments Limited (ACN 146 596 116 AFSL 416755) (VanEck) is the issuer and responsible entity of all VanEck exchange traded funds (Funds) trading on the ASX. This information is general in nature and not personal advice, it does not take into account any person’s financial objectives, situation or needs. The product disclosure statement (PDS) and the target market determination (TMD) for all Funds are available at vaneck.com.au. You should consider whether or not an investment in any Fund is appropriate for you. Investments in a Fund involve risks associated with financial markets. These risks vary depending on a Fund’s investment objective. Refer to the applicable PDS and TMD for more details on risks. Investment returns and capital are not guaranteed.
The S&P/ASX MidCap Index (the Index”) is a product of S&P Dow Jones Indices LLC or its affiliates (“SPDJI”) and ASX Limited (“ASX”) and licensed for use by VanEck. S&P® is a registered trademark of Standard & Poor’s Financial Services LLC (“S&P”); Dow Jones® is a registered trademark of Dow Jones Trademark Holdings LLC (“Dow Jones”); and these trademarks have been licensed for use by SPDJI and sublicensed by VanEck. The Fund is not sponsored, endorsed, sold or promoted by SPDJI, Dow Jones, S&P, their respective affiliates, or ASX and none of them makes any representation regarding the advisability of investing in the Fund. Such parties do not accept liability for any errors, omissions, or interruptions of the Index and do not give any assurance that the Fund will accurately track the performance of the index or provide positive investment returns. Inclusion of a security within the index or Fund is not a recommendation by any party to buy, sell, or hold such security.


