Identifying extraordinary companies among Australia’s small companies
For many, owning shares of companies with small market capitalisations feels closer to owning a piece of a small, private business, than buying stock in a publicly traded company. This business owner mentality serves investors well when buying small companies as it helps them think more about the business itself rather than focus on what the stock price does day to day. After all, investors who buy a stake in a private business don’t wake up every day wondering what the price of the business is that day to determine if they’re doing well or not. What they do, instead, is focus over time on what their equity in the business is worth as the company grows. So, why look at publicly traded companies any differently simply because stock prices fluctuate daily?
This is especially true for small capitalisation companies which can be in the early trajectory of their growth cycle. Many small companies can, of course, be in a downward trajectory as their fortunes fade and they fall from large to small caps, which makes it imperative for investors to focus on the quality of the businesses they own and not just their size.
MarketGrader’s mission is to help investors think about investing in public companies of all sizes with an owner’s mentality. But this is particularly important when selecting companies among small cap stocks, where understanding whether a company is growing and whether such growth accrues to its shareholders is vital in an enterprise’s early stages, when the margin for error is narrower than it is for large companies. With this mind, we have developed the MarketGrader Australia Small Cap 60 Index (MGAUSC), designed to help investors identify the companies among Australia’s small cap segment, which we believe have the greatest long-term potential for capital appreciation based on Marketgrader’s ‘GARP + Quality’ rating framework. So, if MarketGrader’s goal is to help investors think about this group of companies from an ownership lens, it only makes sense to understand whether the companies selected to MGAUSC since the Index’s inception have, in fact, built shareholder equity for their owners. This article examines the findings based on this simple premise.
The role of company selection in the MarketGrader Australia Small Cap 60 Index
Everyday MarketGrader calculates 24 indicators across four fundamental categories (Growth, Value, Profitability and Cash Flow) for all companies in its global coverage universe (about 40,000). The resulting 24 grades, which represent MarketGrader’s ‘GARP + Quality’ analysis, are then aggregated into a final score that ranges from zero (0) to one hundred (100), which forms the basis of the constituent selection for all MarketGrader indicies across global markets. In certain markets, including Australia, MarketGrader also calculates a proprietary Earnings Yield Score, used to rank all companies in the underlying investable universe, also used in the Index selection methodology.
Every March and September, during semi-annual rebalance dates, MarketGrader selects the top 60 small cap companies in Australia based on a combination of these two scores, which then become the new constituents of the MarketGrader Australia Small Cap 60 Index for the following six-month period. The investable universe from which these are selected is defined as the companies listed on ASX (Australian Securities Exchange) that rank 101stto 300thby free float market capitalisation (according to MarketGrader’s own ranking).
The base date of MGAUSC is 31 December 2007, which means that, including the original selection, MGAUSC has been reconstituted 34 times (twice per year) as of this writing [Note: This does not include the most recent September reconstitution and rebalance.] Historically, it has turned over, on average, 33% of its constituents at every rebalance, or 20 companies. And given that the underlying universe is limited to 200 companies, the chance of any company being selected to the Index is three in ten, or 30%. However, the Index methodology also applies stringent liquidity criteria, further limiting the underlying selection universe. When this is considered, the actual chances of being selected to MGAUSC are slightly greater than one in three, or 33%.
Keeping this in mind, over the 34 times that MGAUSC has been reconstituted to date, 388 unique companies have been a part of the Index. Among these there is a select group of just 62 companies (16%) that have spent five years or more in the Index, which we refer to as the ‘Extraordinaries,’ for the consistency with which they have been ranked among the best companies in the Australia small cap universe over a long period of time.
We believe these Extraordinaries are responsible for much of the Index’s performance since inception, so we decided to focus our analysis on them. Furthermore, coming back to the premise about the importance for investors in small caps to think of themselves as owners of these businesses, we seek to answer two questions from the perspective of this select group of stocks. First, have these companies been truly extraordinary in building long-term value in the form of shareholder equity for their owners? And, assuming they have, has this translated into superior returns for the overall index?
Australia’s Extraordinary small caps
The ‘Extraordinaries’ can be divided into two groups: 37 companies that for various reasons we’ll discuss shortly are no longer members of MGAUSC, and 25 companies that are still members of the Index. Before we look at both groups, it’s worth looking at the complete list of 62 ‘Extraordinaries.’ Figure 1 presents the number of times that the ‘extraordinaries’ have been members of MGAUSC and the total number of months they spent in the Index. A single company, Tassal Group Limited (TGR.AU) has been a member of MGAUSC 28 times, or the equivalent of 14 years (until it was acquired in November of 2022). Seven companies have spent at least 10 years in the Index.
Figure 1. The Australia ‘Extraordinaries’ by number of times selected to MGAUSC, Jan 2008 through Aug 2024
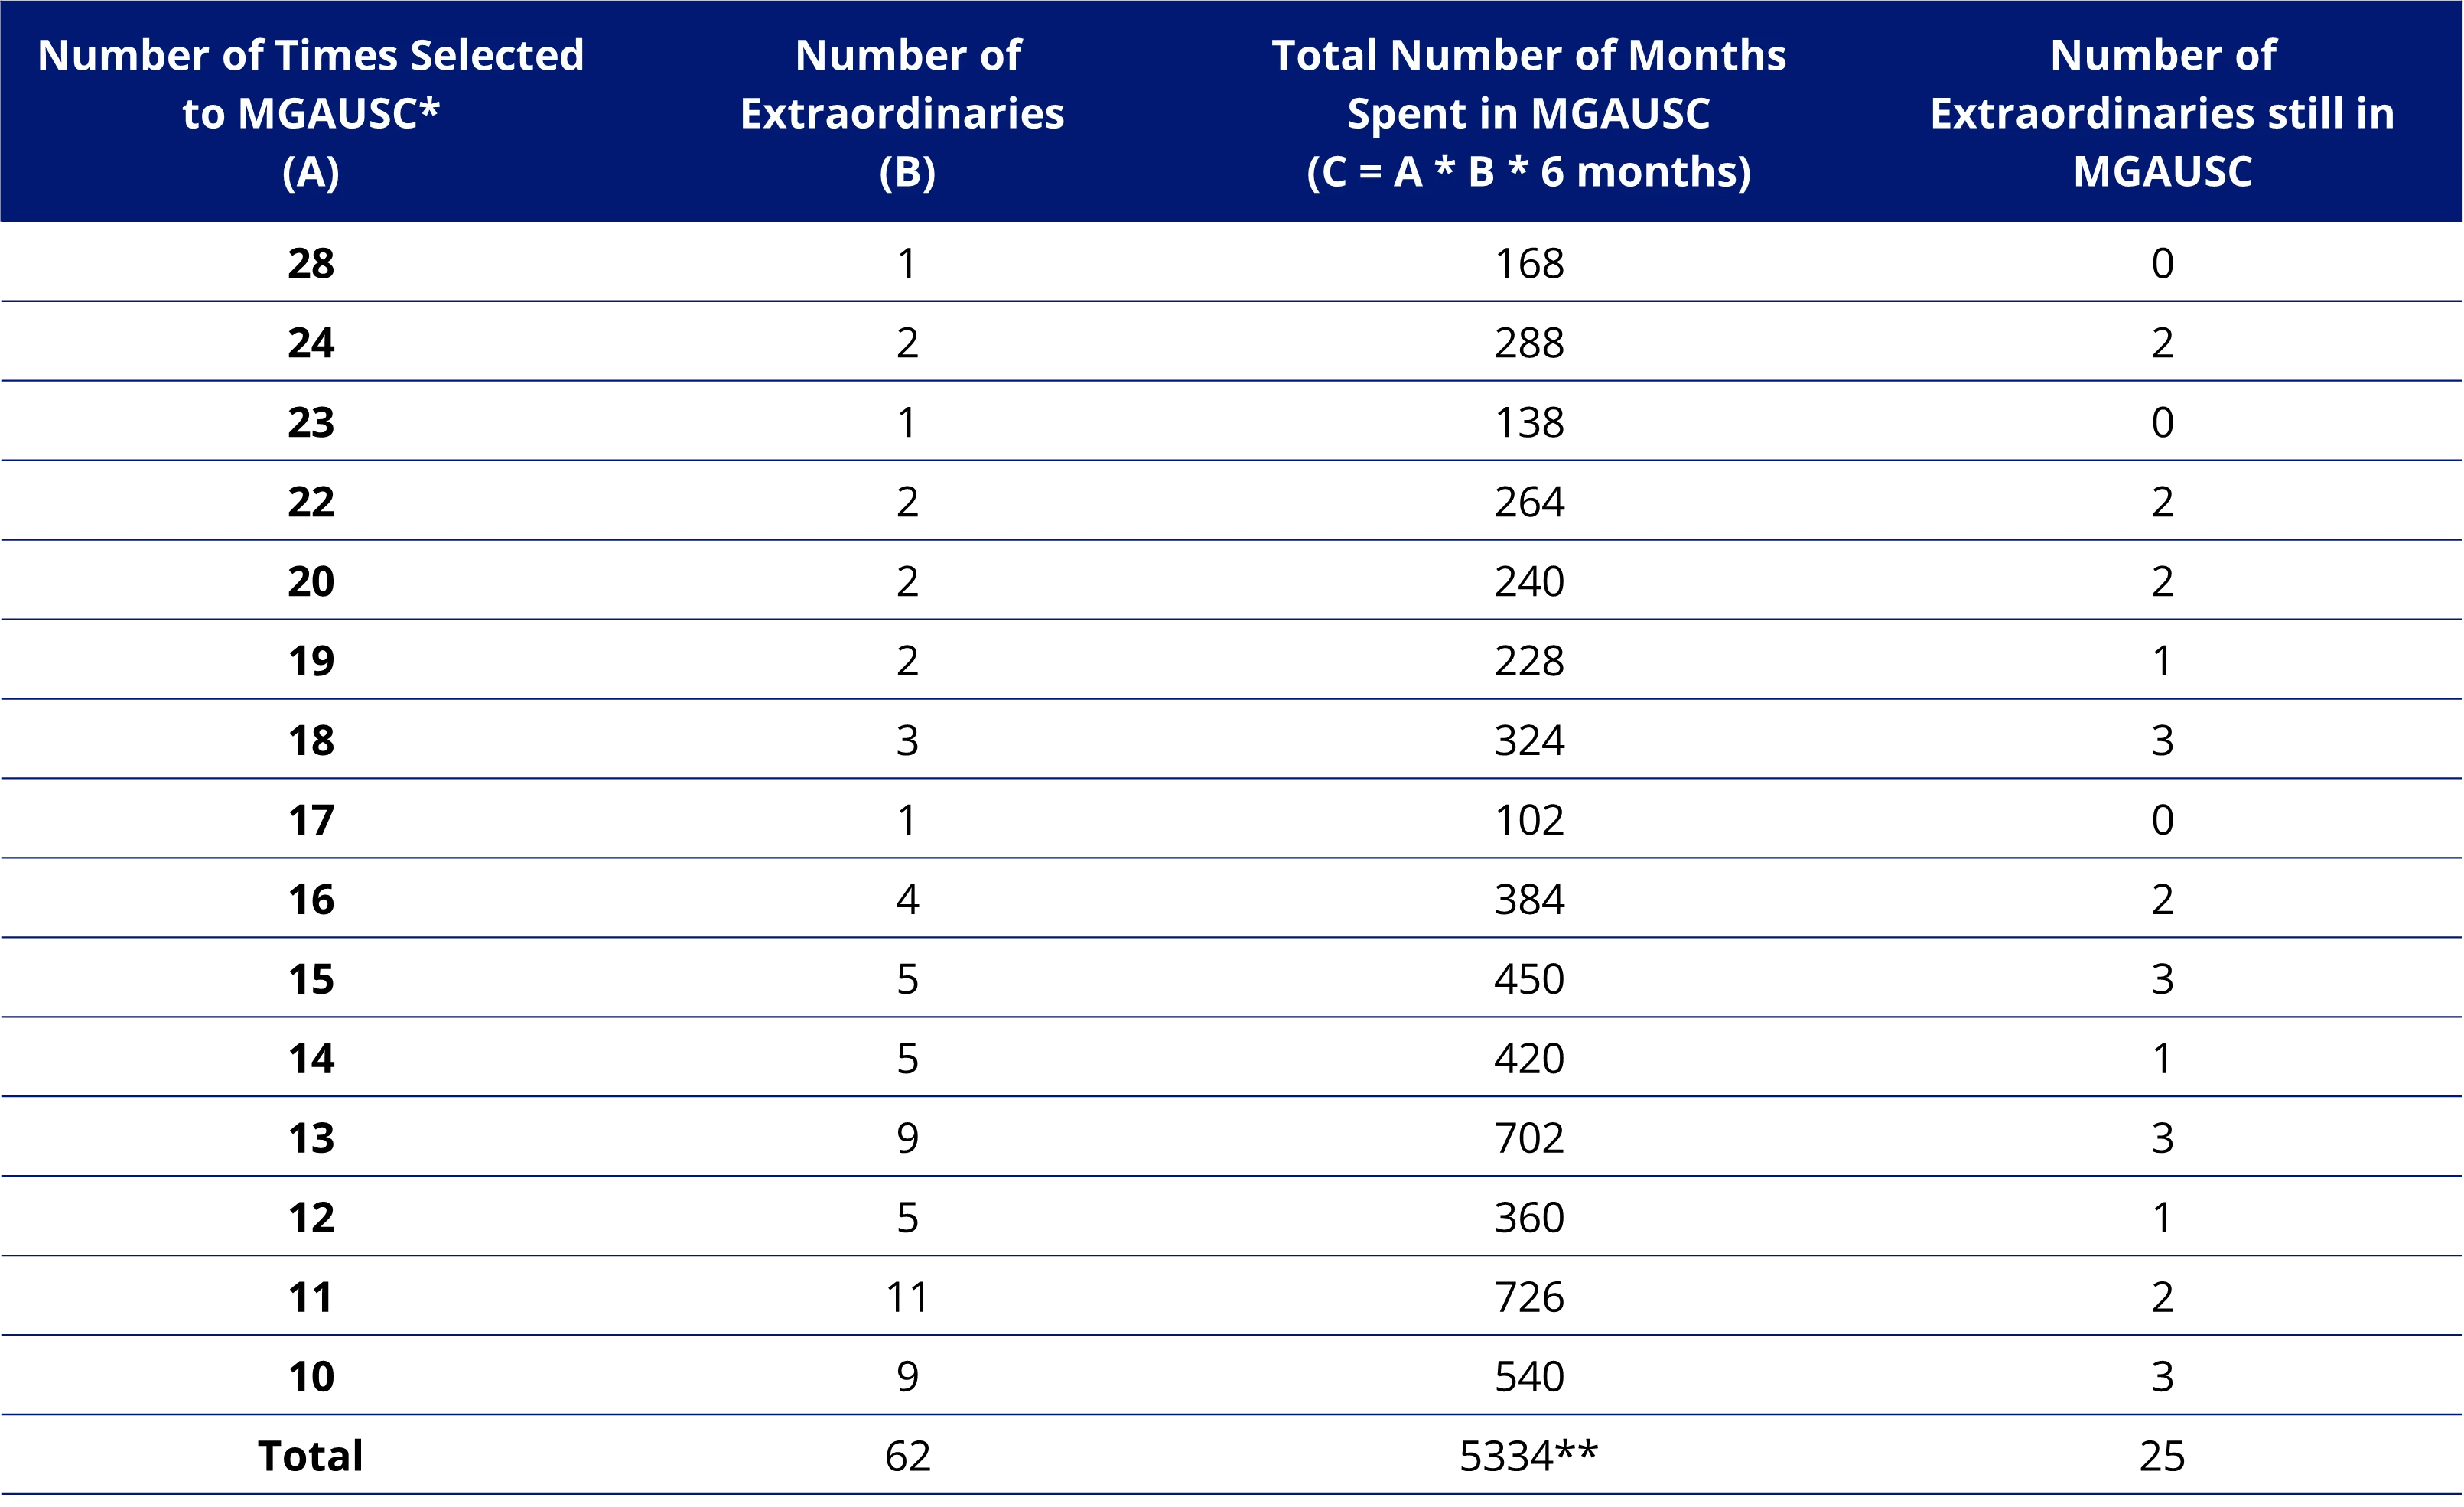
*Maximum number of times a company can be selected to the Index is 34 which is the total number of selections through the end of Aug. 2024. **The total number of months spent by all 60 components in the Index over the period under consideration is 12,000 months. This is equal to 200 months (the total number months covered in this starting in Jan. 2008 through Aug. 2024) times the 60 components of the Index.
Notably, while the 62 ‘Extraordinaries’ account for only about 15% of all companies selected to MGAUSC over 17 years, they account for 5,298 months in the Index out of 12,000 months available for all 60 constituents selected every six months. In other words, 16% of the all companies that have been index constituents since inception have accounted for 44% of the entire time period since its inception date (5,334 months of 12,000 total months).
What also makes MGAUSC different is that this is an equally weighted index. This is important because it means, irrespective of size, each company has the potential to impact the Index’s return. Since MarketGrader’s objective it to help investors build long-term wealth, it only makes sense to measure whether these companies have grown their shareholders’ equity since MarketGrader first identified them.
Shareholder equity is the total sum of three components: the value of all outstanding shares (common and preferred), dividends paid out as cash and retained earnings. Simply put, shareholder equity is equal to the difference between a company’s total assets and total liabilities. It therefore follows that assuming liabilities are constant and the shareholder equity of a company exhibits an increase from one year to the next, then either (a) the value of all shares increased, meaning an increase in the price/share or a positive price return, or (b) the company paid out cash dividends, or (c) the company’s retained earnings increased, or some combination of all three. Whatever the reason(s) may be, an increase in the shareholder equity should be the reason investors buy equities in the long run. So, based on this definition of successful long-term growth, how did the ‘Extraordinaries’ do?
Group 1 – Extraordinaries no longer in MGAUSC
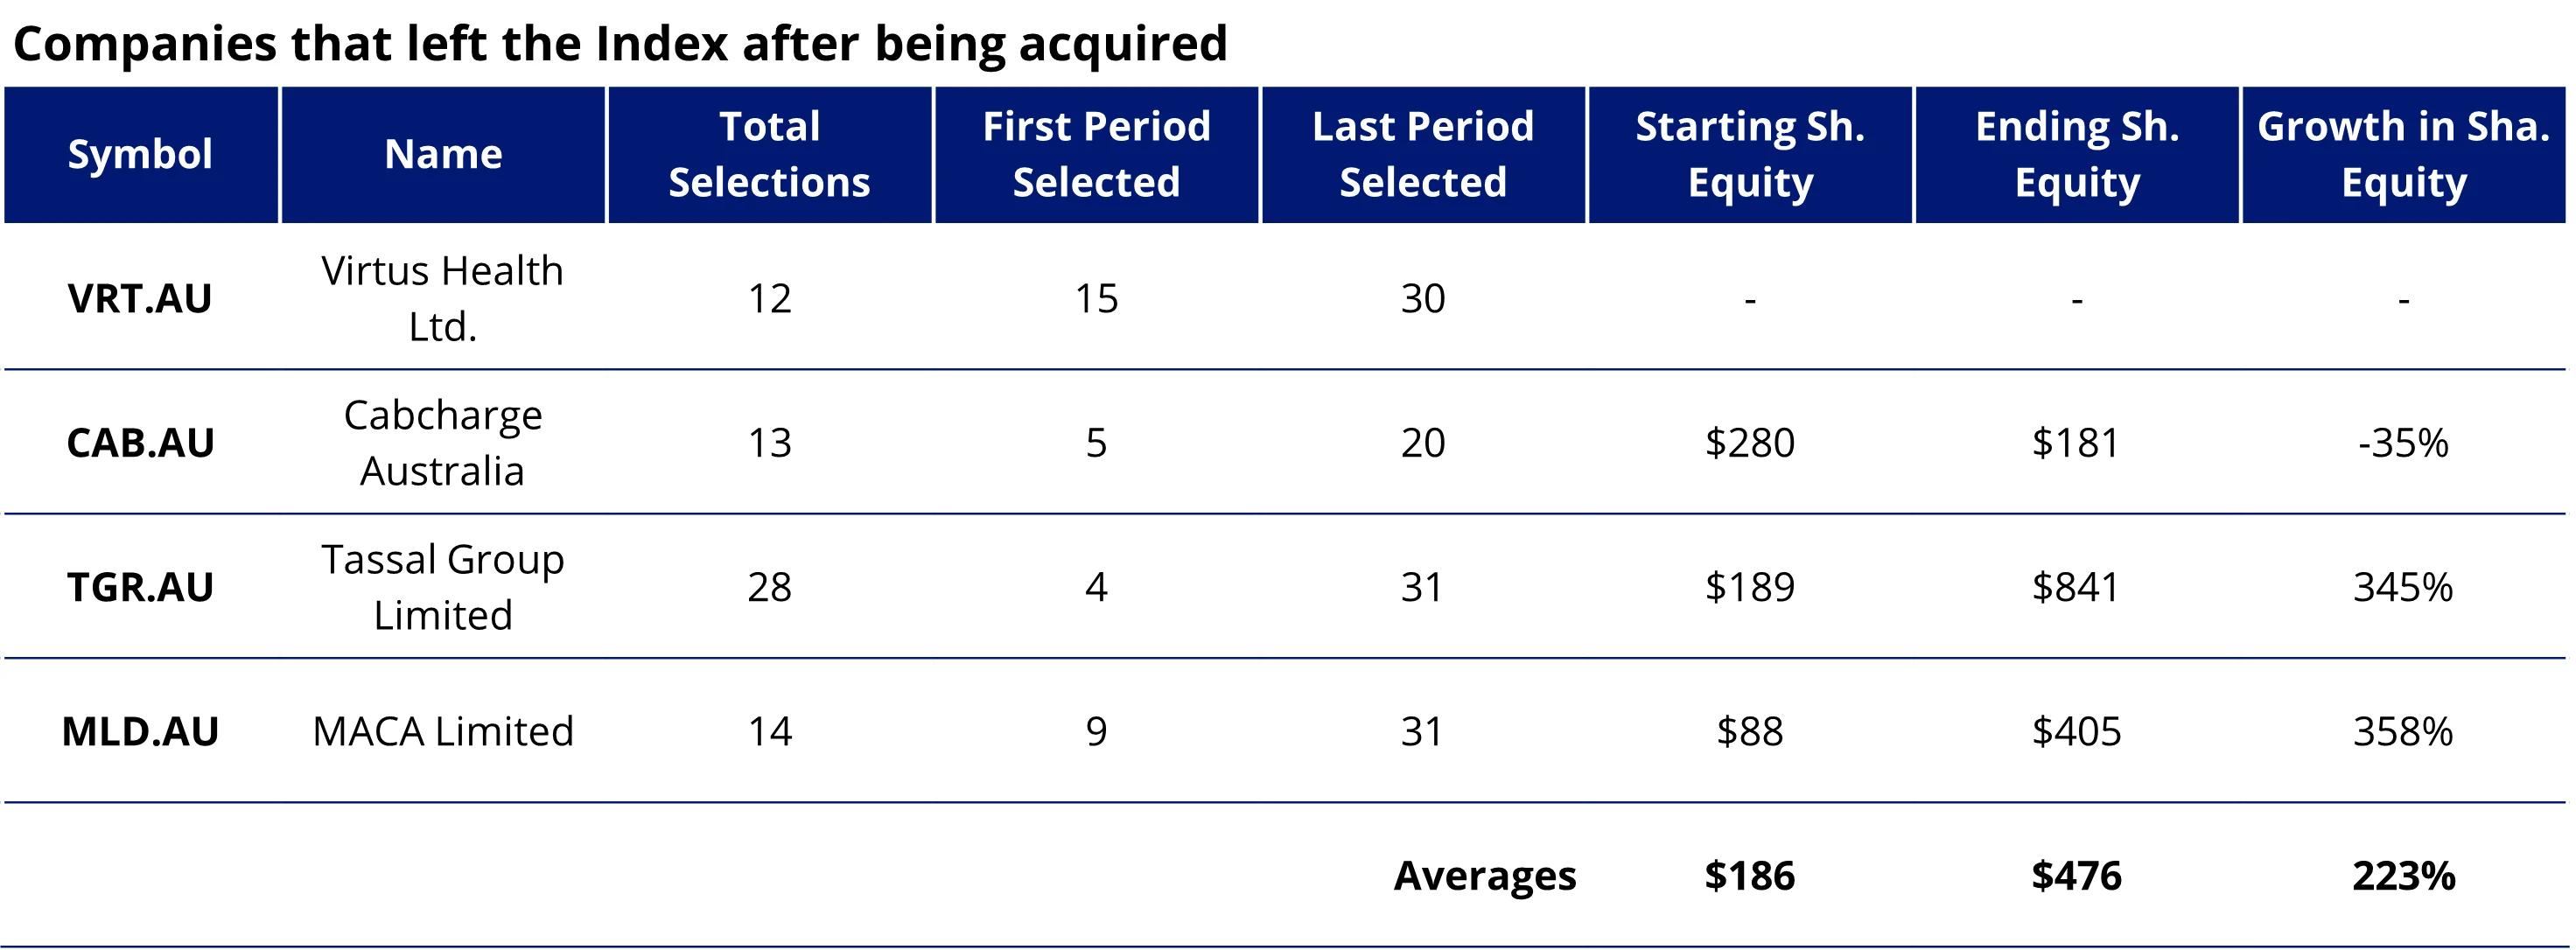
First, we look at the group of 37 ‘Extraordinaries’ that are no longer members of the Index. They are divided into four buckets based on the reason they are no longer index constituents. The first bucket includes four companies that have been acquired and are therefore no longer listed on ASX. Their shareholder equity grew an average of 223% from the time they were first selected to MGAUSC to the time they left the Index (because of the acquisition)1.
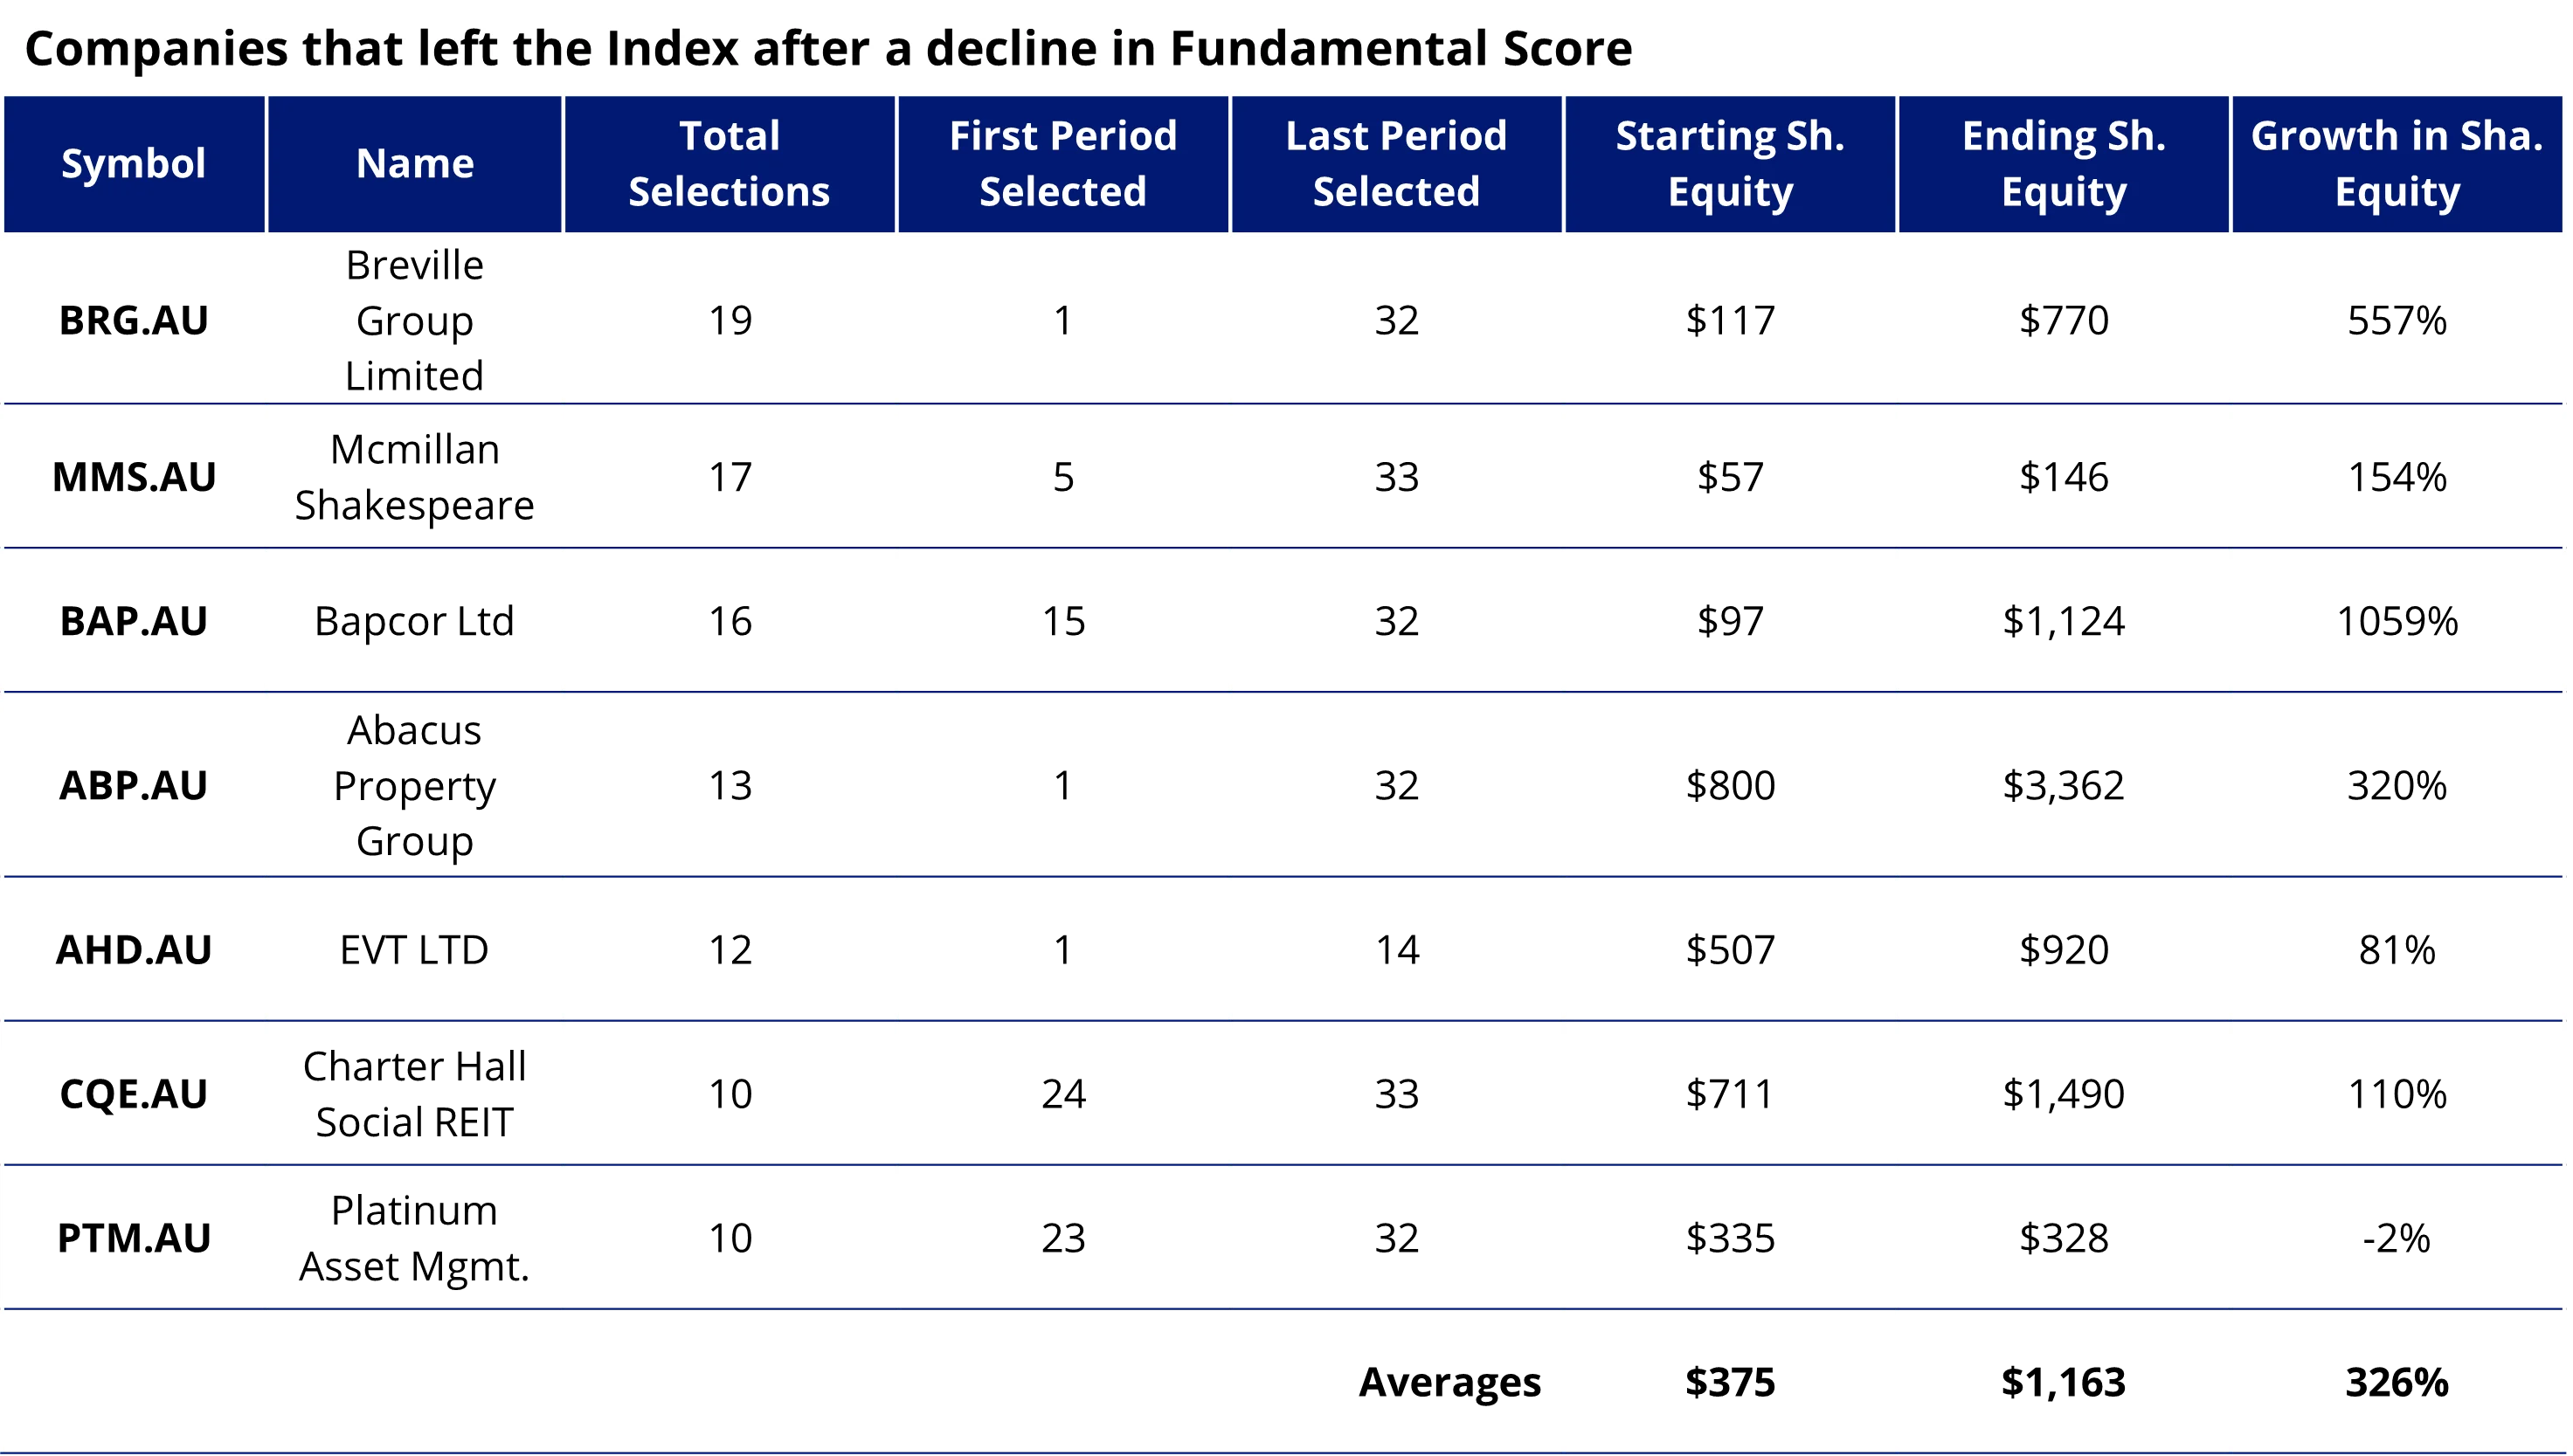
The second bucket includes seven companies that no longer make the grade to be included into the Index. Nevertheless, as members of MGAUSC they were great contributors to the Index as measured by their growth in shareholder equity. These seven companies saw their shareholder equity grow from an average of A$375 million to A$1,163 million, with average growth in shareholder equity of 326%2.
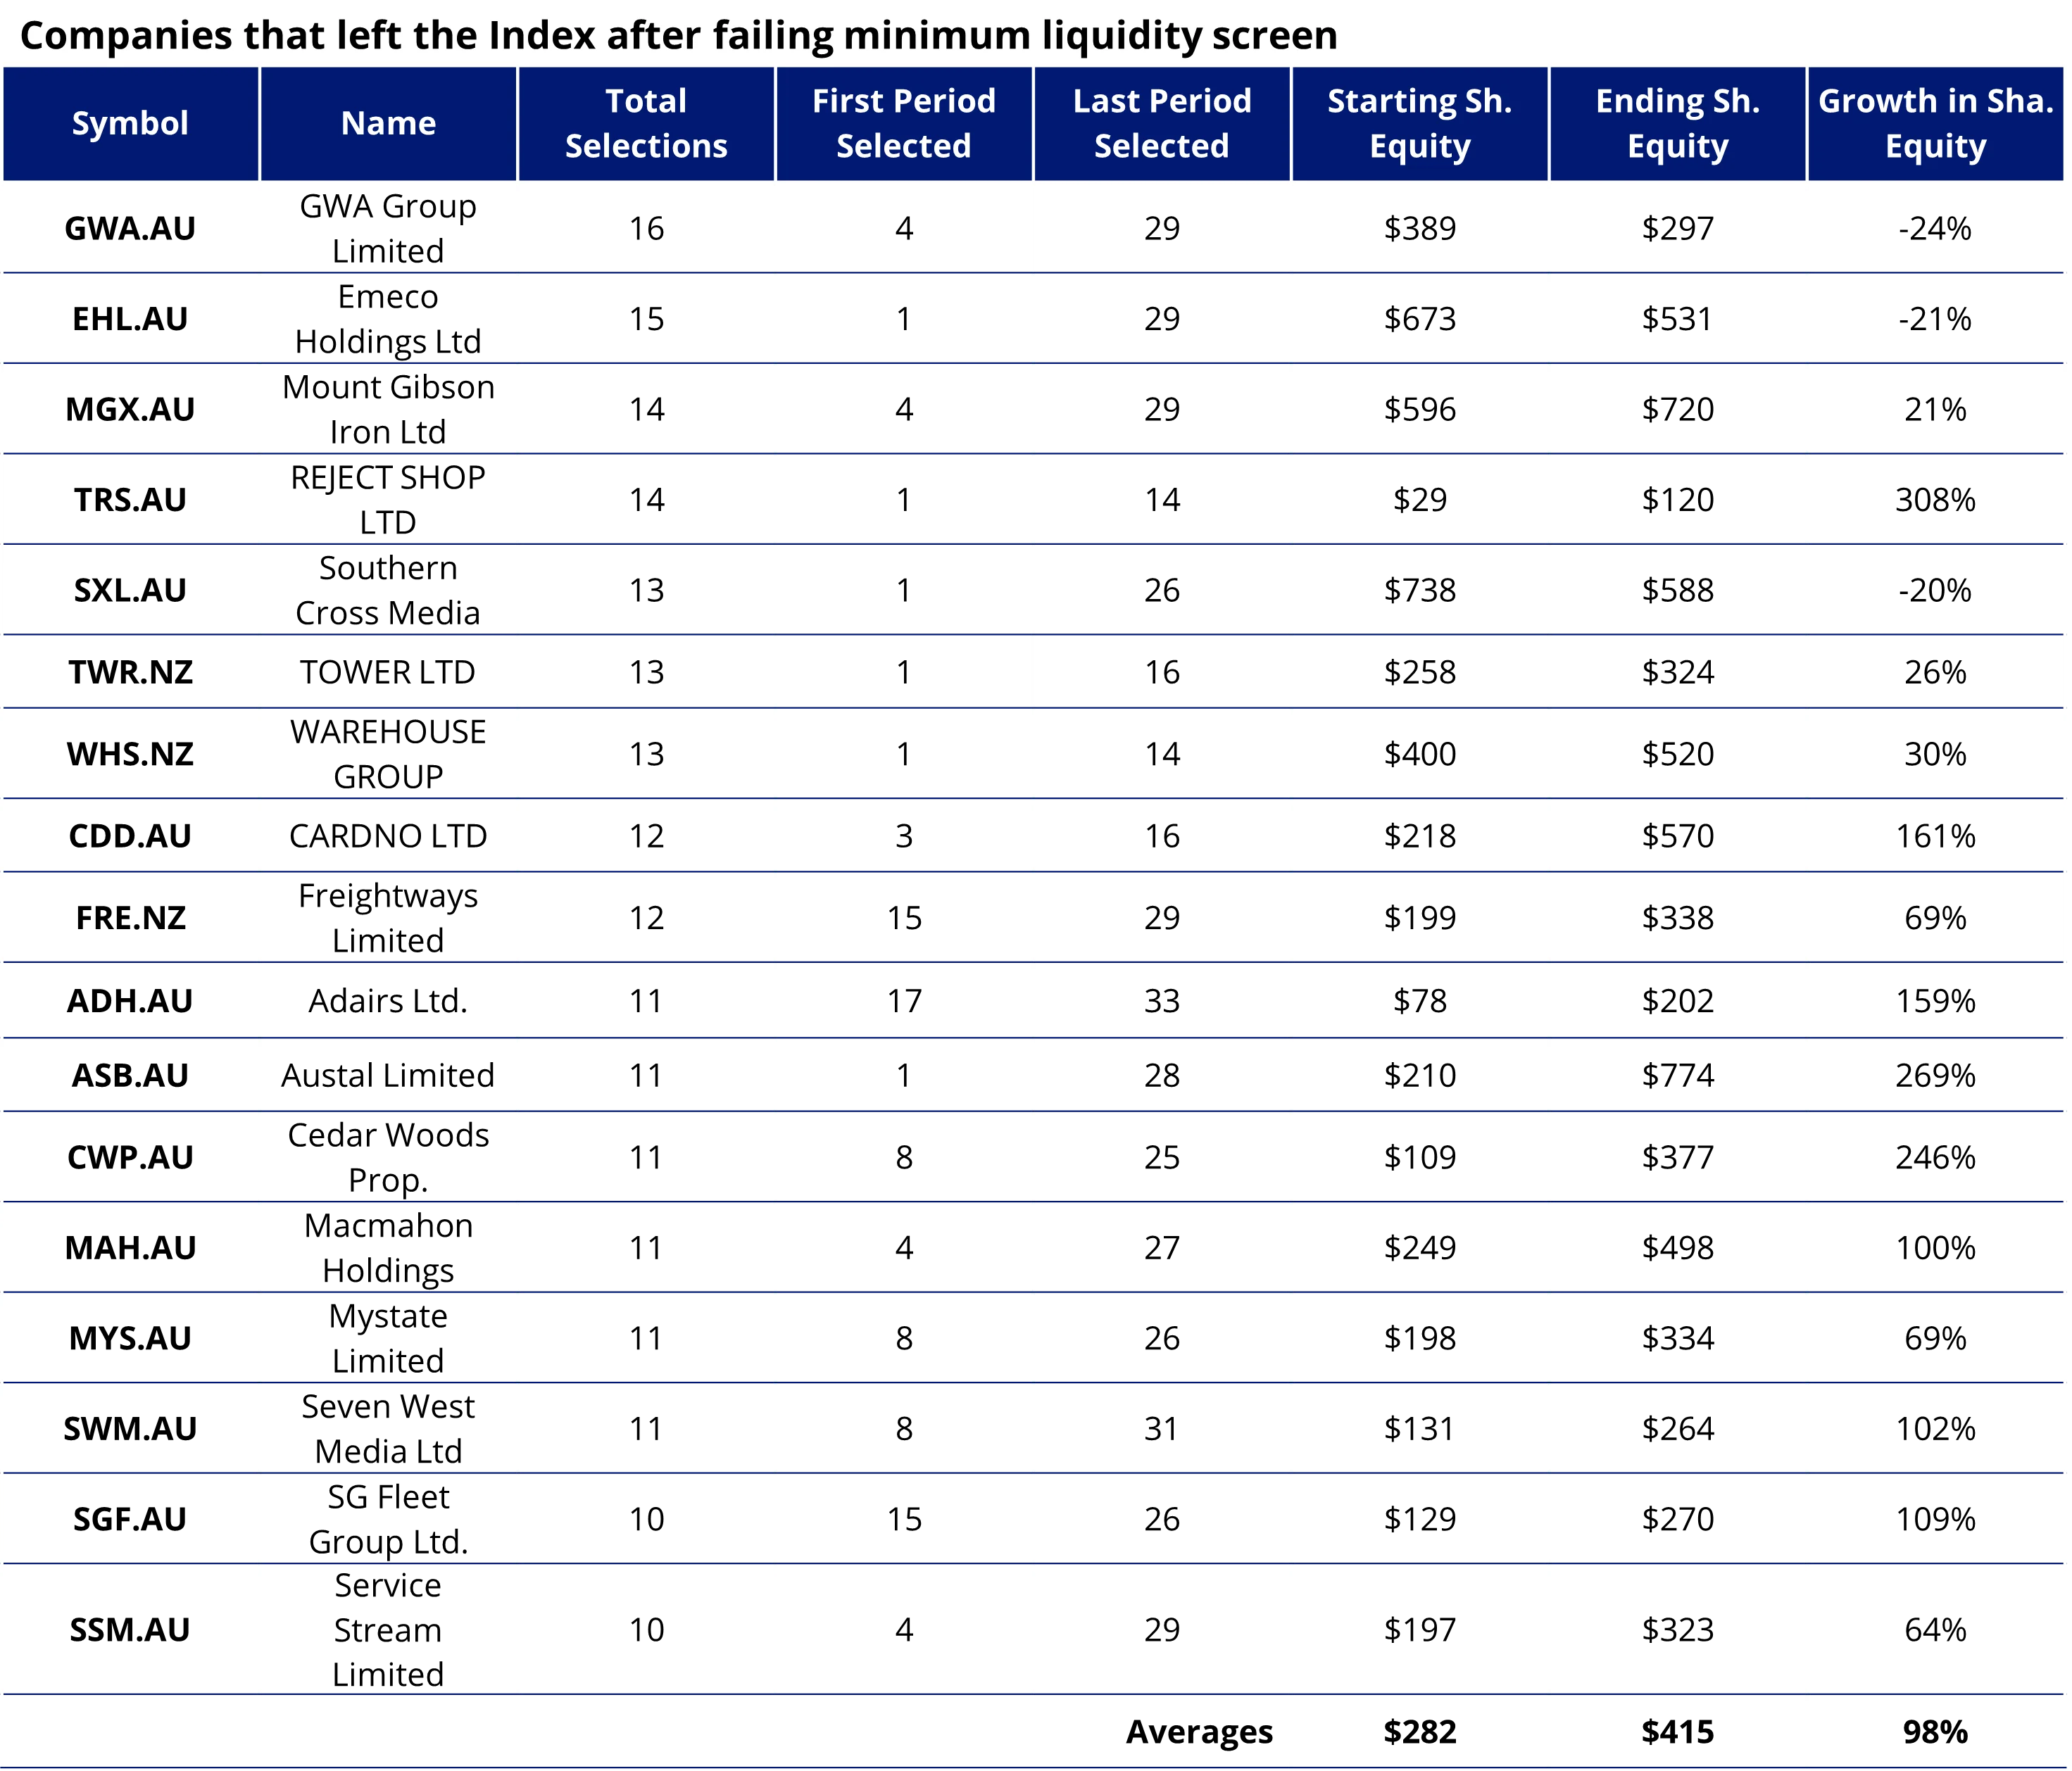
The third bucket includes 17 companies that no longer meet the Index’s strict liquidity screen (of at least US$1 million traded daily on average, over a three-month period). This group saw the lowest growth in shareholder equity of the four buckets, with average growth of 98% from the first to the last period each one was selected to MGAUSC.
Lastly, the fourth bucket includes the types of companies that investors tracking MGAUSC will want to see regularly in the future: those which “graduate” into the large cap universe of Australian stocks, thus no longer eligible for selection to the small cap index. This group included nine companies, whose shareholder equity grew by an average of 242% since MarketGrader first selected them to MGAUSC until they were removed based on size. Figure 2 shows the complete list of ‘Extraordinaries’ no longer in the Index, divided into four buckets.
Here it’s worth noting that in the Index’s 17-year history there were plenty more instances of companies “graduating” to the large cap universe than just the nine companies within the ‘extraordinaries’ cohort referenced above. Since MGAUSC’s base date at the end of 2007 there were 65 instances in which index members outgrew the small cap universe.3
Figure 2. Extraordinaries that are no longer constituents of MGAUSC by sub-category
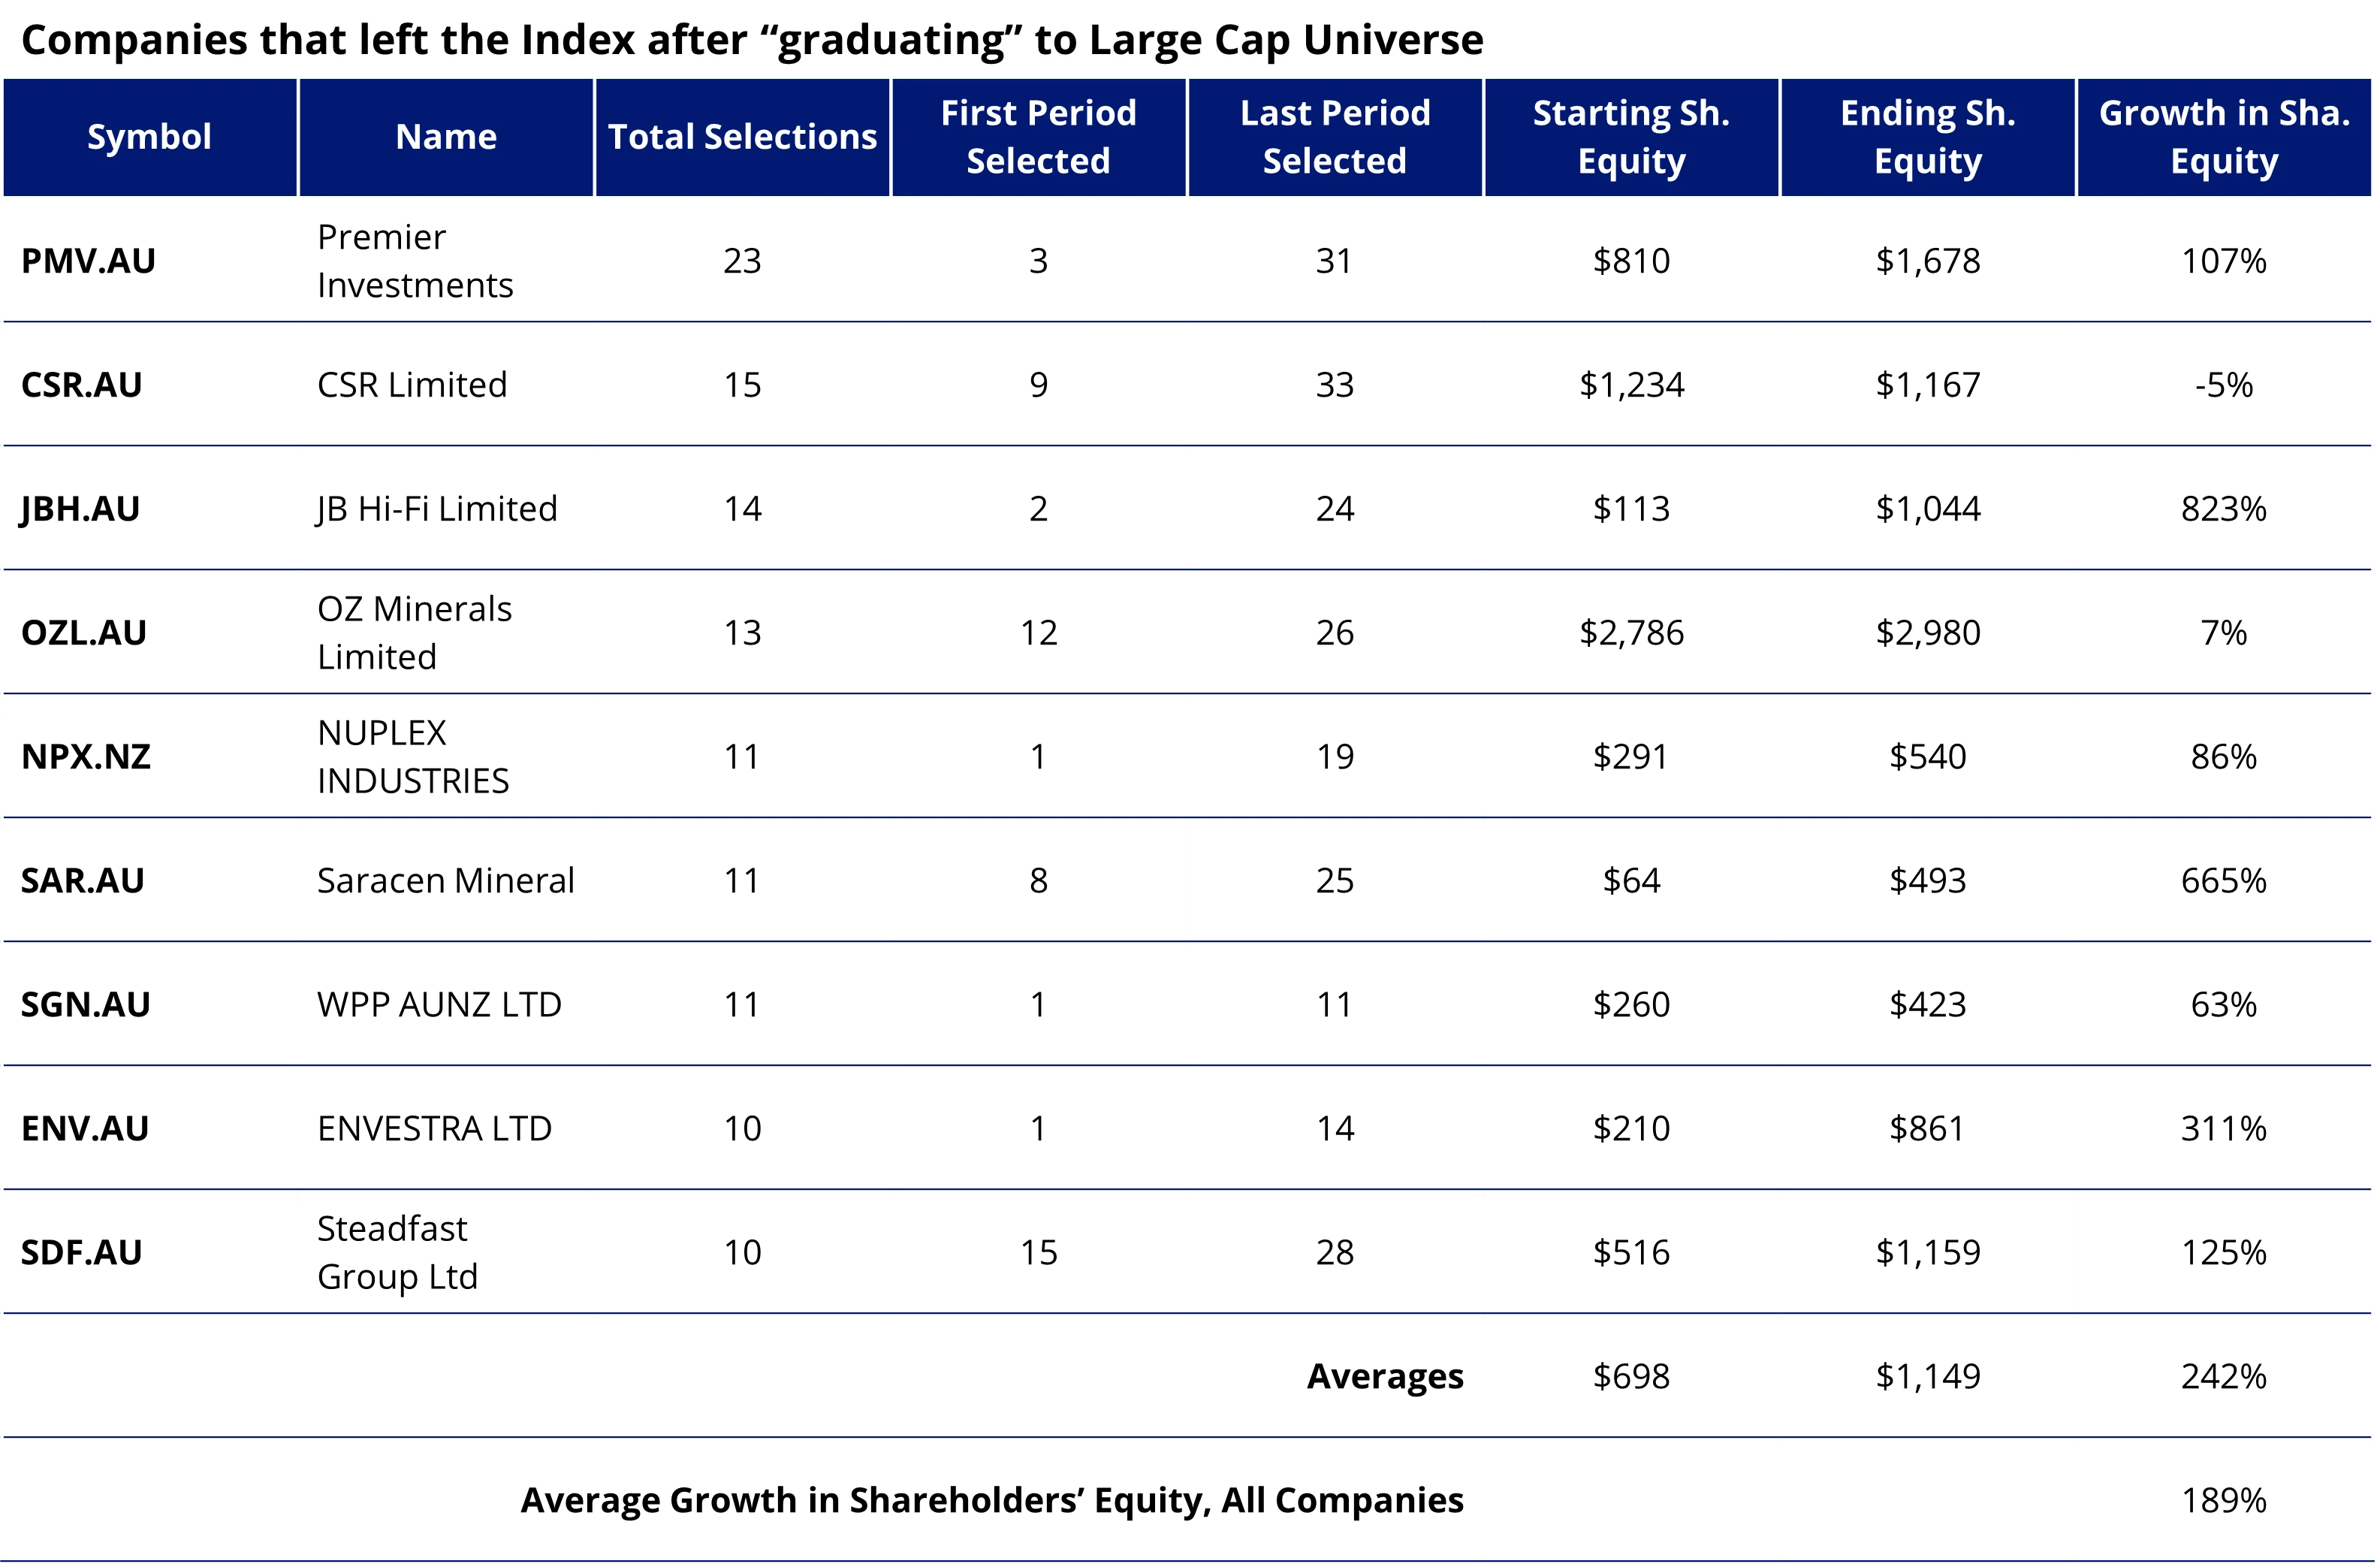
All shareholder’s equity values are in AUD. Source: FactSet. Past performance is not indicative of future performance.
Group 2 – Extraordinaries still in MGAUSC
As noted above, 25 of the 62 ‘Extraordinaries’ are members of the current Index. In other words, 42% of the current constituents are ‘Extraordinaries,’ an auspicious fact for investors tracking MGAUSC today. When these companies were first selected by MarketGrader to the Index (at different times, of course), their average shareholders’ equity was A$173 million. Today that average has ballooned to A$865 million, and the average growth in shareholders’ equity across time has been an astounding 1,802%. Figure 3 displays the list of ‘Extraordinaries’ still in the Index.
Figure 3. Extraordinaries that are still members of MGAUSC, through August 2024
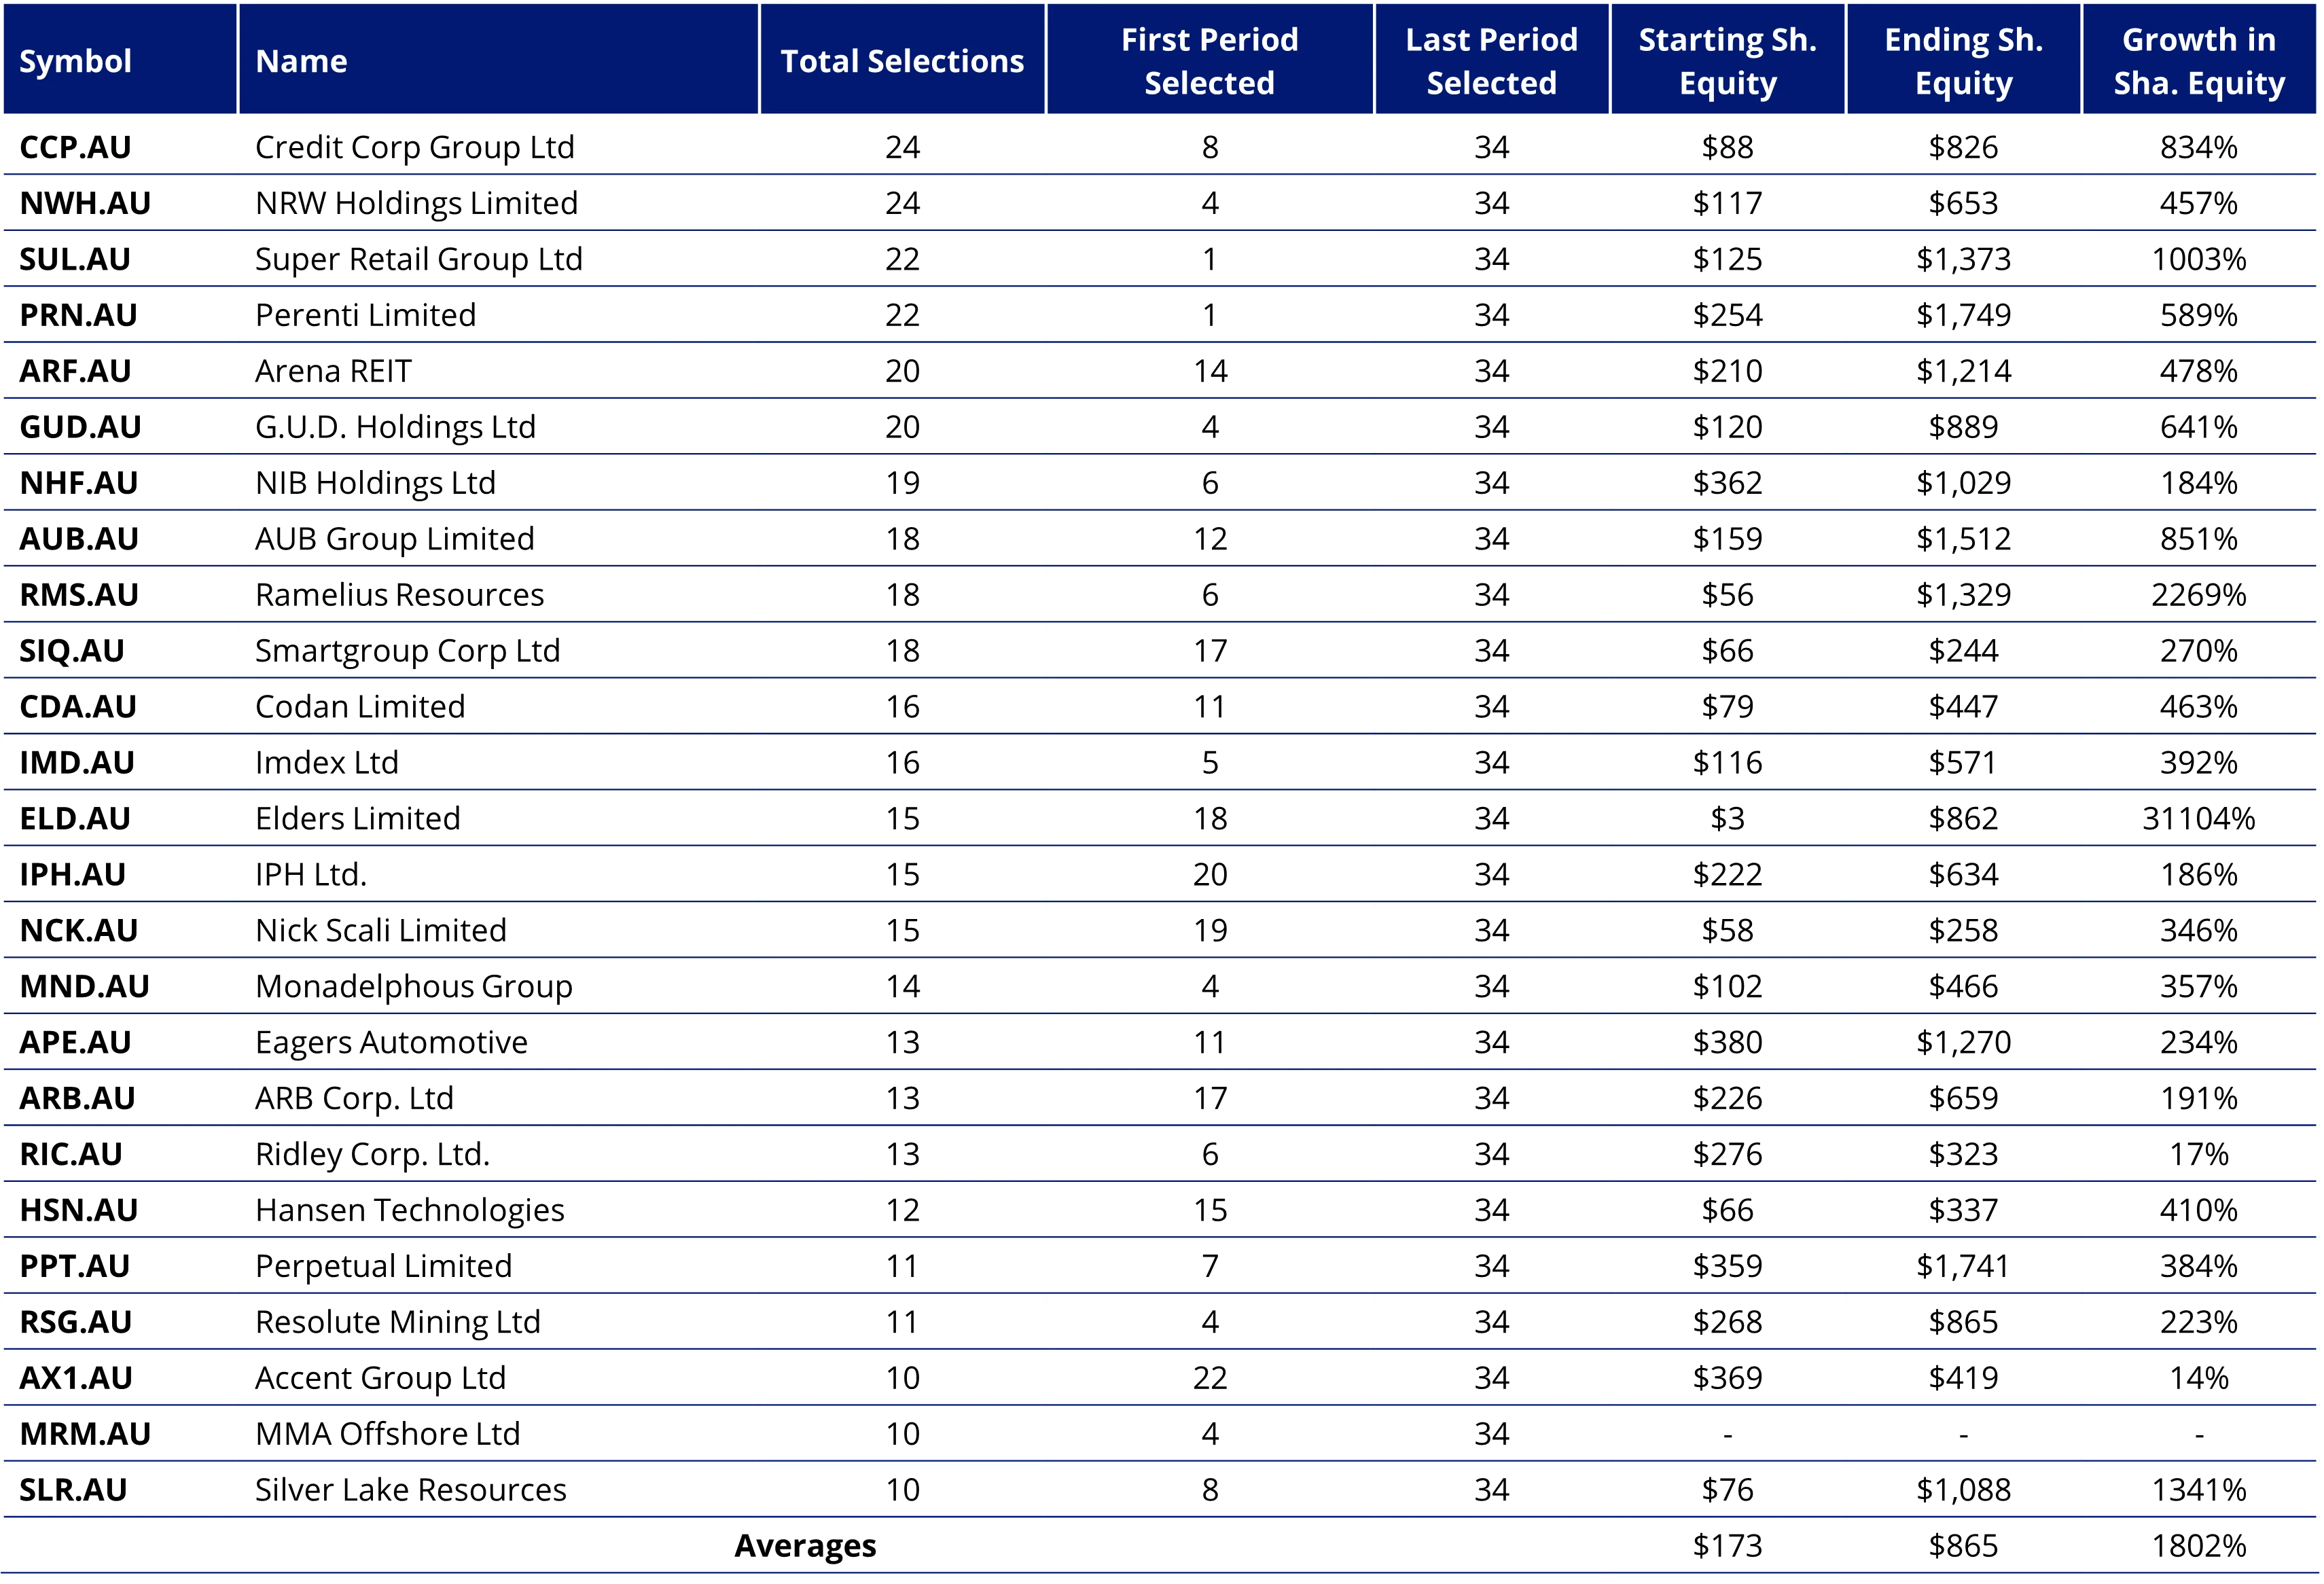
All shareholders’ equity values are in AUD. Source: FactSet. Past performance is not indicative of future performance.
Translating the Extraordinaries growth into returns
MVS now tracks MGAUSC. Based on its modelled performance, MGAUSC has historically outperformed the S&P/ASX Small Ordinaries Index, remembering that past performance is not a reliable indicator of future performance.
Figure 4: Modelled index performance

Source: Morningstar, MarketGrader. MarketGrader Australia Small Cap 60 Index base date is 31 December 2007. The MarketGrader Australia Small Cap 60 Index was launched on 30 August 2024. Data prior to the launch date is back-tested. You cannot invest directly in an index. Past performance of the index is not a reliable indicator of future performance of MVS.
The S&P/ASX Small Ordinaries Index (“Small Ords”) is shown for comparison purposes as it is the widely recognised benchmark used to measure the performance of the 200 ASX-listed companies included in the S&P/ASX 300 but not in the S&P/ASX 100, weighted by market capitalisation. The MarketGrader Small Cap 60 Index measures the performance of a portfolio of 60 small-cap companies, 60 Australian small companies with the best growth at a reasonable price (GARP) attributes and the highest earnings yield at rebalance. It has fewer securities and different industry allocations than the Small Ords. ‘Click here for more details’
We think that MGAUSC’s group of ‘Extraordinaries’ were the drivers of the significant alpha identified in the table above.
Sources
1This average is based on only three stocks for which we had historical shareholders’ equity figures.
2The calculation of shareholders’ equity growth is based on the change in total shareholder’s equity when each stock was first selected to the Index, through the last period it was selected. Any periods “skipped” in between are not excluded from the calculation.
3The list includes 44 unique companies that jumped size universe, with some jumping in and out multiple times. That several of them graduated to large caps multiple times is explained by the fact that, as the broad Australian equity universe grows, so does the market cap of all companies in it; or said differently, the growth in market caps across the universe meant that the cutoff point between large caps (the 100 largest companies) and small caps (the next 200 companies) keeps moving up over time. And when a member of MGAUSC breached the cutoff, at subsequent selections the company would be considered a large cap, no longer eligible for selection to the Index. So, as the cutoff rises, a few companies might dip back into the small cap universe not necessarily because they stopped growing, but rather because their market cap did not rise in each period as fast as the cutoff market cap did.
Published: 15 October 2024
Any views expressed are opinions of the author at the time of writing and is not a recommendation to act.
VanEck Investments Limited (ACN 146 596 116 AFSL 416755) (VanEck) is the issuer and responsible entity of all VanEck exchange traded funds (Funds) trading on the ASX. This information is general in nature and not personal advice, it does not take into account any person’s financial objectives, situation or needs. The product disclosure statement (PDS) and the target market determination (TMD) for all Funds are available at vaneck.com.au. You should consider whether or not an investment in any Fund is appropriate for you. Investments in a Fund involve risks associated with financial markets. These risks vary depending on a Fund’s investment objective. Refer to the applicable PDS and TMD for more details on risks. Investment returns and capital are not guaranteed.
MVS tracks the MarketGrader Australian Small Cap 60 Index. "MarketGrader" And “MarketGrader Australian Small Cap 60 Index” are trademarks of MarketGrader.com Corporation. MarketGrader does not sponsor, endorse, sell or promote the Fund and makes no representation regarding the advisability of investing in the Fund. The inclusion of a particular security in the Index does not reflect in any way an opinion of MarketGrader or its affiliates with respect to the investment merits of such security.


