This reporting season’s mid-strength flavour
Mid-strength is associated with less alcohol content than full strength but more alcohol than light beer. Mid-strength retains the taste and flavours of full strength without being overwhelmed by alcohol. Likewise, in investing, mid-caps offer the best of both small and mega-caps, representing a mix of established and still developing companies and a balance between the spirit and youth of small-caps and the stability of large companies without being overwhelmed by the mega-caps. In Australia, mega-caps can dominate, and as we are seeing this reporting season, that is not always good for investors.
August has been a month of ups and downs. Mostly downs. First equity markets plunged as investors became spooked about a US recession. Geopolitics and uncertainty also weighed on markets. The result was a ‘rotation’ away from mega-caps.
In Australia, the August reporting season commenced. Results so far have been mixed, mostly surprising on the upside (though some of the forecasts were grim), with a few notable misses.
Chart 1: S&P/ASX 200 beats versus misses
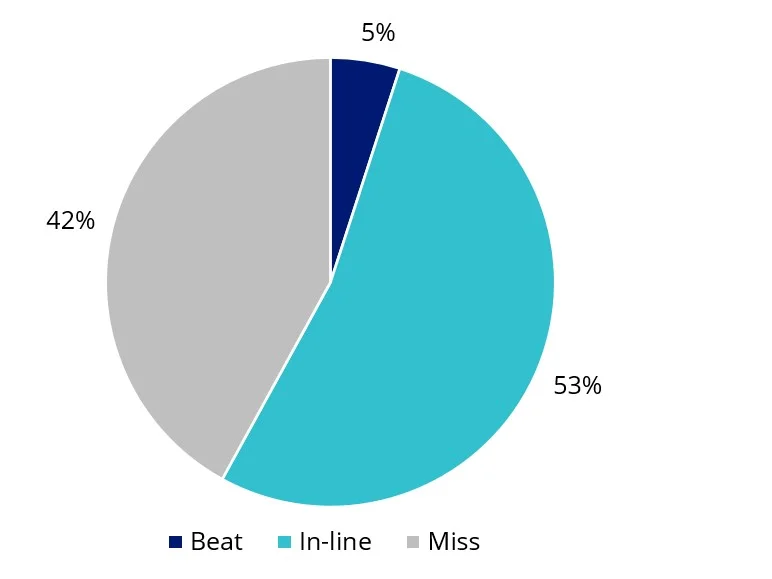
Chart 2: Net beats by size
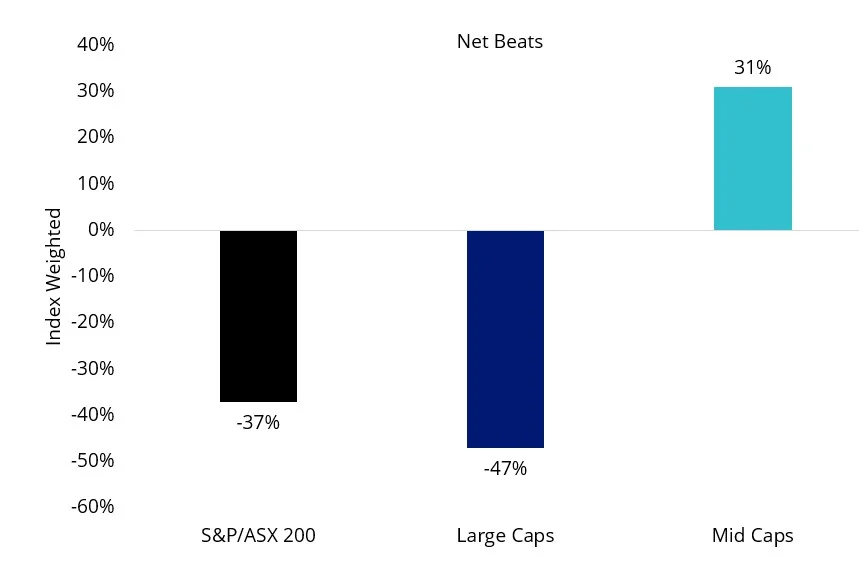
Charts 1 & 2, as at 14 August 2024: Source Bloomberg, ASX, S&P, VanEck
If we analyse the returns of the S&P/ASX Index series, we may be able to gauge how the market is processing these results, and how it is positioning for the next stage of the economic cycle.
According to S&P, “The S&P/ASX equity index series includes the S&P/ASX 200, the S&P/ASX 300, the S&P/ASX 20, the S&P/ASX 50, and the S&P/ASX 100. This series also contains component indices that represent the Australian market capitalisation hierarchy, and tax-aware indices that account for franking credits. The component indices include the S&P/ASX Small Ordinaries and the S&P/ASX MidCap 50.”
Since its launch in 2000, the S&P/ASX MidCap 50 index has outperformed the other indices in the S&P/ASX equity series. The S&P/ASX 20,50,100,200 & 300 have all returned roughly the same, while the S&P/ASX Small Caps has underperformed.
Chart 3: Performance April 2000 to August 2024
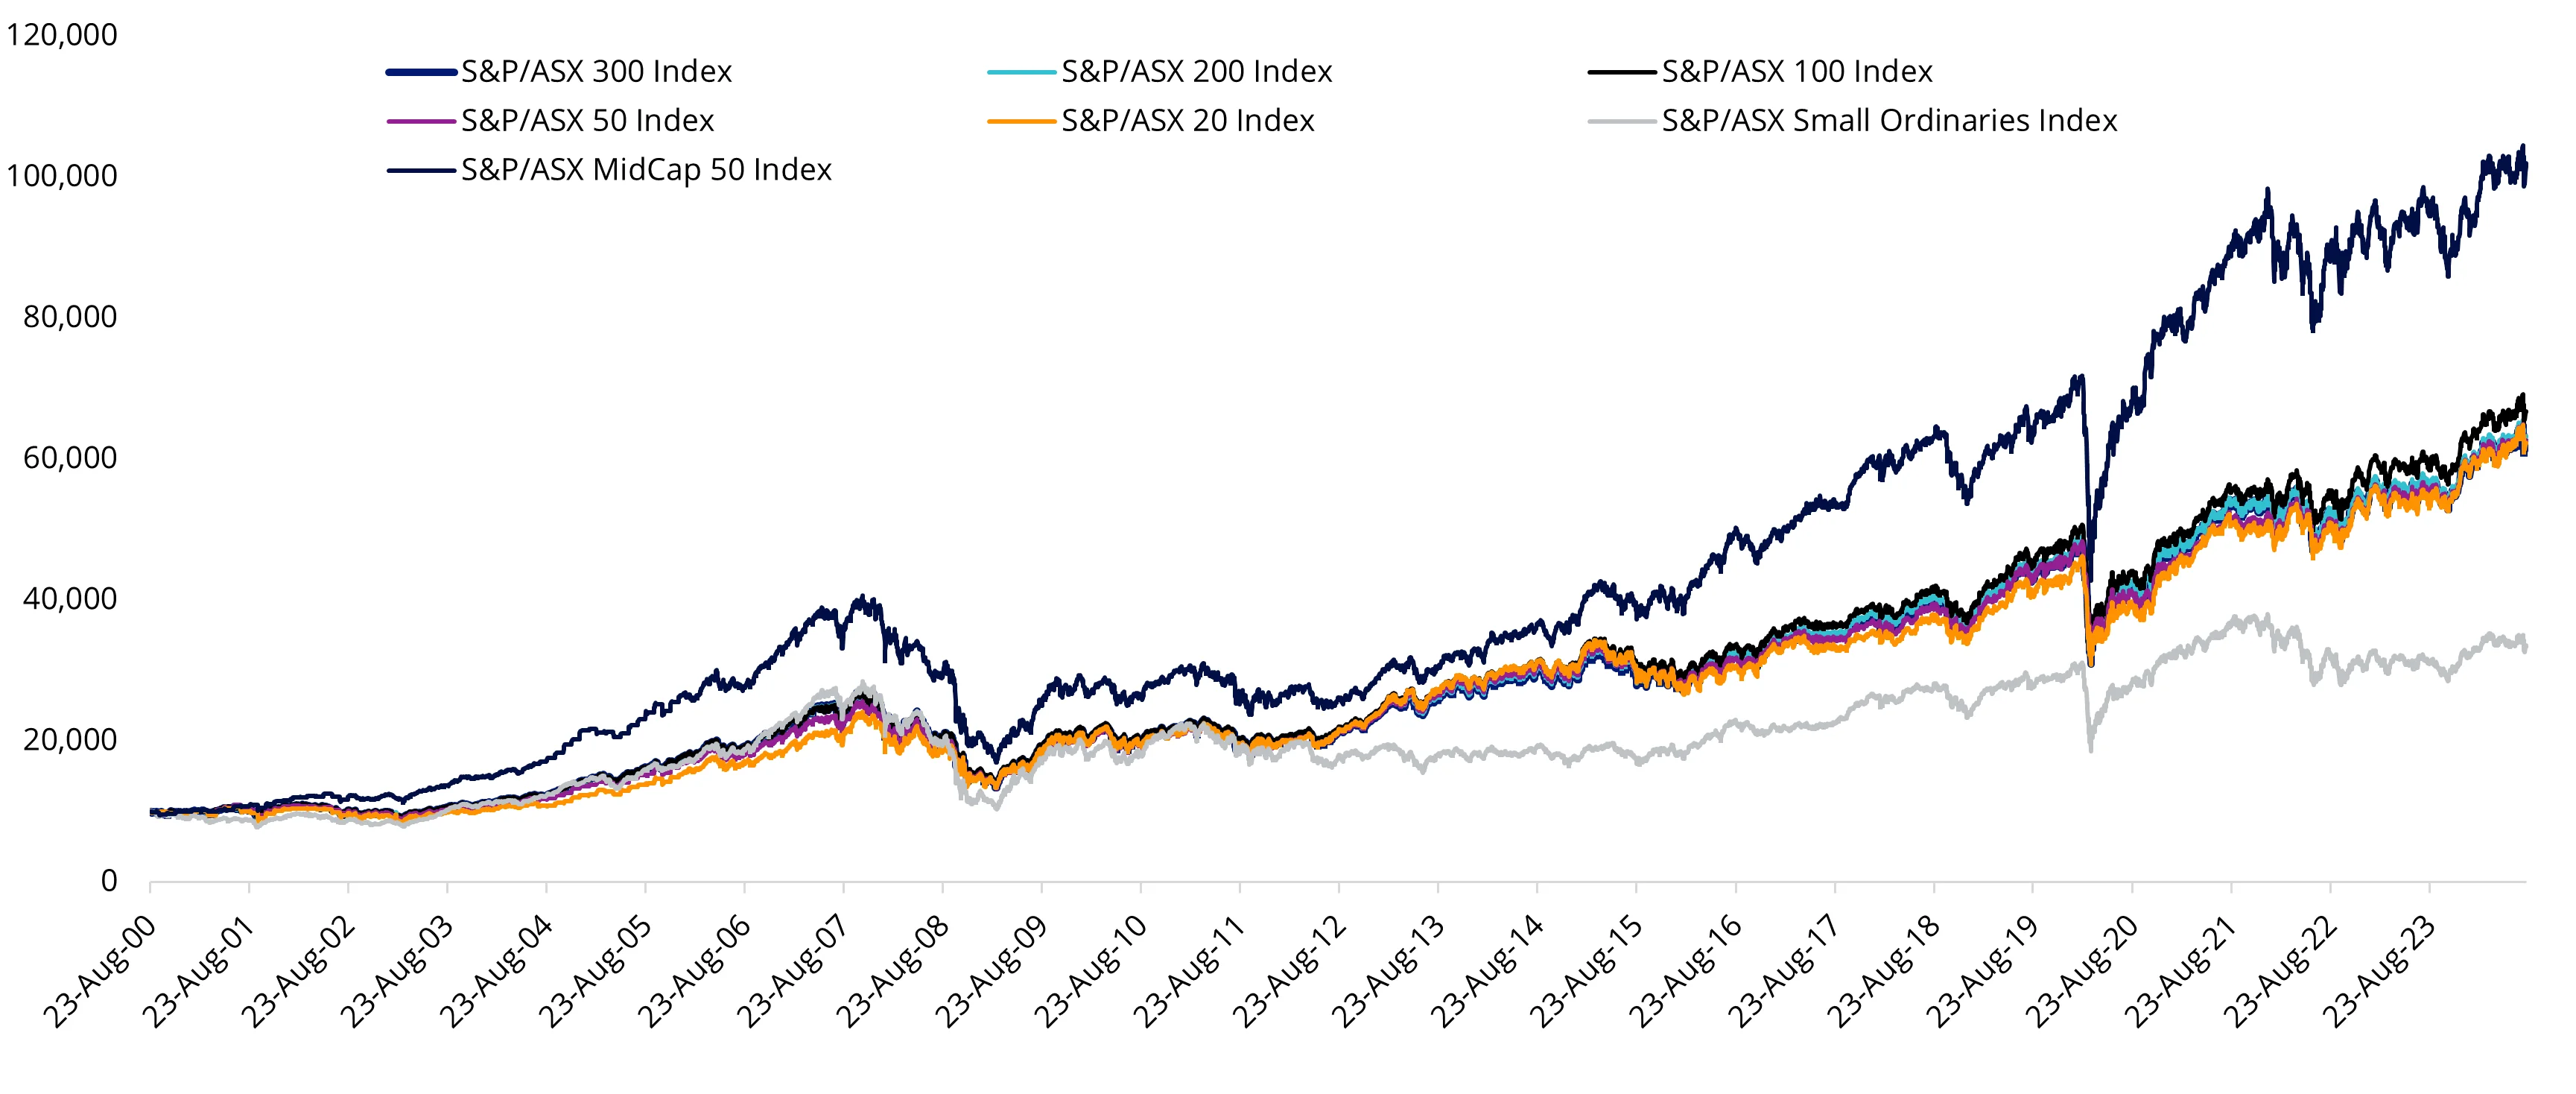
Source: VanEck, Morningstar, since inception of S&P/ASX index series (4 April 2000) to 15 August 2024. Rebased to 10,000 for illustrative purposes only. Results are calculated to the last business day of the month and assume immediate reinvestment of all dividends and exclude costs associated with investing in MVE. You cannot invest directly in an index. Past performance is not a reliable indicator of future performance.
For this reason, mid-caps have been called the ‘sweet spot’ of the Australian equity universe. And it seems, if we consider August’s performance so far, in the face of macroeconomic headwinds and a busy reporting period, they are once again showing their strength. Of course, this is a short time and past performance should not be relied upon for future performance.
The following table shows the trailing performance of the S&P/ASX MidCap 50 Index and other key S&P/ASX indices to 15 August 2024. The S&P/ASX MidCap 50 Index delivered the best performance month-to-date (MTD), year-to-date (YTD), and 5, 10 and 20-year periods.
Table 1: Trailing returns of the S&P/ASX index series
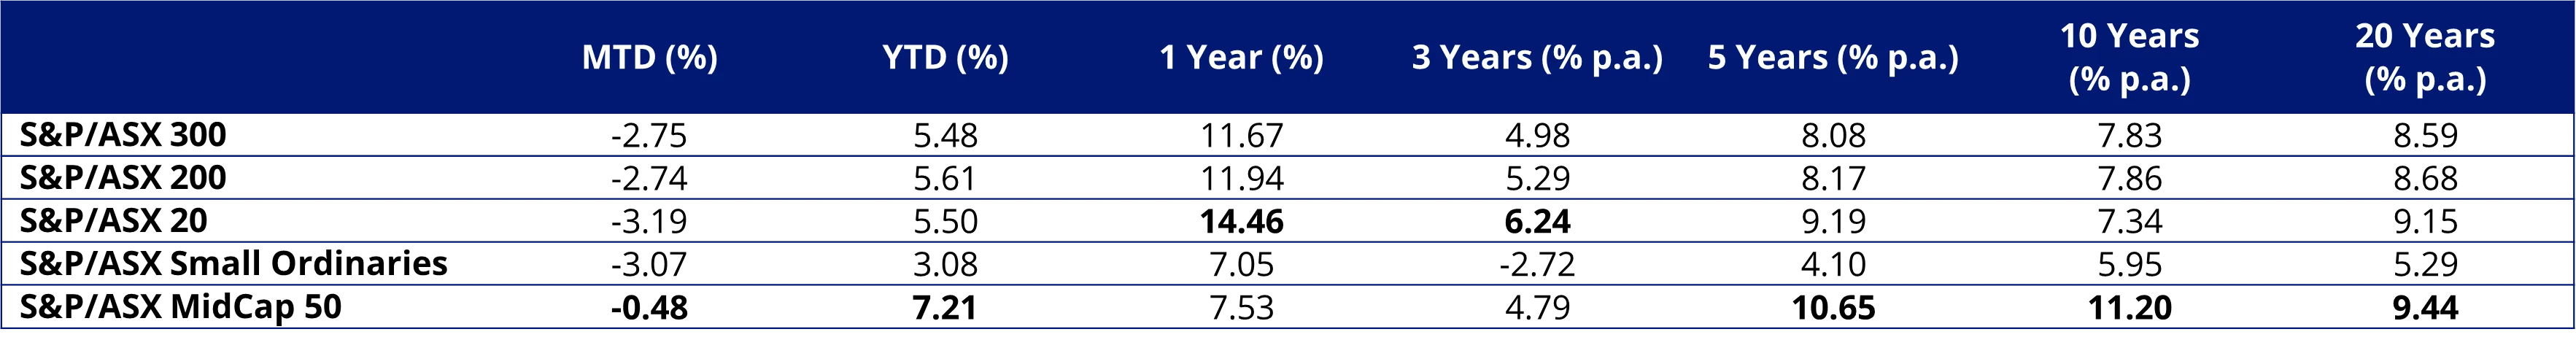 Source: VanEck, Morningstar, as at 15 August 2024. Results are calculated to the last business day of the month and assume immediate reinvestment of all dividends and exclude costs associated with investing in MVE. You cannot invest directly in an index. Past performance is not a reliable indicator of future performance.
Investors may worry this return might come with too much risk. The Sharpe ratio combines the return measure with a volatility (risk) measure to quantify the relationship between the returns and risk. The greater the value of the Sharpe ratio, the better the risk-adjusted return. The table below shows that the S&P/ASX MidCap 50 Index has delivered the best risk-adjusted returns over 5, 10 and 20 years.
Table 2: Sharpe ratio of the S&P/ASX index series
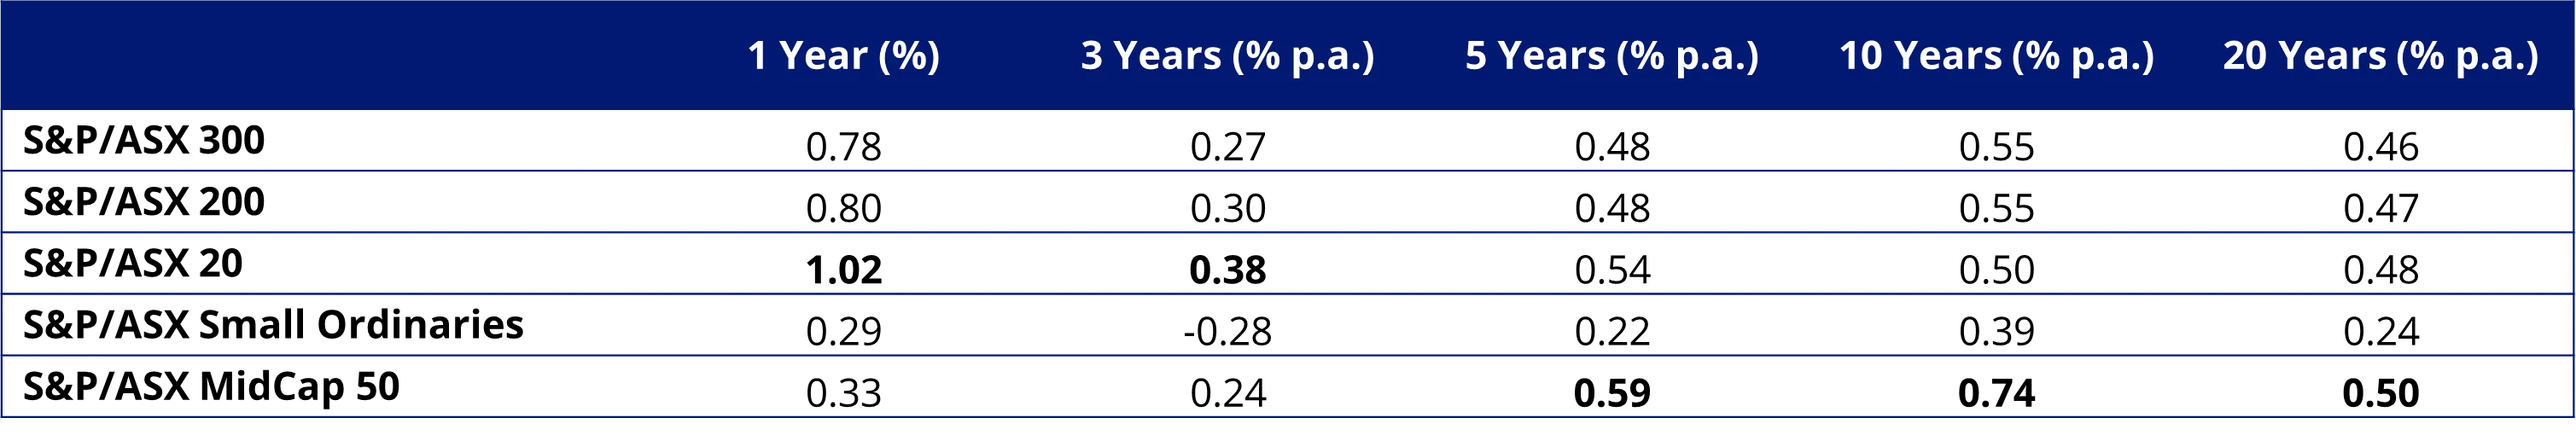 Source: VanEck, Morningstar, as at 15 August 2024.Common inception is launch date of &P/ASX 300 ex S&P/ASX 20 Index (1 July 2013). Results are calculated to the last business day of the month and assume immediate reinvestment of all dividends and exclude costs associated with investing in MVE. You cannot invest directly in an index. Past performance is not a reliable indicator of future performance.
So what is behind the different performance outcomes of the S&P/ASX index series, or the similar outcomes in the case of the S&P/ASX 300, 200 and 20? We think it is the holdings, the sectors and the concentration.
S&P/ASX Index Series - Top 10 holdings
Below you can see the top 10 companies of the S&P/ASX 300 and 200, the S&P/ASX 50, the S&P/ASX Mid-Cap 50 and the S&P/ASX Small Ordinaries. In the S&P/ASX 300, and 200, the top 10 make up over 45% of the respective indices. Investors seeking diversification from a portfolio of 300 or 200 stocks would not expect such concentration. In these indices, the small sized companies outside of the top 10 would not have much impact on performance. Compare this to the S&P/ASX Small Ordinaries and the MidCap 50, in which the smaller size of the top 10 allows for greater representation elsewhere in the portfolio.
Table 3: Top 10 holdings S&P/ASX 300, 200 and 20. Top 10 holdings S&P/ASX Small Ordinaries. Top 10 holdings S&P/ASX MidCap 50
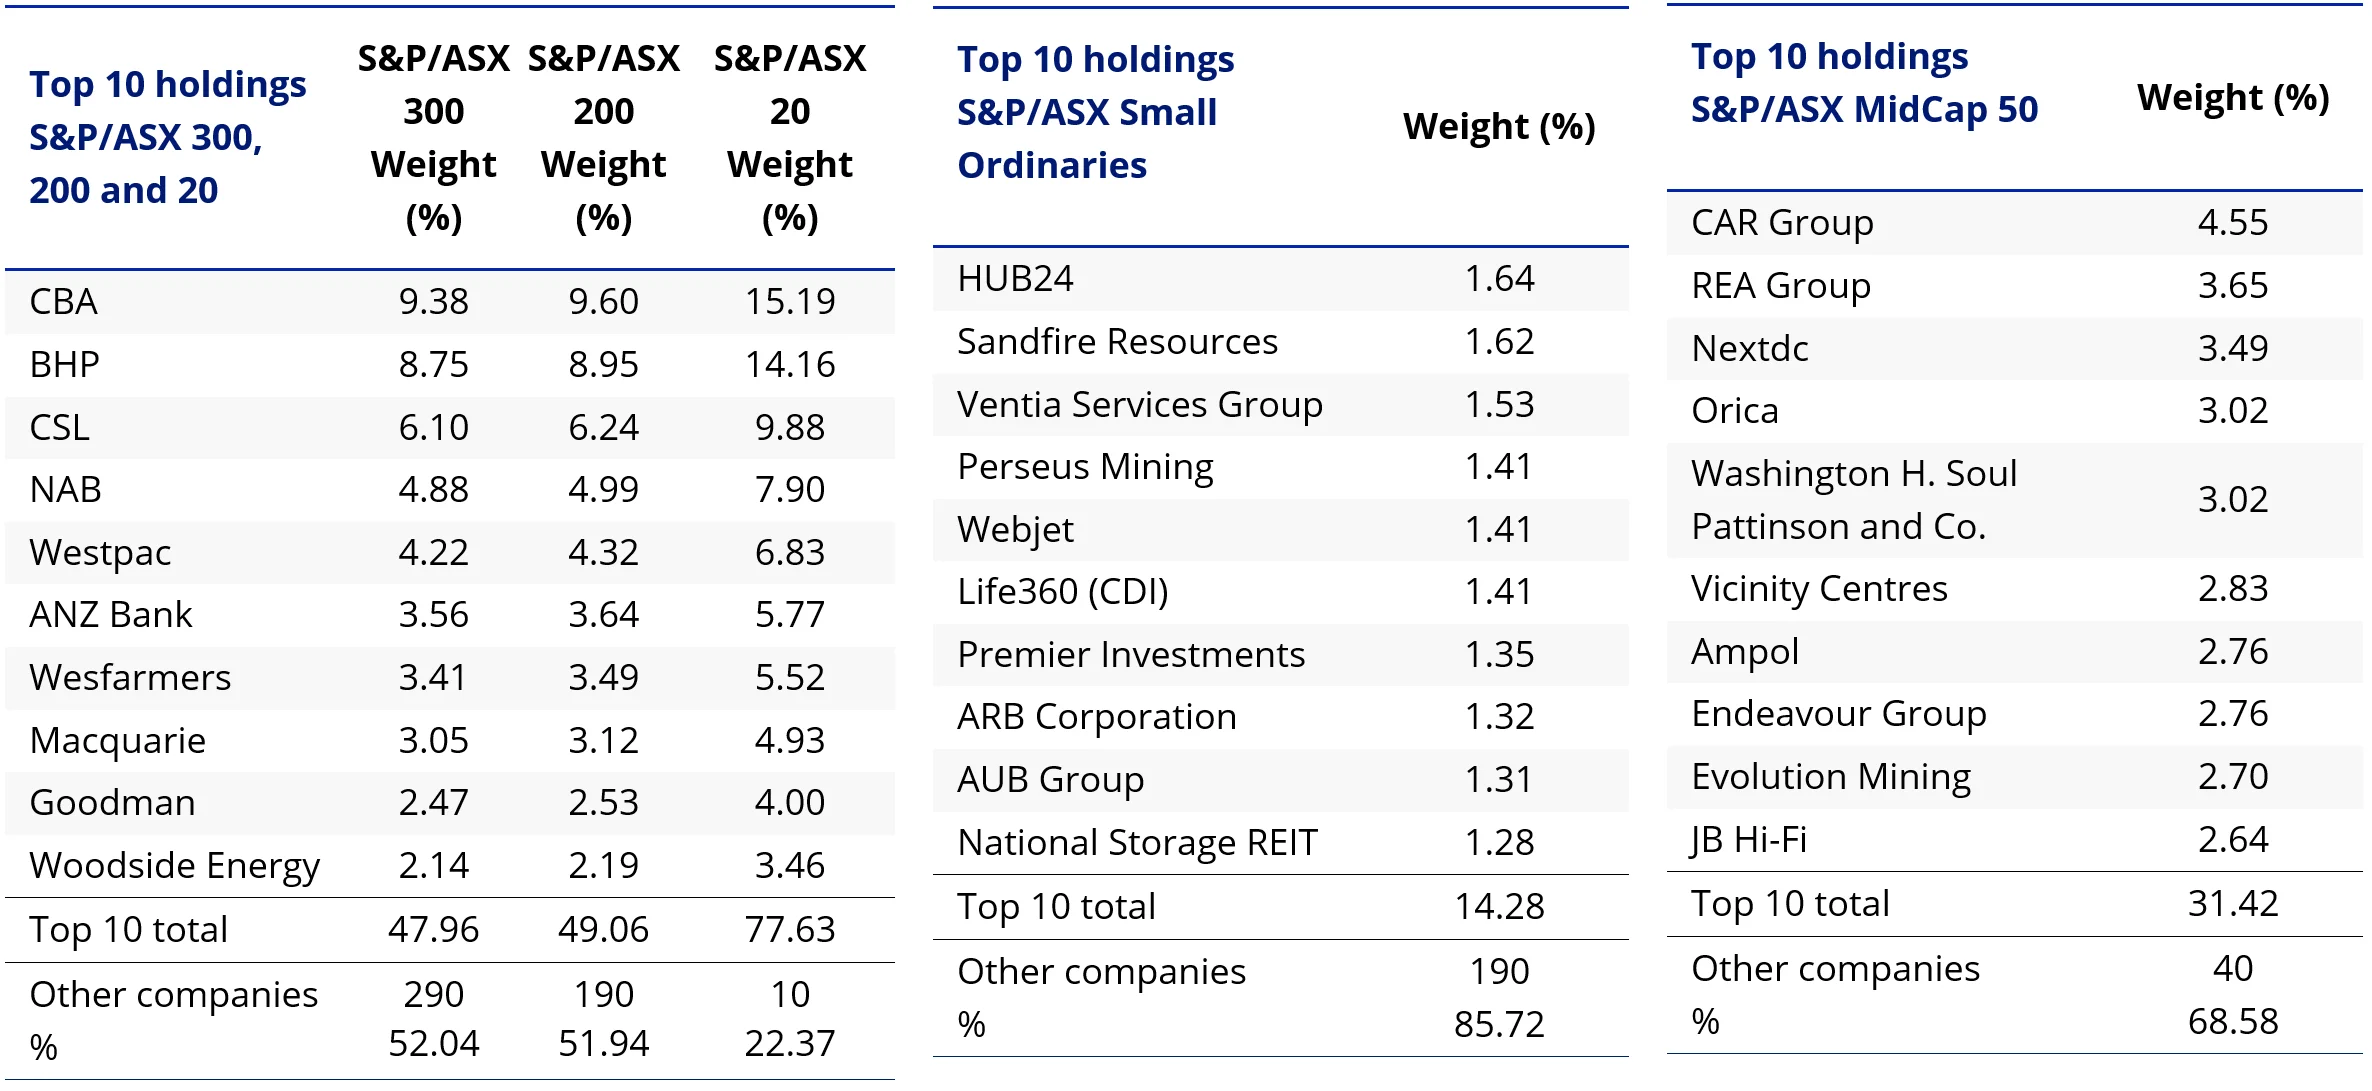
Source: FactSet, S&P, as at 31 July 2024
S&P/ASX Index Series – Sector allocation
The issue of concentration is also evident when you compare the sector allocation of each index. The S&P/ASX 300 & 200 both have over 50% allocated to two sectors. Both the S&P/ASX Small Ordinaries and the S&P/ASX MidCap 50 look to have better diversification, as they have better representations of sectors.
Table 6: Sector allocations S&P/ASX 300, 200 and 20. Top 10 holdings S&P/ASX Small Ordinaries. Top 10 holdings S&P/ASX MidCap 50
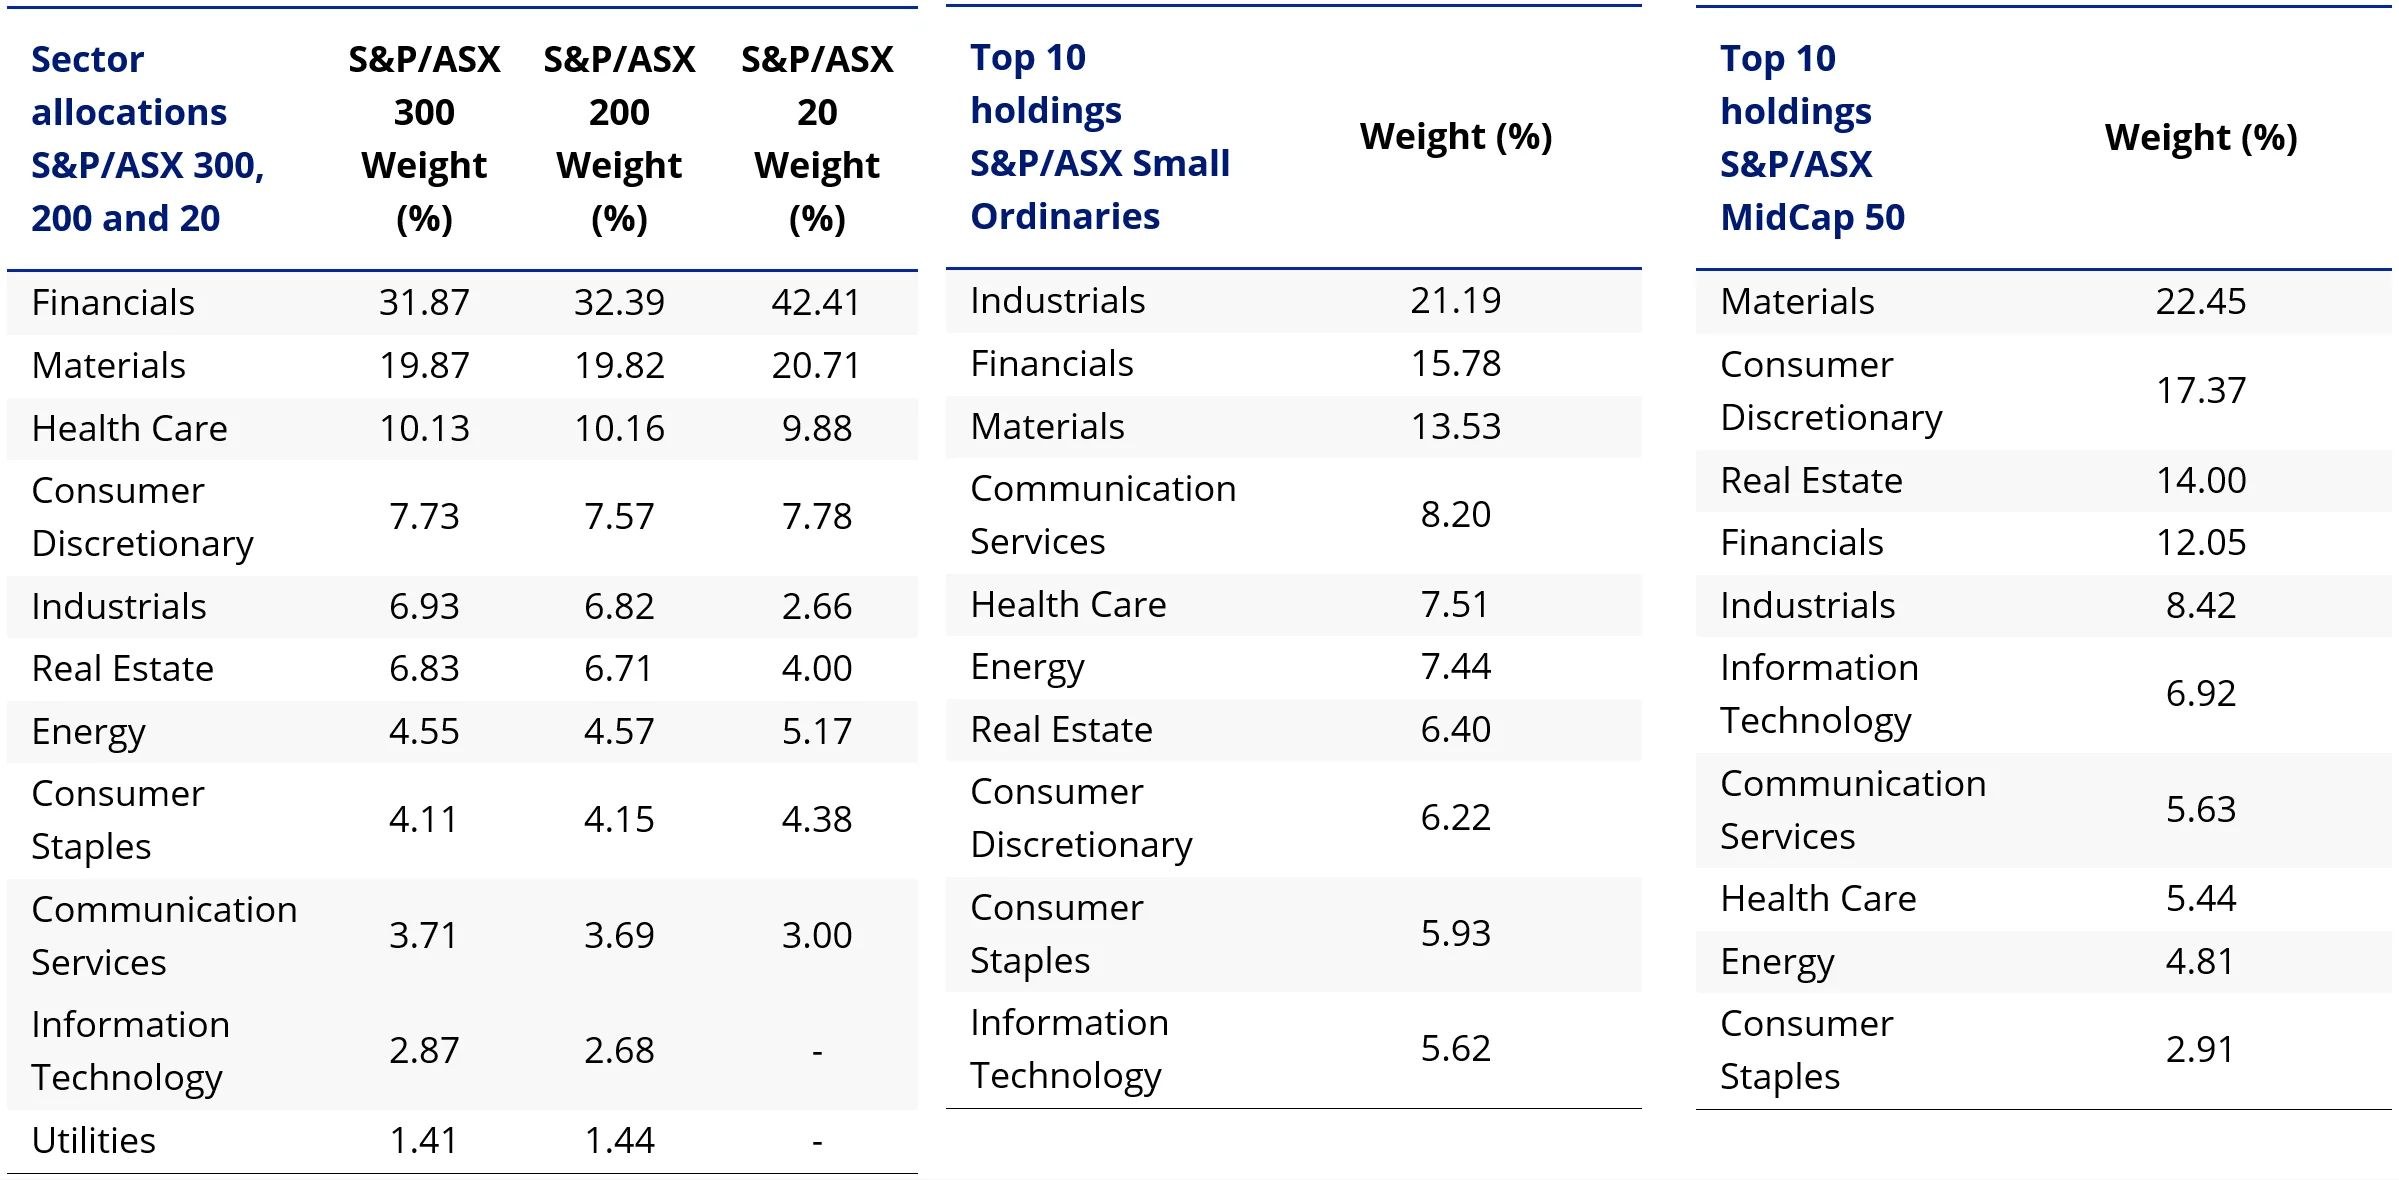
Source: FactSet, S&P, as at 31 July 2024
Measuring diversification
We have spoken a lot about concentration. The opposite of concentration is diversification, and it is a cornerstone of modern portfolio theory. The principle being that when you diversify, you improve your risk-return trade-off.
There is a way to measure concentration, and thus diversification. Economist Orris Clemens Herfindahl developed the Herfindahl Index, and he first used his calculation to determine the concentration within the US steel industry. The concentration calculation has been used beyond economics in fields such as engineering, aeronautics and biochemistry. As a measure, the higher the Herfindahl, the more concentrated. Therefore, a lower Herfindahl index signifies less concentration and greater diversification. At the extreme levels, the S&P/ASX 20 has a Herfindahl score of 807, while the S&P/ASX Small Ordinaries Index is only 77. The Herfindahl for S&P/ASX 200 is 337 while for the S&P/ASX 300 it is 322, so slightly more diversified. The S&P/ASX MidCap 50’s Herfindahl is 231, so is much more diversified than those S&P/ASX indices dominated by big banks and miners.
Putting it all in action
While ETFs tracking each index has its merit for portfolio inclusion and you should assess all the risks and consider your investment objectives, the VanEck S&P/ASX MidCap ETF (ASX: MVE) is the only ETF listed on ASX which tracks the S&P/ASX MidCap 50 Index. Through one trade, investors can access a portfolio of 50 stocks and gain instant access to the ‘sweet spot’ of the Australian equity universe. As an ETF, MVE is cost effective, liquid and transparent with holdings published daily.
Past performance is no guarantee of future performance. The above is not a recommendation. Please speak to your financial adviser or stock broker.
Key risks
An investment in MVE carries risks associated with: financial markets generally, individual company management, industry sectors, stock and sector concentration, fund operations and tracking an index. See the PDS for details. No member of the VanEck group of companies guarantees the repayment of capital, the payment of income, performance, or any particular rate of return from any fund.


Published: 16 August 2024
VanEck Investments Limited ACN 146 596 116 AFSL 416755 (‘VanEck’) is the responsible entity and issuer of units in the VanEck S&P/ASX MidCap ETF. This is general advice only, not personal financial advice. It does not take into account any person’s individual objectives, financial situation or needs. Read the PDS and speak with a financial adviser to determine if the fund is appropriate for your circumstances. The PDS is available here. The Target Market Determination is available
No member of the VanEck group of companies guarantees the repayment of capital, the payment of income, performance, or any particular rate of return from any fund.
The S&P/ASX MidCap Index (the Index”) is a product of S&P Dow Jones Indices LLC or its affiliates (“SPDJI”) and ASX Limited (“ASX”) and licensed for use by VanEck. S&P® is a registered trademark of Standard & Poor’s Financial Services LLC (“S&P”); Dow Jones® is a registered trademark of Dow Jones Trademark Holdings LLC (“Dow Jones”); and these trademarks have been licensed for use by SPDJI and sublicensed by VanEck. The Fund is not sponsored, endorsed, sold or promoted by SPDJI, Dow Jones, S&P, their respective affiliates, or ASX and none of them makes any representation regarding the advisability of investing in the Fund. Such parties do not accept liability for any errors, omissions, or interruptions of the Index and do not give any assurance that the Fund will accurately track the performance of the index or provide positive investment returns. Inclusion of a security within the index or Fund is not a recommendation by any party to buy, sell, or hold such security.