Get even with markets uncertainty
Budgets allow you to track, plan and prioritise where money goes.
Governments do this too, and this week it was confirmed that the next Federal budget will be handed down with a deficit forecast. The budget too, coincides with the Federal election campaign.
There will be winners (perhaps energy and utility companies that benefit from government rebates) and there will be losers (perhaps big miners, that are unlikely to get relief from retaliatory tariffs).
Markets will watch with bated breath. Currently they seem to be in a state of anticipation, unsure of the next growth driver, or issue to navigate and you can see this in the correlation of returns.
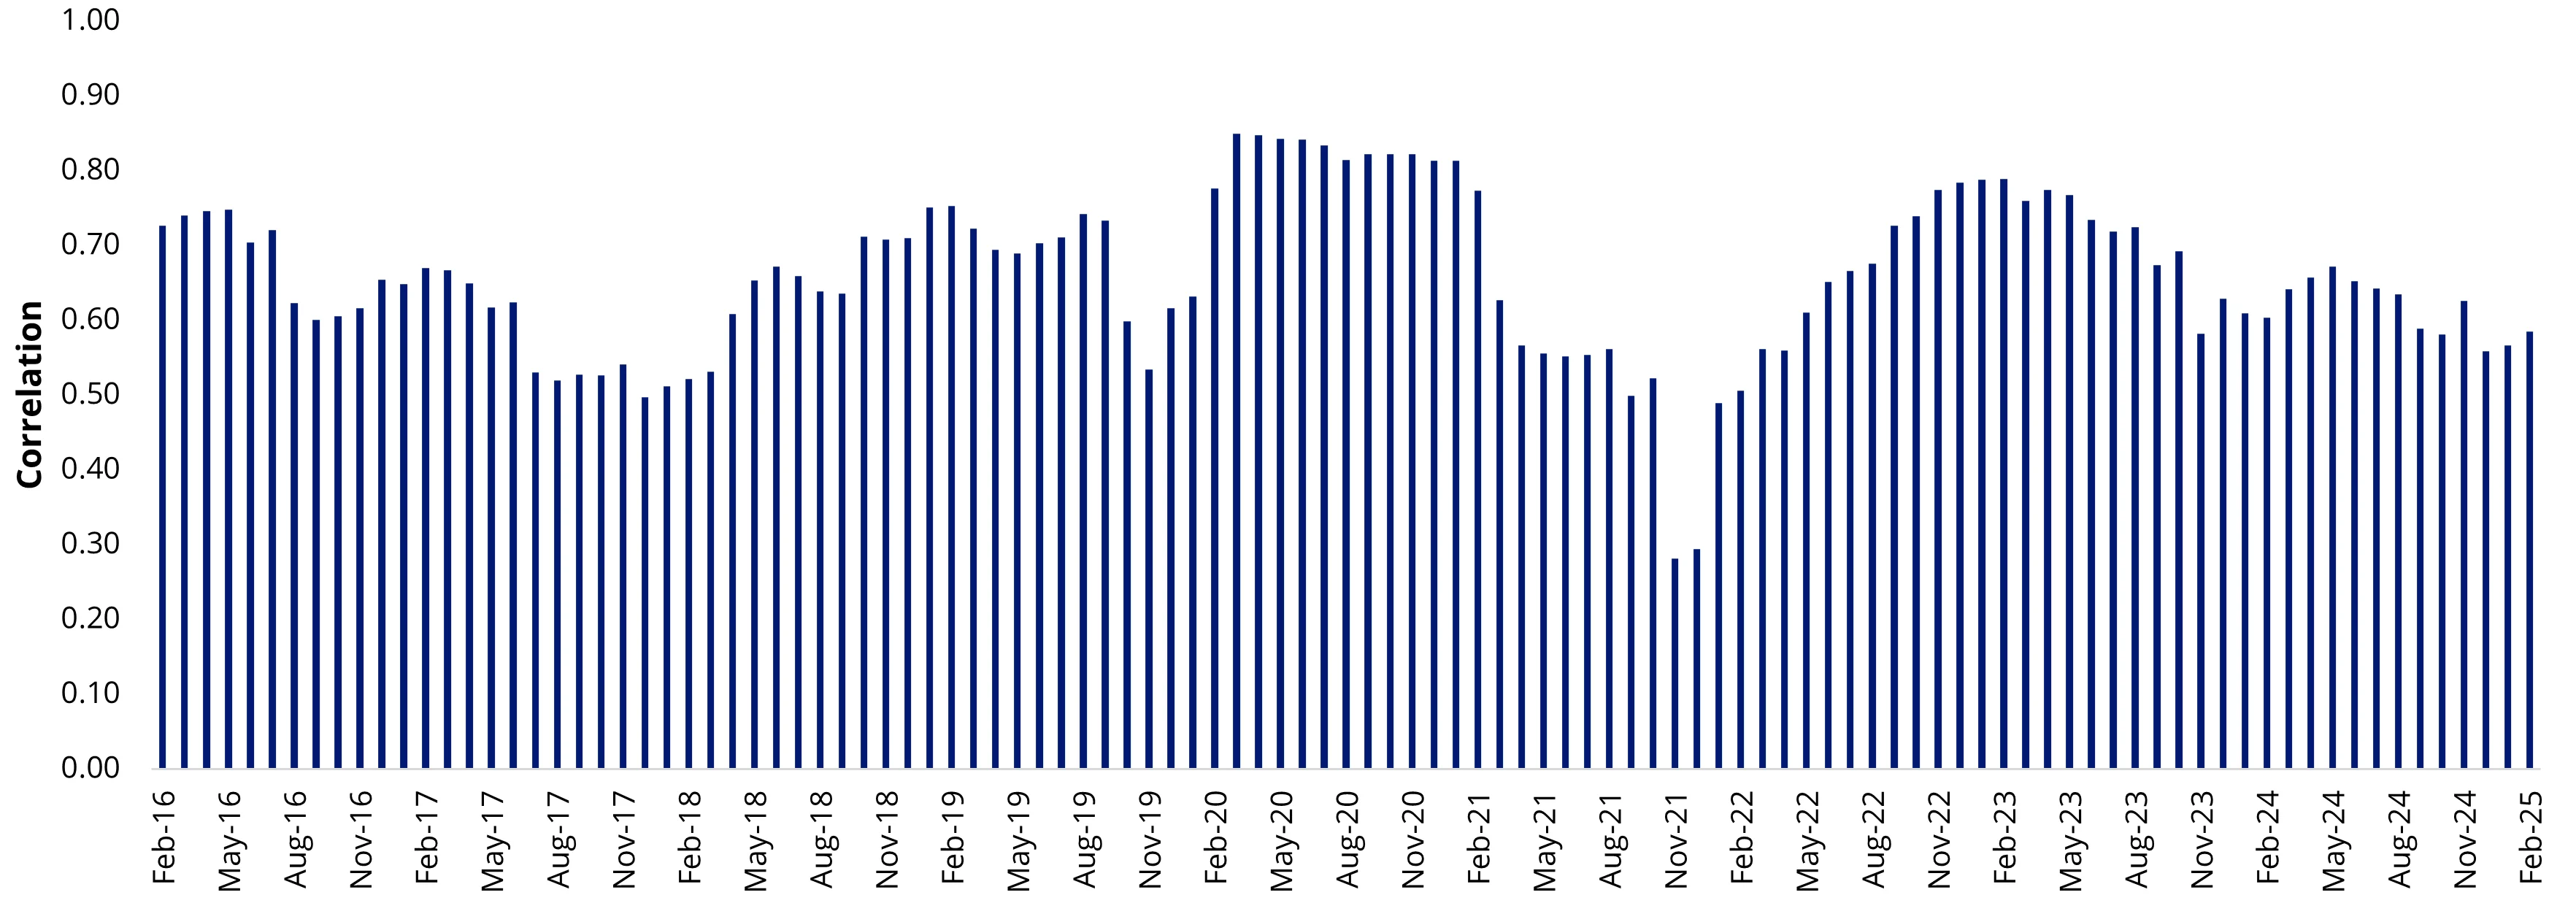
Australian stock correlations are trending lower
Correlation, or the tendency of stocks to move up and down in lockstep, for Australian equities hit historic lows in 2021, as the market and economy recovered from the market falls experienced by the COVID-19 market meltdown. Some sectors thrived, others faltered. Overall, the 11 sectors in the S&P/ASX 200 were showing just a 0.3 correlation with the broader index. That's off the number that was close to 0.85 when virtually all stocks fell in unison twelve months prior. As the economy, and markets recovered correlations once again neared 0.80, but since 2023, following the fallout from Russia’s invasion of Ukraine, geopolitical issues have had markets in a state of flux.
Now investors must contend with uncertainty in Australian politics, Trump’s tariffs and the potential reemergence of inflation. Correlation between sectors have been on a steady march down.
Chart 1: 12-month rolling GICS sector correlation against the S&P/ASX 200 Index, five years ending February 2025

Source: Morningstar Direct, VanEck. Past performance is not a reliable indicator of future performance. The correlation is calculated using the average of the S&P/ASX 200 A-REIT Index, S&P/ASX 200 Consumer Discretionary Index, S&P/ASX 200 Consumer Staples Index, S&P/ASX 200 Energy Index, S&P/ASX 200 Health Care Index, S&P/ASX 200 Industrials Sector Index, S&P/ASX 200 Information Technology Index, S&P/ASX 200 Materials Index, S&P/ASX 200 Telecom Services Index, S&P/ASX 200 Utilities Index and S&P/ASX 200 Financials Index.
The upcoming budget may provide some direction, but for investors navigating these markets, picking the stocks and sectors that will do well in this environment is challenging. We think the more uncertain environment is likely to continue for some time and divergence between sectors is likely to continue.
The problem with a purely passive Australian equity approach is that it is dominated by two sectors and a handful of mega-cap companies.
Portfolio considerations
Intuitively, it would make sense to construct a portfolio with broader diversification.
Equal weighting a portfolio is a passive approach that can be used as a way to potentially exploit the dispersion of returns on ASX as we navigate through the budget, the Australian election and the local impact of Trump’s second presidential term.
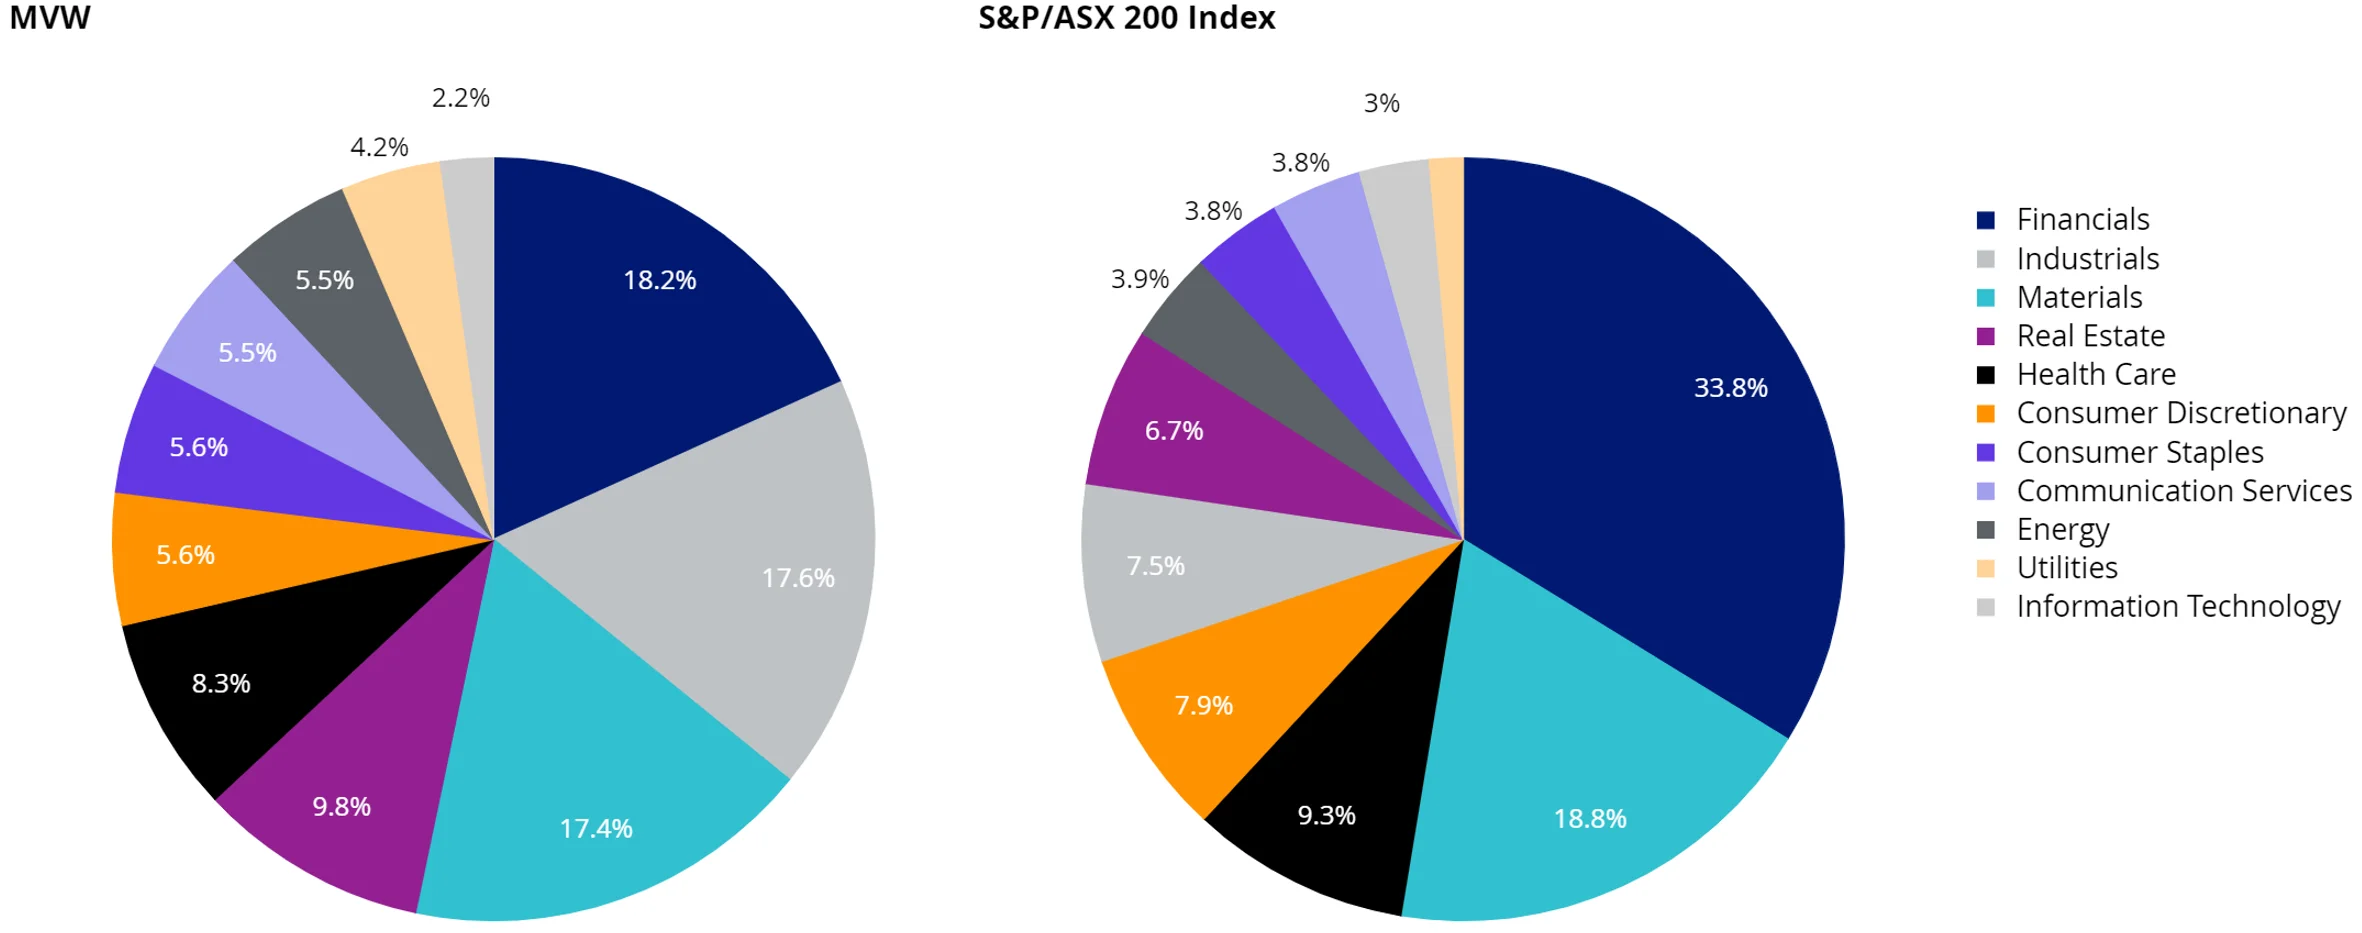
An evenly spread portfolio like VanEck’s Australian Equal Weight ETF (MVW), we think, is one such approach. MVW currently includes 72 different companies, with less sector and stock concentration than the S&P/ASX 200 Index. MVW has more meaningful allocation to utilities and energy sectors and is also overweight industrials, REITs, consumer staples and communications. It is underweight financials and materials.
Chart 2: MVW versus S&P/ASX 200 sector weight comparison

Source: FactSet, as at 28 February 2025
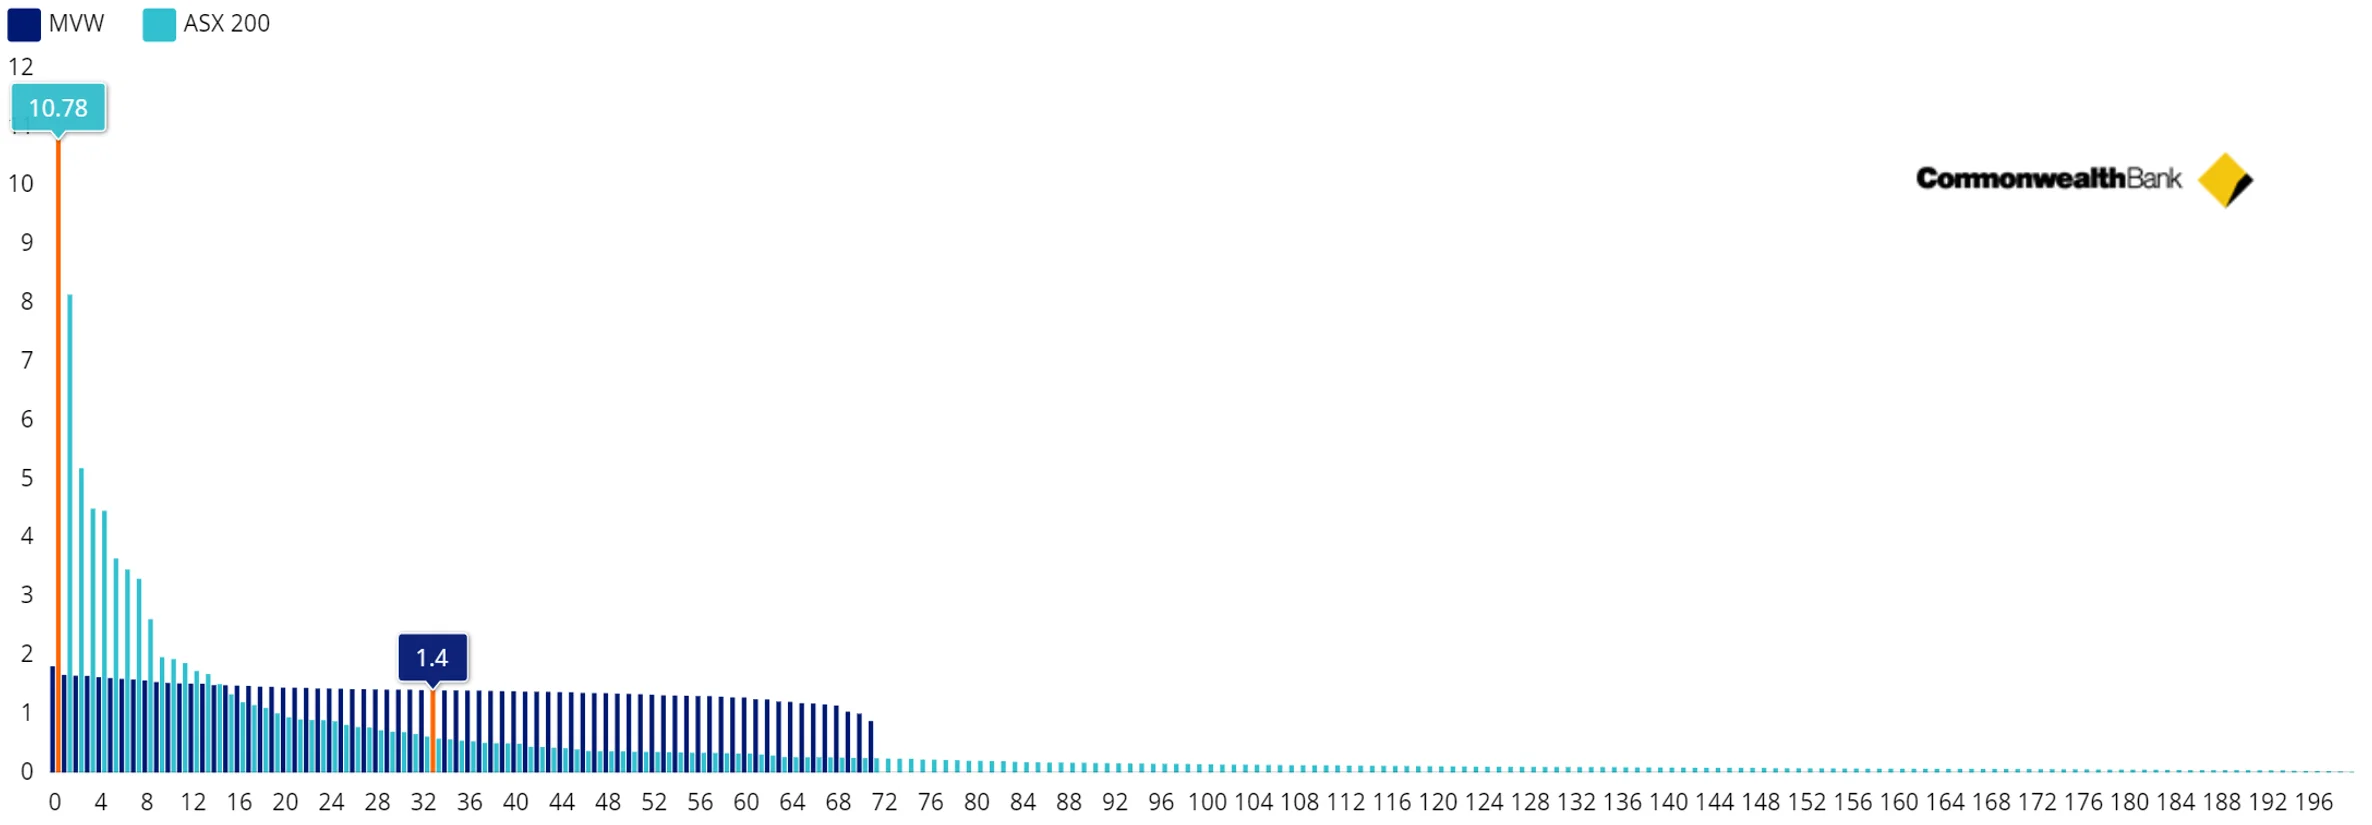
In terms of stock concentration, a fund benchmarked to the S&P/ASX 200 Index can only have significant holdings in the biggest stocks, of which there are only around a dozen. MVW has ~70 significant holdings that can all contribute meaningfully to the portfolio.
Chart 3: MVW versus S&P/ASX 200 index constituent rank and weightings

Source: FactSet, as at 28 February 2025
Measuring diversification
Diversification is a cornerstone of modern portfolio theory. The principle is that when you diversify, you improve your risk-return trade-off. Australia is among the most concentrated listed equity markets in the developed world.
There is a way to measure an equity market’s concentration, and thus its diversification. Economist Orris Clemens Herfindahl developed the Herfindahl Index, and he first used his calculation to determine the concentration within the US steel industry. As a measure, the higher the Herfindahl, the more concentrated. Therefore, a lower Herfindahl index signifies less concentration and thus greater diversification. The Herfindahl for the S&P/ASX 200 is 334, while for the S&P/ASX 300, it is 316, so slightly more diversified. MVW’s Herfindahl is 135, so is much more diversified than those S&P/ASX indices concentrated in big banks and miners.
MVW Performance
In addition to its diversification, MVW is a passive approach that has the potential to achieve active-like returns. And yet it charges a management fee that is almost a third of the average large-cap Australian equity manager. It has demonstrated long-term outperformance and it has outperformed over the most recent three years as stock and sector correlations fell, as noted above.
Table 1: MVW Performance as at 20 March 2025

Inception date is 4 March 2014.
Source: Morningstar Direct, VanEck. Results are calculated daily to the last business day of the month and assume immediate reinvestment of all dividends. MVW results are net of management fees and other costs incurred in the fund but do not include brokerage costs and buy/sell spreads incurred when investing in MVW. Past performance is not a reliable indicator of future performance. You cannot invest directly in an index. The S&P/ASX 200 Index is shown for comparison purposes as it is the widely recognised benchmark used to measure the performance of the broad Australian equities market. It includes the 200 largest ASX-listed companies, weighted by market capitalisation. MVW’s index measures the performance of the largest and most liquid ASX-listed companies, weighted equally at rebalance. MVW’s index has fewer companies and different industry allocations than the S&P/ASX 200.
Since the beginning of the year MVW has outperformed the S&P/ASX 200 Index, by 1.93%, a period in which stock dispersion has increased, and over the long term, since its inception in 2014 it has outperformed Australia’s benchmark index by 1.20% per annum (to 20 March 2025, source Morningstar). As always, past performance is by no means indicative of future performance.
Key risks
An investment in the ETF carries risks. These include risks associated with financial markets generally, individual company management, industry sectors, fund operations and tracking an index. See the PDS for details.
Published: 25 March 2025
Any views expressed are opinions of the author at the time of writing and is not a recommendation to act.
VanEck Investments Limited (ACN 146 596 116 AFSL 416755) (VanEck) is the issuer and responsible entity of all VanEck exchange traded funds (Funds) trading on the ASX. This information is general in nature and not personal advice, it does not take into account any person’s financial objectives, situation or needs. The product disclosure statement (PDS) and the target market determination (TMD) for all Funds are available at vaneck.com.au. You should consider whether or not an investment in any Fund is appropriate for you. Investments in a Fund involve risks associated with financial markets. These risks vary depending on a Fund’s investment objective. Refer to the applicable PDS and TMD for more details on risks. Investment returns and capital are not guaranteed.


