Investing in the Australian resources sector
Most Australian investors have exposure to the resources sector. The resources sector has been one of the pillars of Australia’s economy and has historically been our biggest exporter. Often Australian investors will be exposed to this sector directly, either via a single blue chip or indirectly, via a fund.
Investing in resources requires specialist knowledge that many stock pickers do not have and that is why some investors prefer to utilise resource sector ETFs to gain additional resources exposure.
Many resource ETFs follow market capitalisation indices. A limitation of a market capitalisation index is the potential for concentration, and the Australian resources market capitalisation index, the S&P/ASX 200 Resources Index, is an example of this. It is highly concentrated.
BHP is over 38% of the S&P/ASX 200 Resources Index, and it could get bigger as it is currently attempting to buy Anglo American. In other words, if you invest in a fund that tracks this index, you are investing two-fifths of your money in just one company. It also means BHP can be the single driver of performance for the entire sector, which adds a layer of unintended risk. BHP is also a company many investors already own, either directly or indirectly.
Chart 1: BHP weighting in S&P/ASX 200 Resources Index since 2005
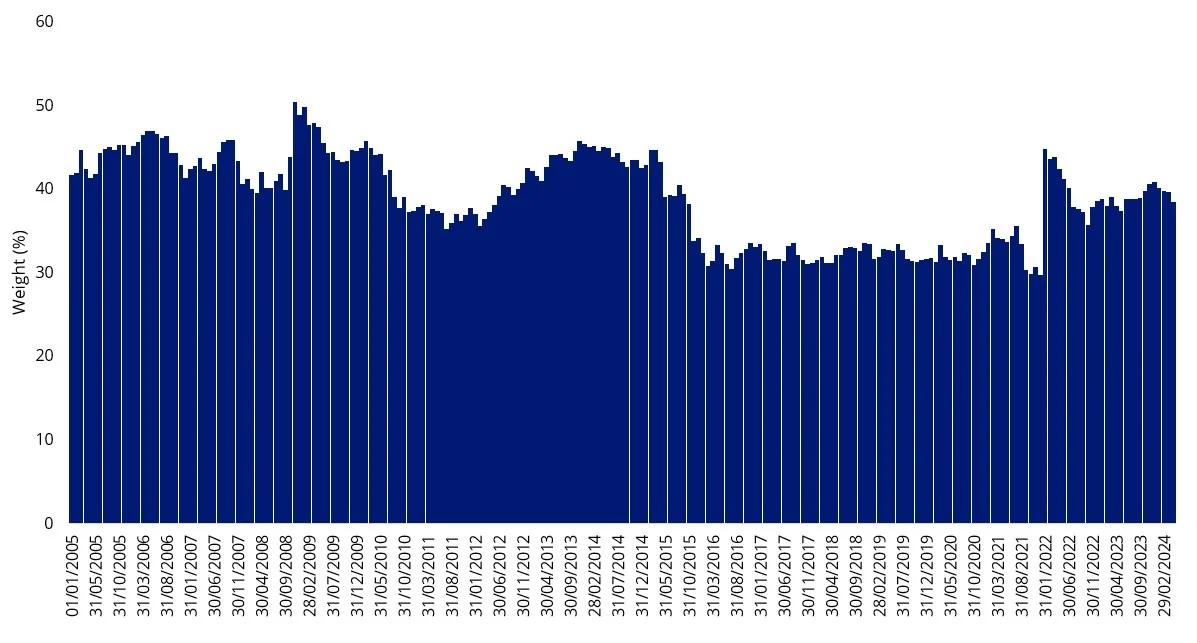
Source: VanEck, FactSet, as of 30 April 2024
MVR’s ‘smarter’ approach
VanEck Australian Resources ETF (MVR) tracks the MVIS Australia Resources Index. This index is a ‘smart beta’ index, which means it is constructed differently from the market capitalisation index.
The MVIS Australia Resources Index caps its holdings at 8%. What this means is that MVR is not just a proxy BHP exposure. At rebalance, no stock, including BHP, is more than 8%. The impact of this capping is that it reduces the dominance of the mega/large-cap stocks and increases exposure to mid-caps.
So, let’s walk through the difference between MVR and the S&P/ASX 200 Resources Index.
MVR and the S&P/ASX 200 Resources Index - Top 10 holdings
Below you can see the top 10 companies. The differences are stark – to see all the holdings in MVR and its weightings click here.
Table 1: Top 10 holdings

Source: MVR holdings - FactSet, VanEck, MVIS, as at 30 April 2024. S&P/ASX 200 Resources holdings - FactSet, VanEck, S&P, as at 30 April 2024.
MVR and the S&P/ASX 200 Resources Index – Sub-sector exposures
MVR is currently underweight the diversified metals and mining sub-sectors compared to the S&P/ASX 200 Resources Index. BHP sits in this sector. Conversely, MVR is overweight the coal, aluminium and chemicals sub-sectors.
Chart 2: S&P/ASX 200 Resources and MVR sub sector
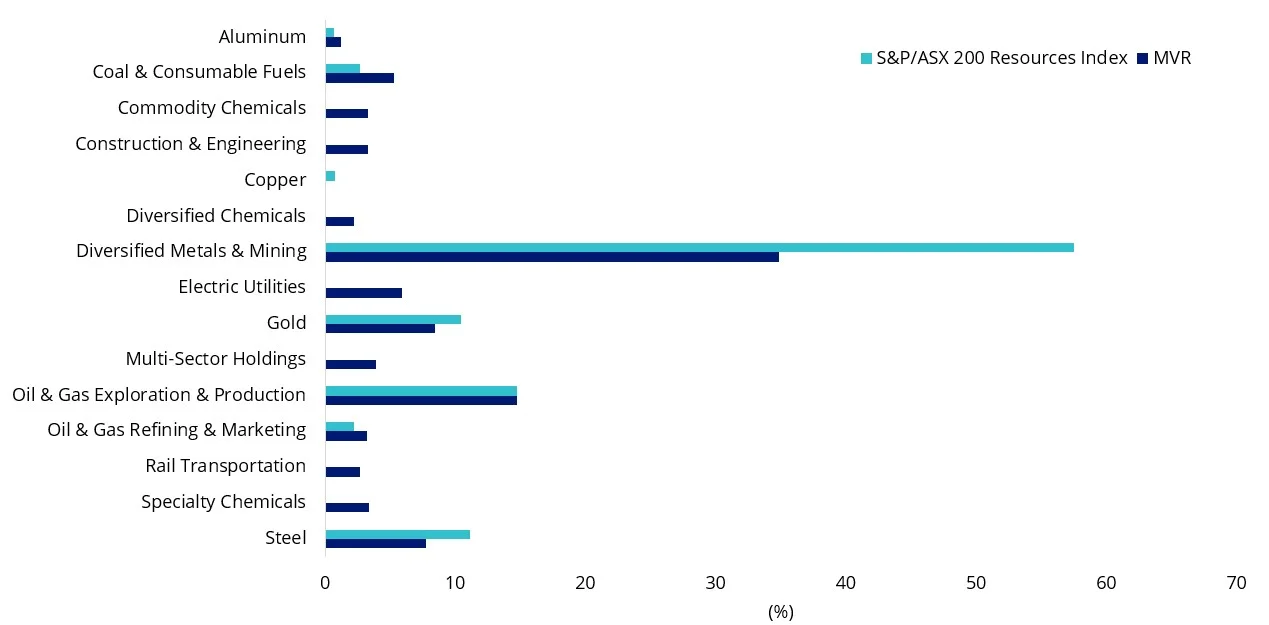
Source: FactSet, 30 April 2024
MVR vs S&P/ASX 200 Resources – Performance
MVR offers investors broad exposure to the resources sector, tracking the performance of the largest and most liquid ASX-listed resources companies. The ETF has outperformed the S&P/ASX 200 Resources Index by 1.30% p.a. since its inception. As always, past performance is not indicative of future performance.
Chart 3: Cumulative performance since MVR inception date to 30 April 2024
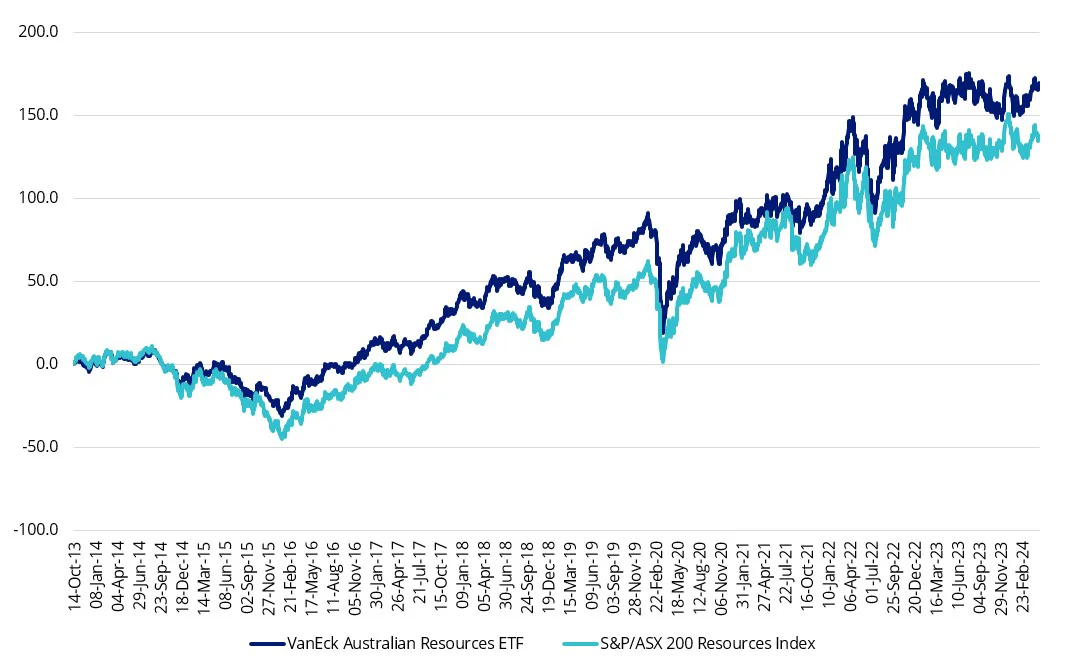
Table 2: Trailing performance to 30 April 2024
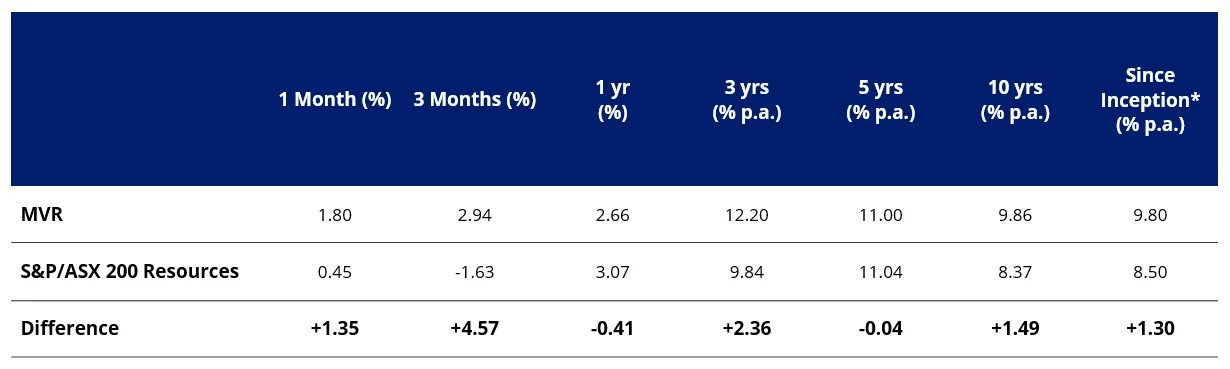
* MVR Inception date is 13 October 2013. A copy of the factsheet is here.
Chart 3 and Table 2 source: Morningstar Direct, VanEck. The chart and table above show the past performance of MVR and of the S&P/ASX 200 Resources Index. You cannot invest directly in an index. Results are calculated to the last business day of the month and assume immediate reinvestment of distributions. MVR results are net of management fees and other costs incurred in the fund, but before brokerage fees and bid/ask spreads incurred when investors buy/sell on the ASX. Returns for periods longer than one year are annualised. Past performance is not a reliable indicator of future performance. The S&P/ASX 200 Resources Index is shown for comparison purposes as it is the widely recognised benchmark used to measure the performance of the resources companies included in the S&P/ASX 200, weighted by market capitalisation. MVR’s index measures the performance of the largest and most liquid ASX-listed companies that generate at least 50% of their revenues or assets from the Australian resources sector, with a maximum weight of 8% in each company at rebalance. Consequently, it has fewer companies and different industry allocations than the S&P/ASX 200 Resources Index. Click here for more details.
MVR vs S&P/ASX 200 Resources Index- Style
When looking at portfolios it is important to determine what style (e.g. value or growth) and what size bias a portfolio holds (e.g. giant, large, mid or small). Below we can see MVR’s. Importantly MVR holds large companies with a similar value orientation relative to the S&P/ASX 200 Resources Index, which has a giant-cap bias.
Chart 4: MVR holdings based style map
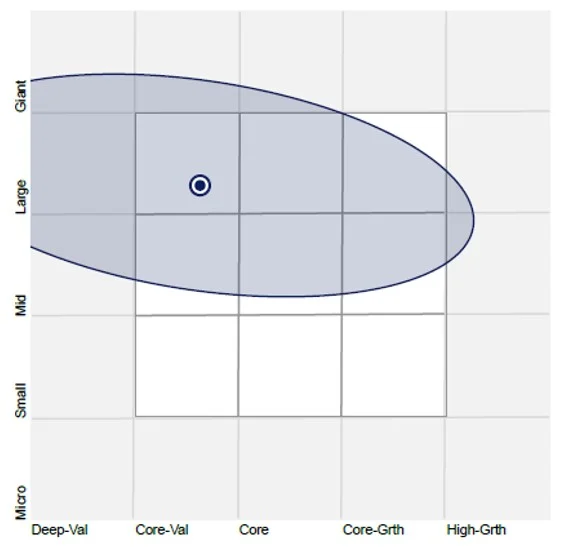
Source: Morningstar Direct, as at 30 April 2024
Chart 5: S&P/ASX 200 Resources Index
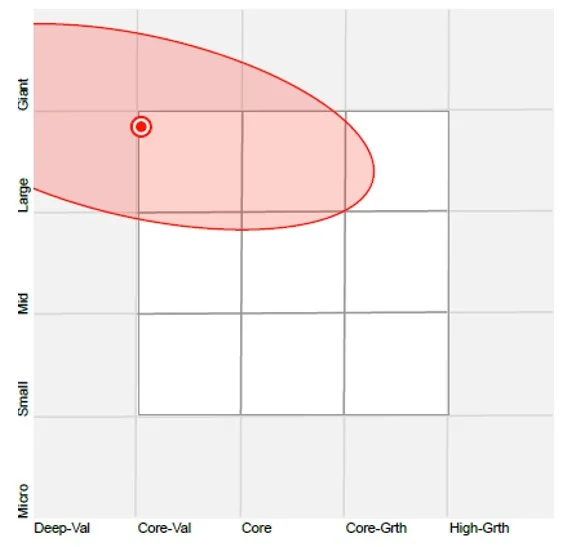
Source: Morningstar Direct, as at 30 April 2024
While each Australian resources approach has its merit for portfolio inclusion, you should assess all the risks and consider your investment objectives.
Past performance is no guarantee of future performance. The above is not a recommendation. Please speak to your financial adviser or stock broker.
Key risks
An investment MVR carries risks associated with: ASX trading time differences, financial markets generally, individual company management, industry sectors, country or sector concentration, political, regulatory and tax risks, fund operations and tracking an index. See the PDS for details.


Published: 09 May 2024
Any views expressed are opinions of the author at the time of writing and is not a recommendation to act.
VanEck Investments Limited (ACN 146 596 116 AFSL 416755) (VanEck) is the issuer and responsible entity of all VanEck exchange traded funds (Funds) trading on the ASX. This is general advice only and does not take into account any person’s financial objectives, situation or needs. The product disclosure statement (PDS) and the target market determination (TMD) for all Funds are available at vaneck.com.au. You should consider whether or not an investment in any Fund is appropriate for you. Investments in a Fund involve risks associated with financial markets. These risks vary depending on a Fund’s investment objective. Refer to the applicable PDS and TMD for more details on risks. Investment returns and capital are not guaranteed.
MVIS Australia Resources Index (‘MVIS Index’) is the exclusive property of MV Index Solutions GmbH based in Frankfurt, Germany (‘MVIS’). MVIS is a related entity of VanEck. MVIS makes no representation regarding the advisability of investing in the Fund. MVIS has contracted with Solactive AG to maintain and calculate the MVIS Index. Solactive uses its best efforts to ensure that the MVIS Index is calculated correctly. Irrespective of its obligations towards MVIS, Solactive has no obligation to point out errors in the MVIS Index to third parties.