Solar power propels the energy transition forward
Solar power is set to lead global electricity production within a decade. Here’s the three key factors driving its growth and why investors should take note.
While the hot topic in energy has been the prospect of a nuclear buildout in Australia, record levels of solar power continue to be rolled out around the world. Solar power is on track to generate more electricity than all the world’s nuclear power plants in 2026, its gas-fired power plants in 2030 and its coal-fired ones in 2032, according to a recent article from The Economist in the AFR. Solar power may have fallen out of conversation here, but the same shouldn’t be said when considering an investment portfolio. Solar power has become arguably one of the world’s most cost-efficient forms of energy globally since its invention 70 years ago. According to the CSIRO’s GenCost 2023-24 report, wind and solar remain the lowest cost new build electricity technology.
In 2023, independent think tank Ember reported that solar power covered a record high of 5.5% of global electricity, which was double the capability of new coal-powered generation that year. We expect to see continued expansion in this sector, with the Economist reporting solar cells would in all likelihood be the largest source of electricity on the planet by the mid-2030s.
The tremendous growth in the solar sector could be attributed to a number of key factors.
Production expansion
The production of solar panels has been ramping up. As a highly standardised product, manufacturing solar cells has become more efficient and competitive, and China has emerged as the dominant producer. In 2023, China commissioned as many solar cells as the entire world did in 2022, according to International Energy Agency (IEA).
As production scales up, costs will continue to fall, encouraging wider adoption for end consumers. Data suggests that installed solar capacity doubles roughly every three years, which could see a ten-fold increase each decade.
Another advantage of utilising solar is that unlike traditional fossil fuels, the main raw material used in the production – polysilicon – is abundant in nature.
According to Wood Mackenzie, a global renewables and energy data and analytics provider, solar accounted for 75% of all new electricity-generating capacity added to the US grid in the first quarter of 2024. Domestic module manufacturing capacity increased 71% on a quarter-on-quarter basis in Q1 2024, and the firm estimates that with full capability coming up online, solar could satisfy 70% of the domestic electricity demand in the US.
Chart 1: Global solar cell installation forecast for the next decade
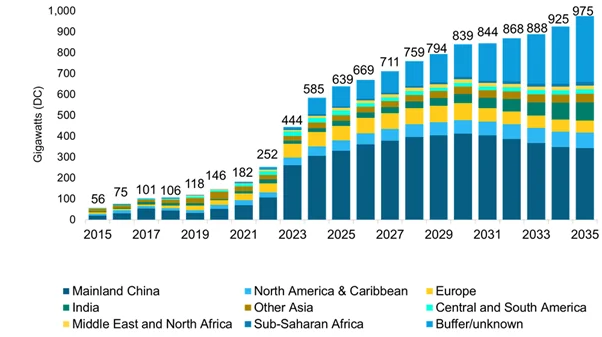
Source: BloombergNEF. Forecast as at 2Q24
Technological advancements
The industry has benefited from technological breakthroughs that have improved the conversion efficiency from sunlight to electricity. Ongoing investments are now being made into battery storage for using solar power in the evening.
The higher capacity has boosted solar’s popularity, which in turn has made production more cost-efficient. IEA data indicates that the average cost of solar panels in the 1980s was around US$30 per watt; in 2020, it was less than $0.50 per watt. That is a 98% reduction in cost within just four decades.
Despite being a 70-year-old technology, companies continue to innovate in this space. At the start of 2024, Portugal-based wind and solar technology leader EDP Renewables was trialling floating solar panels on a hydroelectric dam in Europe’s largest artificial lake. The benefit of this design is that electricity generated from the Sun can be transmitted directly to the dam’s power station, in addition to the potentially improved efficiency of the panels from the cool water beneath it.
Government policies and incentives
As countries around the world race to meet their climate targets, many governments have introduced policies and incentives supportive to the renewables sectors, and solar power is typically included.
Domestic solar panel companies have been subsidised in China, and these could become one of the ‘new productive forces’ as the nation continues its economic rebalancing.
In the US, the Inflation Reduction Act (IRA) has provided stimulus packages to its own solar sector. California, for instance, has been providing tax credits for residential rooftop solar installations to encourage the roll-out. In Australia, there are also federal and state government rebates available for rooftop solar and battery storage that can significantly cut down on costs, and homeowners can sell any excess power to their energy retail provider.
The outlook for solar power
Looking ahead, the attractiveness of the solar sector remains. Estimates suggest the all-in cost of solar-generated electricity could be less than half the price of today's cheapest options.
The cost-effectiveness of solar could be a boon for emerging markets where many households can’t afford to pay for power. In Africa, for instance, there are around 600 million people that have no access to home electricity.
In the US, the future may not be as rosy due to geopolitical headwinds. Presidential candidate Donald Trump has been quite vocal about his negative stance on renewable energy, which could see the development and subsidies in this space severely curtailed as well as impact accessibility of solar cells due to trade tensions with China. Although, it is worth noting that the US renewable energy powerhouse is the stanchly red state of Texas, having installed more solar power capacity than California. Meanwhile, the largest urban solar project in North America has just been approved in Alberta, Canada.
Investors can gain exposure to a portfolio of companies in the clean energy sector via the VanEck Global Clean Energy ETF (ASX: CLNE).
Key risks:
An investment in our clean energy ETF carries risks associated with: ASX trading time differences, financial markets generally, individual company management, industry sectors, foreign currency, emerging markets, country or sector concentration, political, regulatory and tax risks, fund operations, liquidity and tracking an index. See the VanEck Global Clean Energy ETF PDS and TMD for more details.


Published: 02 August 2024
Any views expressed are opinions of the author at the time of writing and is not a recommendation to act.
VanEck Investments Limited (ACN 146 596 116 AFSL 416755) (VanEck) is the issuer and responsible entity of all VanEck exchange traded funds (Funds) trading on the ASX. This information is general in nature and not personal advice, it does not take into account any person’s financial objectives, situation or needs. The product disclosure statement (PDS) and the target market determination (TMD) for all Funds are available at vaneck.com.au. You should consider whether or not an investment in any Fund is appropriate for you. Investments in a Fund involve risks associated with financial markets. These risks vary depending on a Fund’s investment objective. Refer to the applicable PDS and TMD for more details on risks. Investment returns and capital are not guaranteed.