Great rotations
The economy moves in cycles. Like the seasons of the year, there are four identifiable stages that make up the economic cycle. They are expansion, slowdown, contraction and recovery.
Equity and bond markets don’t tend to move with the economic cycle. Rather they tend to move in anticipation of the economic cycle. Because the stages of the economic cycle, unlike the seasons of the year, vary in length and magnitude, predicting economic conditions is difficult. This unpredictability makes investing difficult too.
Like the economic cycle, the equity market cycle can be divided into four stages. They are the bottom, the bull market rally, the peak and the bear market fall. Again, the rallies and falls tend to vary in length and magnitude.
Chart 1: The market cycle
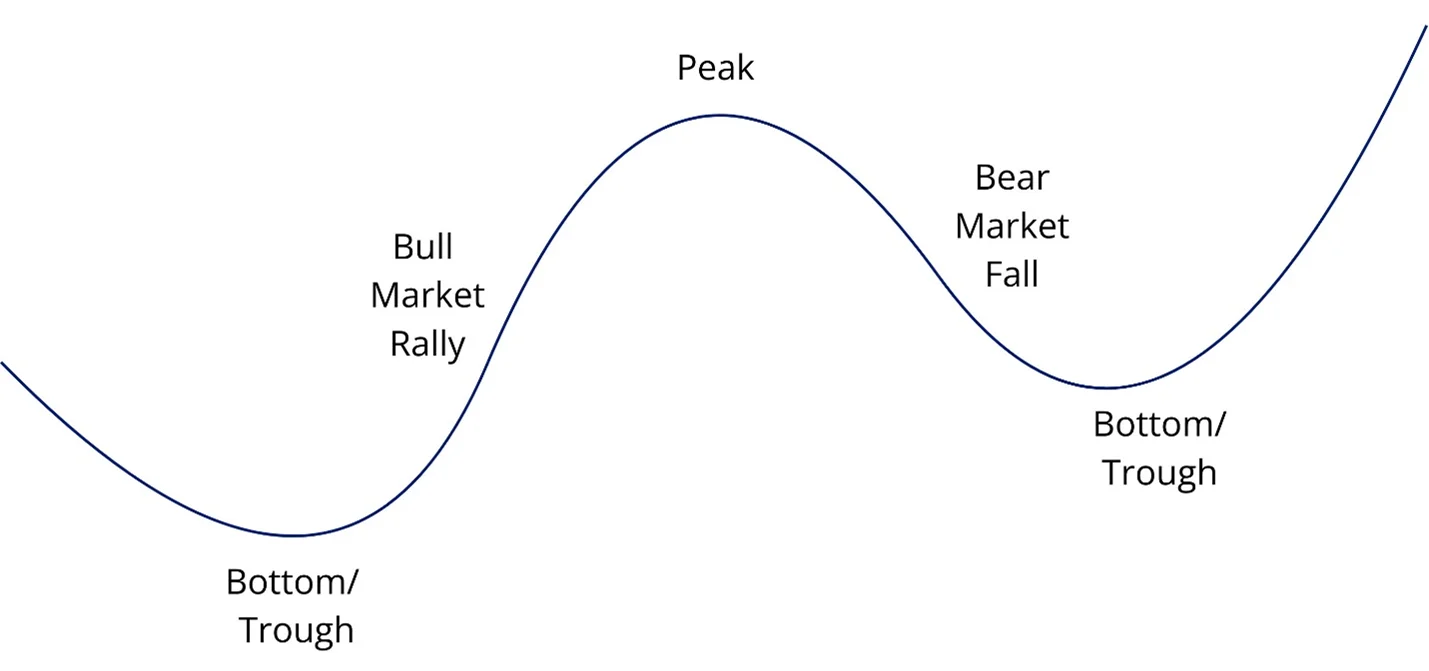
The bottom of the equity market is when a low point is reached. The market, in theory, aims to predict this before an economic contraction. A bull market rally follows this market trough. Bull market rallies tend to occur before the economy starts to recover from its slowdown as it expands. Before the next slowdown and contraction, the equity market will peak and in anticipation of economic weakness, will experience a bear market fall. The market will hit a new bottom again, and the market cycle will start anew.
This is crucial for investors to remember because the market will always look ahead and try to work out where the economy is headed. For example, in the depths of an economic slowdown, the market will look ahead to anticipate the next recovery.
The start, middle and end of past economic cycles are all known. Predicting the next one is hard.
Let's see what we know and how we can apply it to portfolios first by looking back at known market cycles (most analysts use the US market for analyses because it has a longer history and because it always has been one of the bigger stock exchanges, it has far more data points).
Table 1: S&P 500 bear and bull market returns
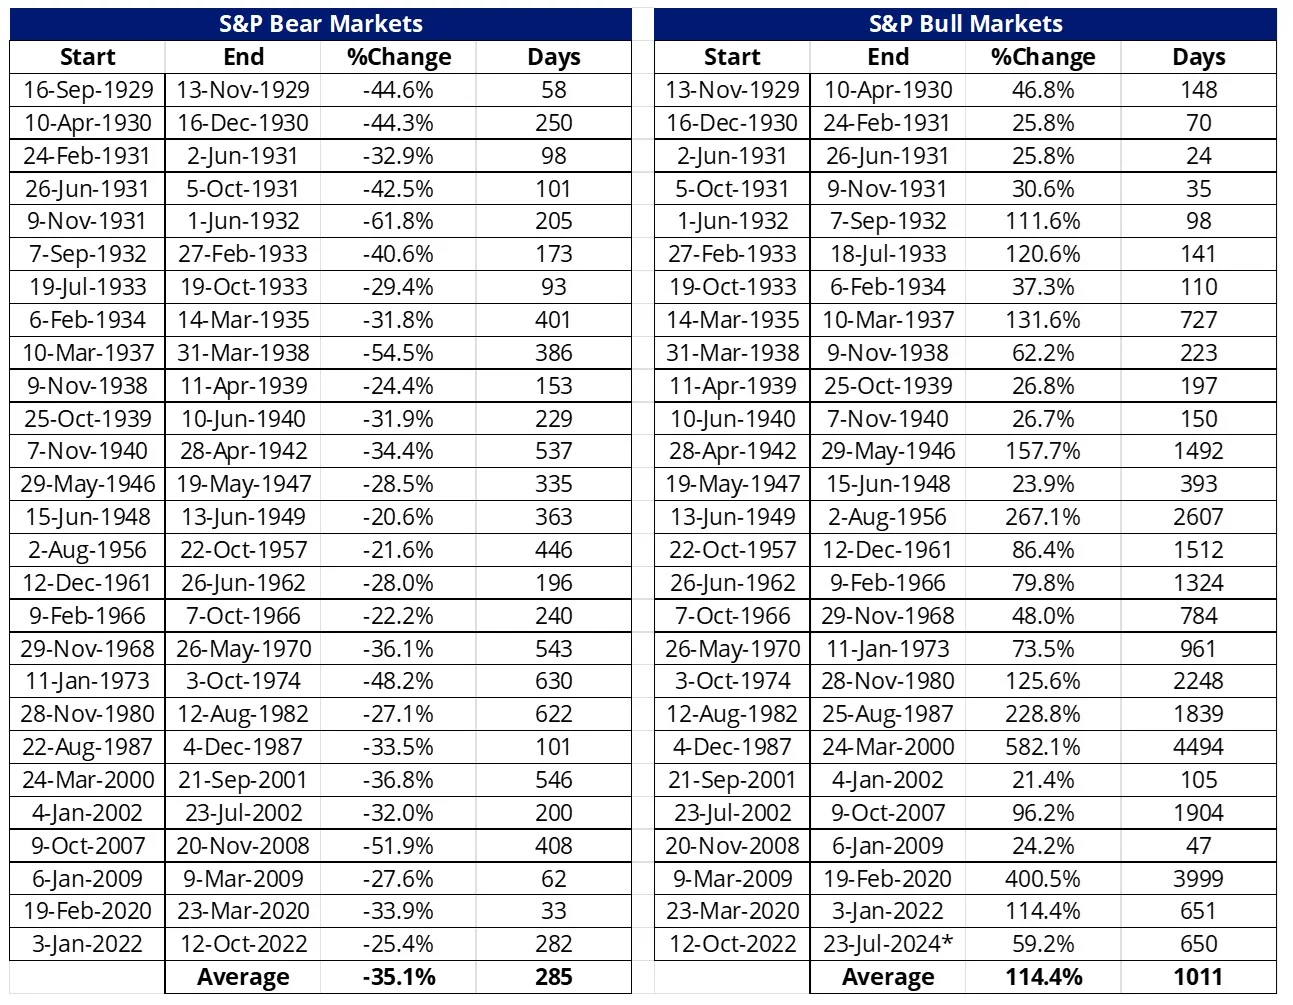
* current period, data to COB 23 July 2024.
Source: BofA US Equity & Quant Strategy, Dartmouth University Data Library, Bloomberg, S&P, Morningstar. Returns in US dollars. You cannot invest in an index. Past performance is not a reliable indicator for future performance. Bull market starts when the market increases 20% following the most recent bear market. A Bear market starts when the market decreases 20% following the most recent bull market. Bull market average does not include the current market.
It has been well reported that the S&P 500 hit an all-time high earlier this month. The US equity market has been in a bull market since October 2022
According to the data, this is the 27th bull market in the S&P 500 since 1928. The average length of the past bull markets was 1,011 days (33 months), with an average rise of about 114%. The longest was almost 11 years, from 2009 until the COVID-19 crisis.
Now compare these to bear markets. There have been 27 of these since 1928. Bear markets tend to be shorter, averaging 286 days (9.5 months). The average fall during a bear market is 35%. The longest was in 1973/74 for almost 2 years.
It has been well noted that since 1928, overall, the US share market has been positive, so while bear markets can be painful over the long term the US share market’s return has been positive. There are two reasons for this.
- Markets are positive most of the time – Bear markets comprise only about 20% of the months since 1928. Bull markets around 80%. Therefore, roughly 80% of the time, share markets were rising and they rose by more than they fell. This leads us to reason two.
- The asymmetry of returns – You’ll note above that the average bull market return was more than 100%. It is impossible during a bear market for shares to go down by more than that much. Shares cannot fall more than 100%. Therefore, there is potential for bull markets to experience higher returns than bull market losses. Put simply, over the last century, the larger positive returns of bull markets offset the negative returns of bull markets.
So, let’s look at what is happening now and why ‘rotation’ has become a buzzword.
Over the past month, a rotation has been happening. Value companies have started outperforming growth companies.
What’s behind the recent outperformance of value?
In the past, value companies have outperformed when the market anticipates economic weakness. This is because value companies tend to be less sensitive to changes in macroeconomic conditions.
A quick refresh on ‘value’ investing
Established in the 1930s by Benjamin Graham and David Dodd, value investing uses indicators such as dividend yields and low price-to-book, or price-to-earnings ratios to identify companies where the business potential is not reflected in the share price. It is an approach that has many professional supporters, including Warren Buffett, the founder of Berkshire Hathaway.
By way of contrast, growth investing is a stock-buying strategy that looks for companies that are expected to grow at an above-average rate compared to their industry or the broader market. Since the GFC there has been a large shift to growth investing as advances in technology accelerated, including the advent of new technologies such as the cloud, mobile platforms and more recently AI.
Both growth and value investing can lead to profitable results. Warren Buffet, one of the most highly regarded value investors of all time has pointed out that the two strategies are intrinsically linked. In his 1992 Berkshire Hathaway letter to shareholders, he wrote, “in our opinion, these two approaches are joined at the hip: growth is always a component of the calculation of value, constituting a variable whose importance can range from negligible to enormous.”
There are two main reasons there could be a rotation to value stocks:
- Geopolitics and value tends to be less concentrated
Advanced value strategies also tend to result in more sector diversification than a growth strategy. This is because growth strategies generally lean towards a handful of sectors that have recently experienced earnings growth, which can result in sector and company concentration. For example, the MSCI World Growth Index is currently heavily weighted towards prominent US technology companies. While Apple, Microsoft and NVIDIA alone make up over 26% of the entire index.
By way of contrast, advanced value strategies such as MSCI's Enhanced Value methodology target 'cheap' companies by comparing valuations of companies in the same sector. This results in proportionate sector exposure.
Recently geopolitical concerns have threatened the AI-driven boom in semiconductor stocks and investors have been forced to rethink their equity strategies. Many, fearing concentration risk, have started paring back their IT exposure. Others may be preparing for the next part of the cycle, rotating into those sectors that may outperform in a period of economic weakness into a recovery.
As macroeconomic conditions are predicted to deteriorate, value may be better positioned than growth to withstand any potential downturn.
- It’s cheap
In the charts below, the blue line represents value’s discount relative to growth and the charts illustrate that value is generally cheaper than growth. However, in both charts below you can see that, barring the COVID crisis, value is as cheap as it’s ever been and well below historical averages.
Chart 2: Price to Book Ratio (Value versus Growth)
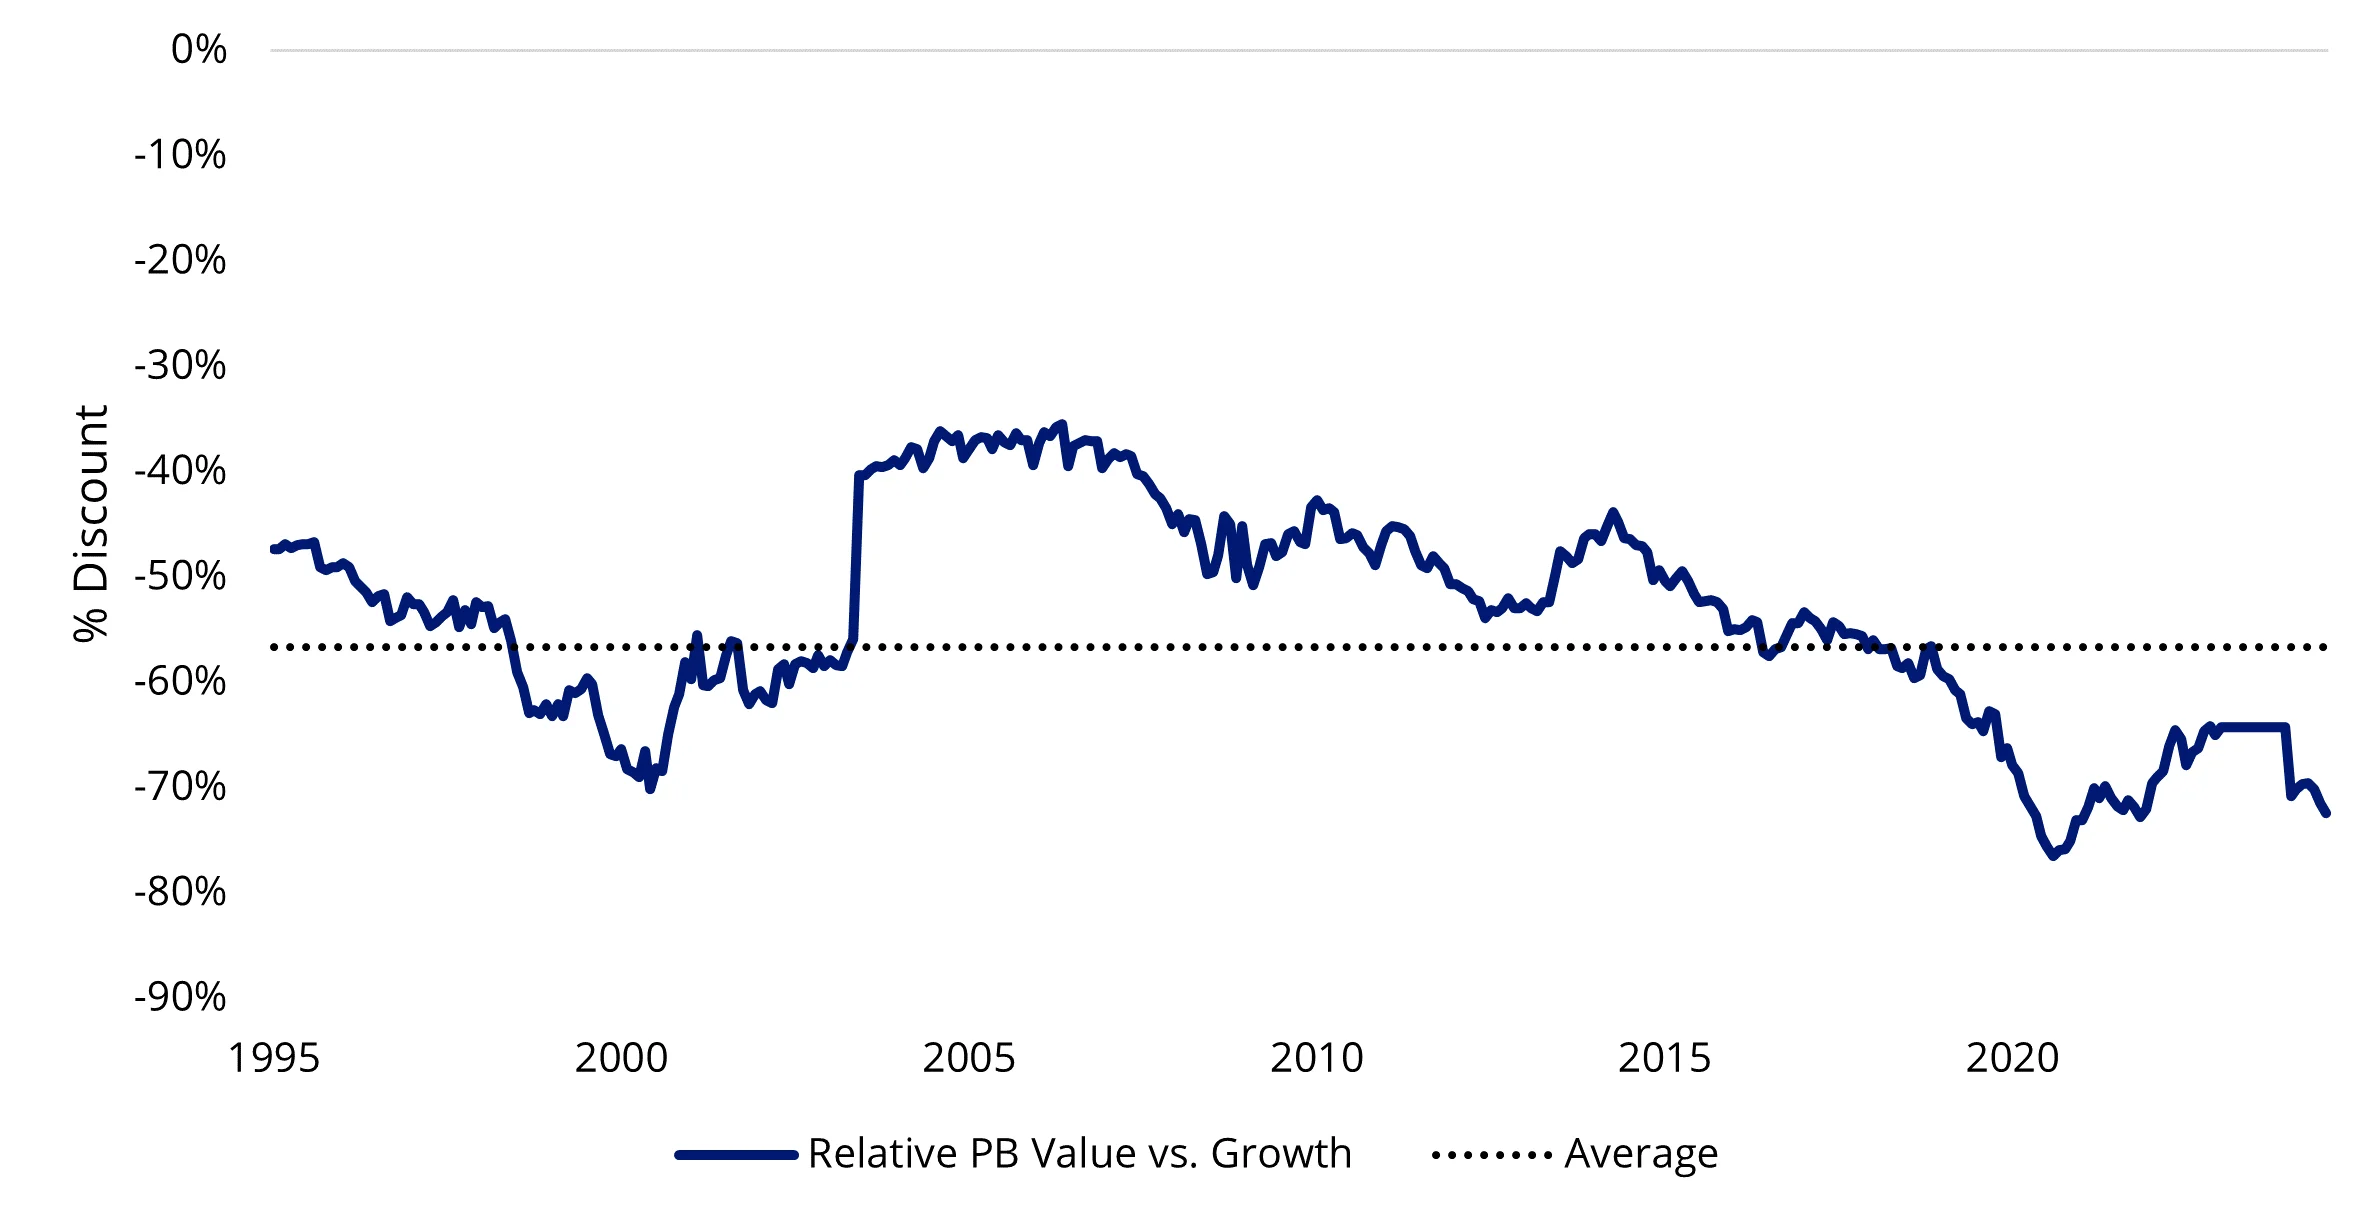
Source: Bloomberg, MSCI. Indices used MSCI World Growth Index, MSCI World Value Index. You cannot invest in an index. Past performance is not a reliable indicator of future performance.
Chart 3: Price to 12m Fwd Earnings Ratio (Value versus Growth)
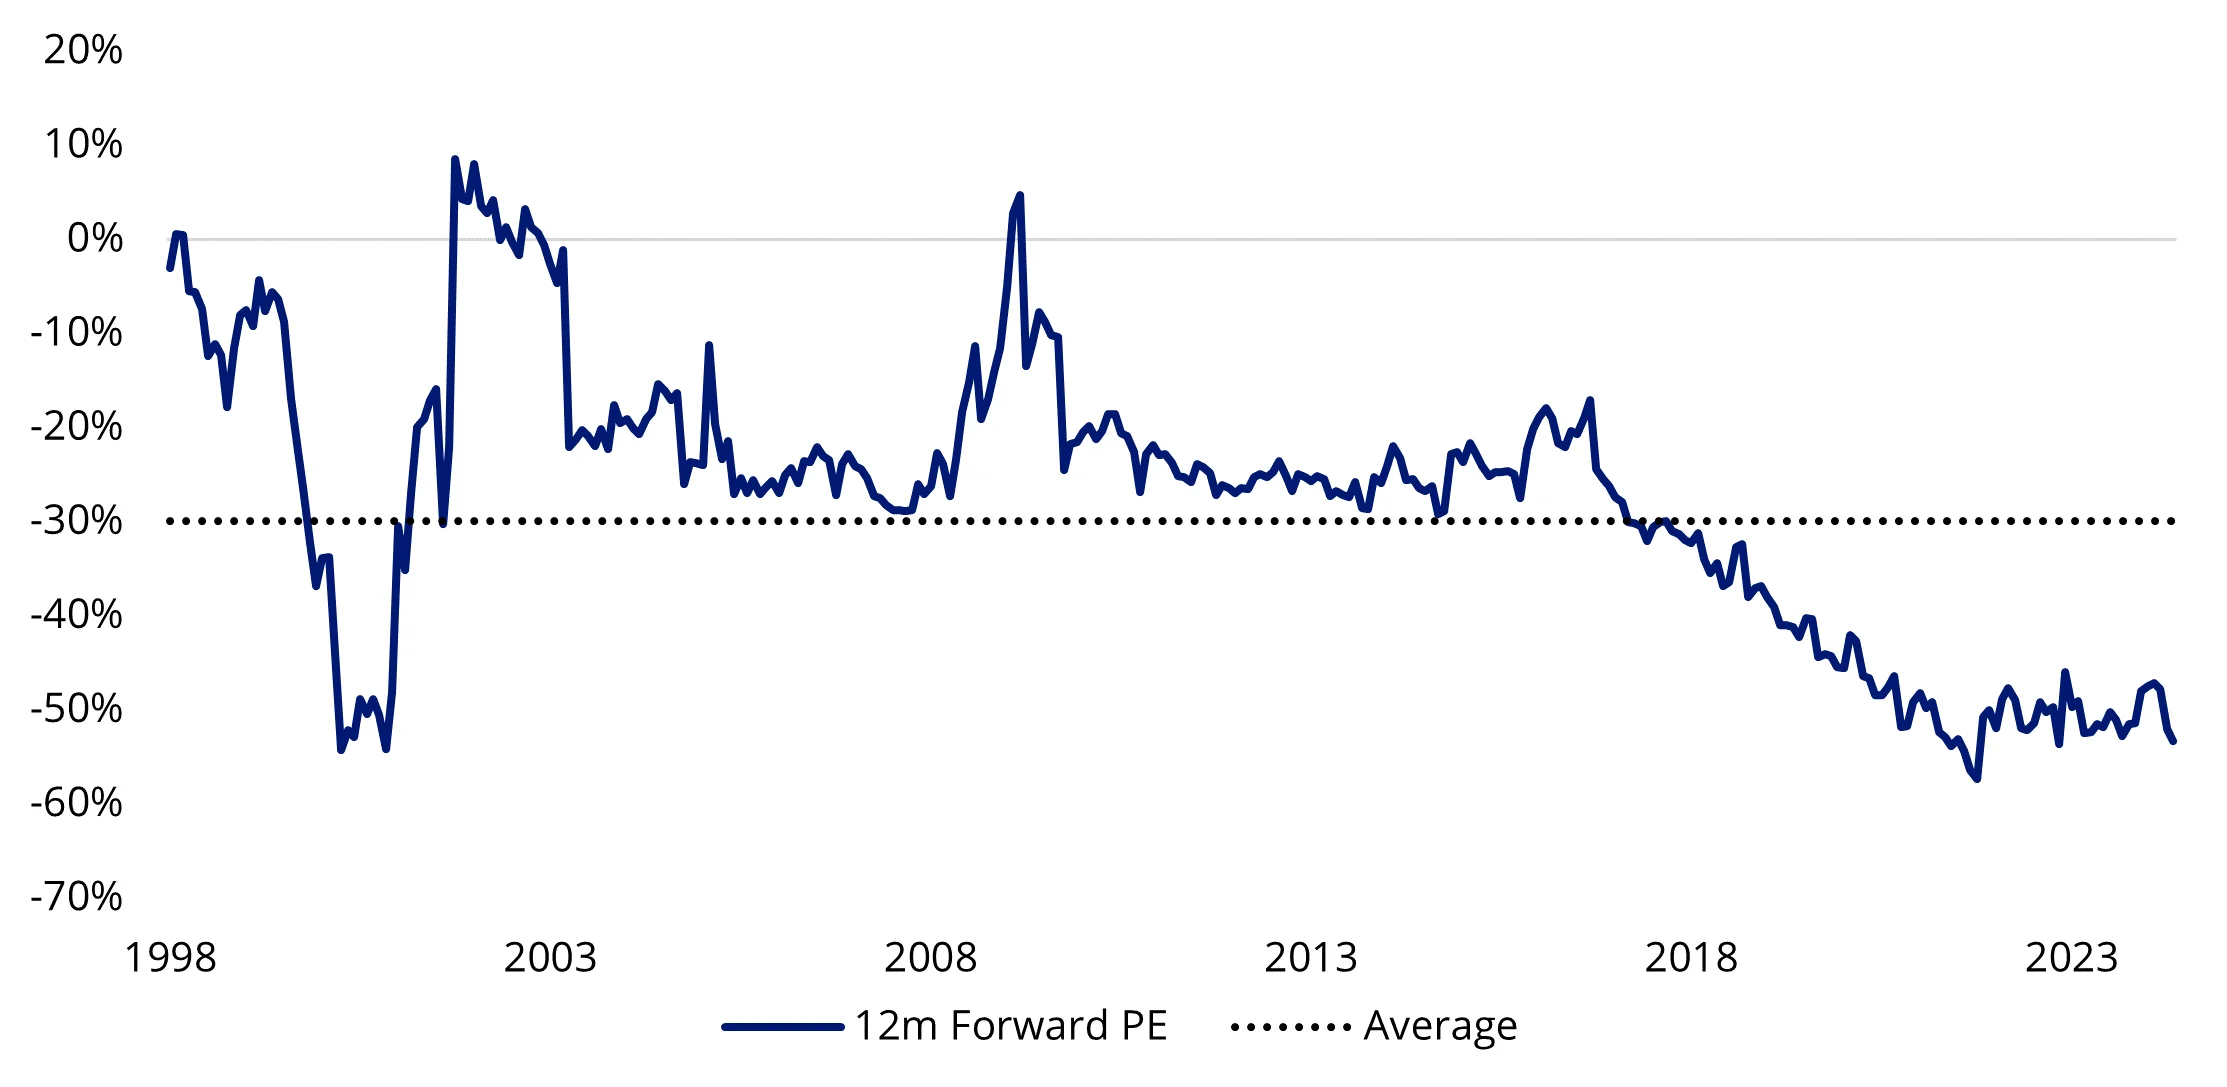
Source: Bloomberg, MSCI. Indices used MSCI World Growth Index, MSCI World Value Index. You cannot invest in an index. Past performance is not a reliable indicator of future performance.
Value abroad
In the recent past, the overall market has been propelled by the returns of the so-called ‘magnificent seven’. Each of these companies is in MSCI’s Growth Index. While these growth companies have flourished many other ‘growth’ companies have struggled in the face of recent high inflation and subsequent high interest rates. The returns of the S&P 500 index excluding these stocks have barely risen over the past five years.
The US represents over 70% of the MSCI World Index. In the chart below when the blue line is rising, the MSCI World Enhanced Value Index is outperforming the MSCI World Growth Index. You can see value after underperforming since its 2022 rally and value could benefit from a rotation that may be just starting.
Chart 4: Is Value ready to grow again?
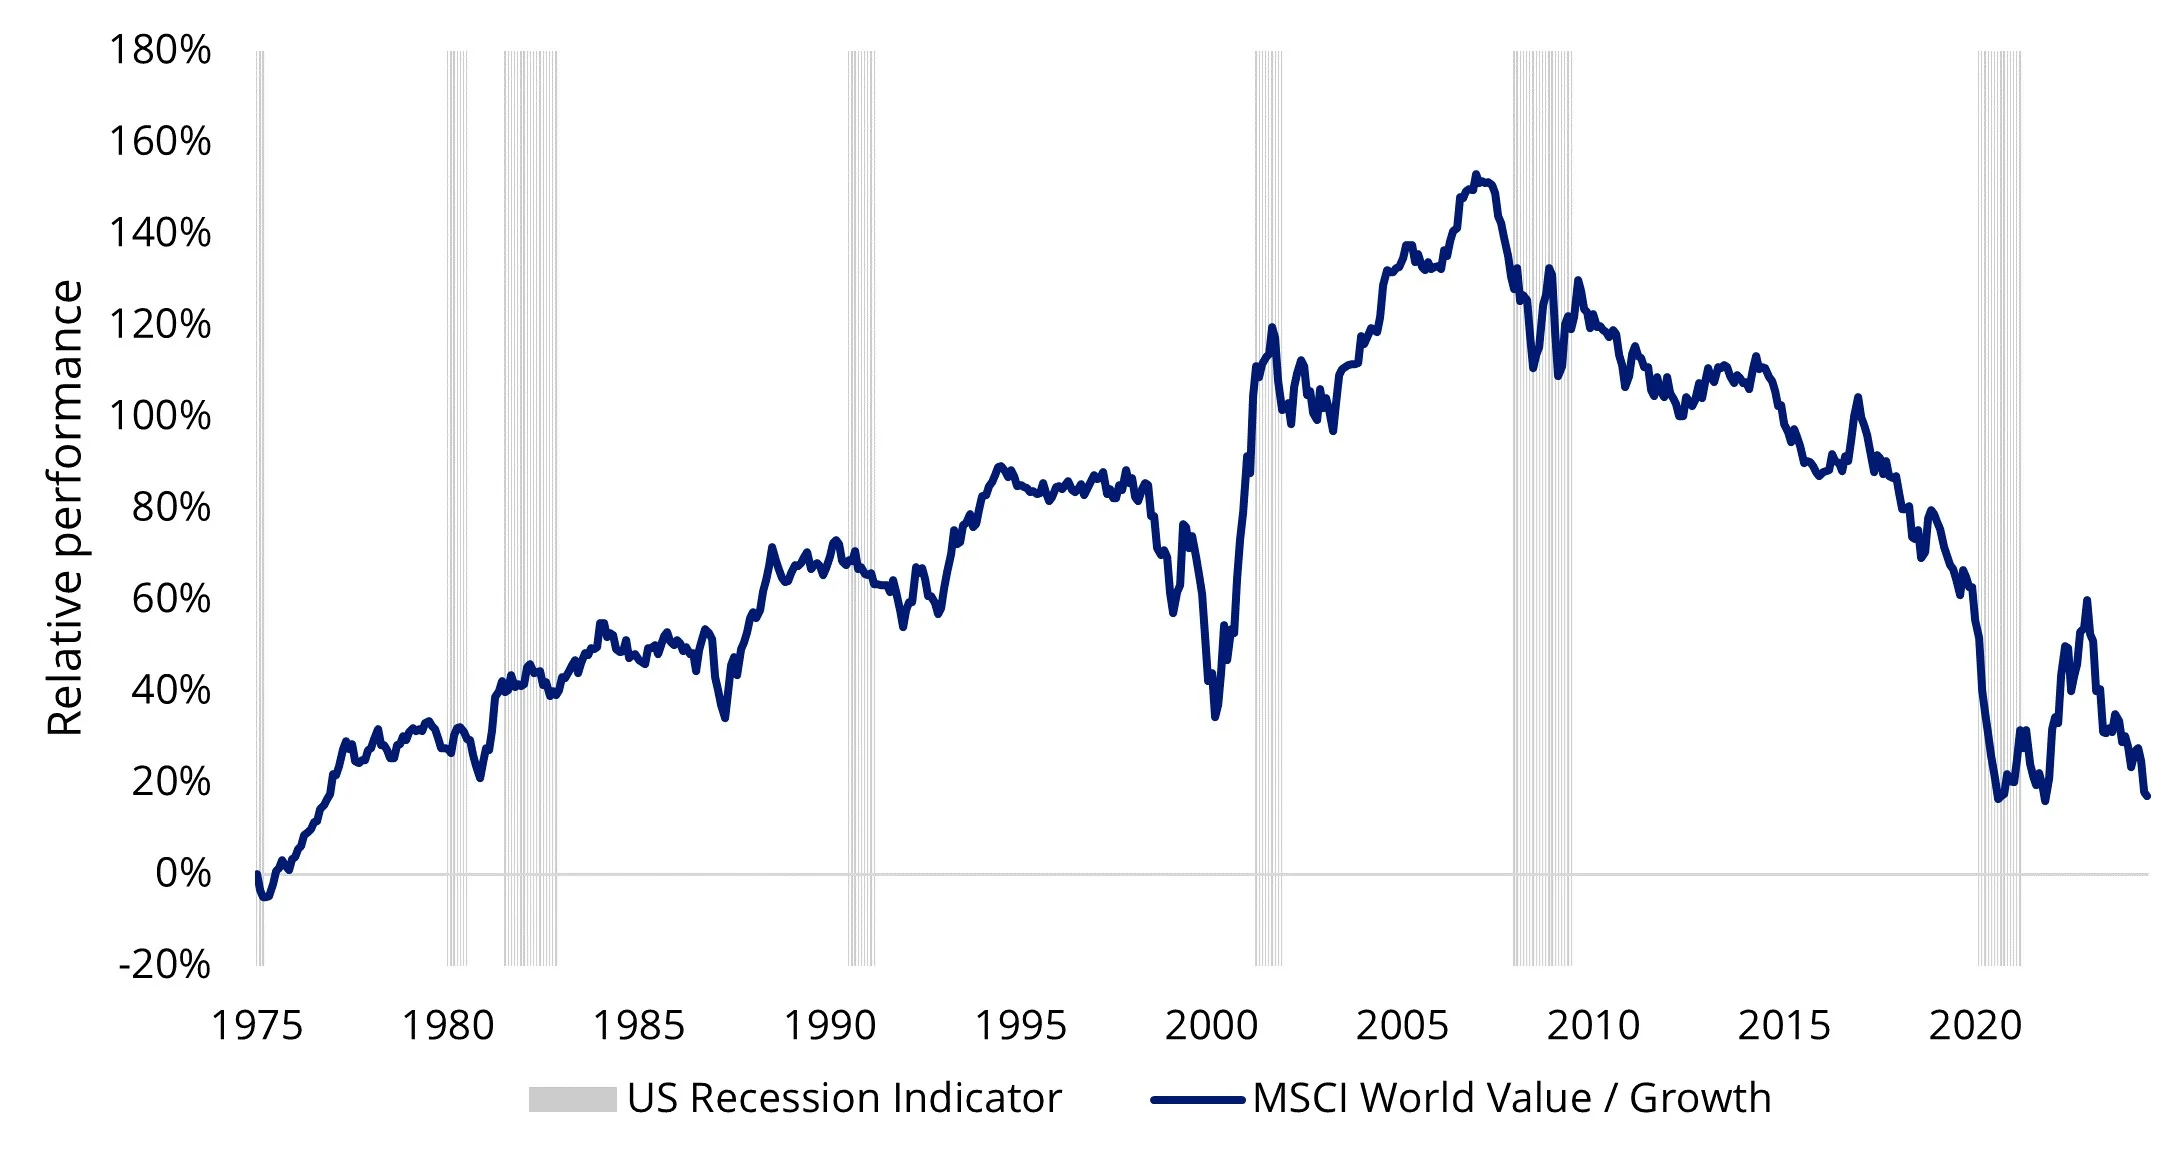
Source: MSCI, Bloomberg. Past performance is not a reliable indicator of future performance. You cannot invest in an index.
Despite where the economy may be headed, we are excited about the return prospects ahead.
Investors seeking to tap the current ‘value’ trends may wish to consider the VanEck MSCI International Value ETF (VLUE) which tracks the MSCI World ex Australia Enhanced Value Top 250 Select Index (VLUE Index).
Should value continue to outperform, ETFs provide investors a way to gain exposure, both here and abroad. They also allow investors to manage their portfolios for the other ‘seasons’ of the cycle.
Key risks
An investment in VLUE carries risks associated with: ASX trading time differences, financial markets generally, individual company management, industry sectors, foreign currency, country or sector concentration, political, regulatory and tax risks, fund operations, liquidity and tracking an index. See the PDS for details.
Related Insights


Published: 26 July 2024
Any views expressed are opinions of the author at the time of writing and is not a recommendation to act.
VanEck Investments Limited (ACN 146 596 116 AFSL 416755) (VanEck) is the issuer and responsible entity of all VanEck exchange traded funds (Funds) trading on the ASX. This information is general in nature and not personal advice, it does not take into account any person’s financial objectives, situation or needs. The product disclosure statement (PDS) and the target market determination (TMD) for all Funds are available at vaneck.com.au. You should consider whether or not an investment in any Fund is appropriate for you. Investments in a Fund involve risks associated with financial markets. These risks vary depending on a Fund’s investment objective. Refer to the applicable PDS and TMD for more details on risks. Investment returns and capital are not guaranteed.