Investing through the seasons
We move through economic cycles much like we do the seasons. Just as those that prepare for changes in temperature can find advantage, so too can investors that take an all-seasons portfolio approach.
Every year, December brings the heat of summer, which gives way to autumn and then winter. Seasons are inevitable. Change is constant.
The economic cycle also follows a similar pattern. There are four seasons and there are four stages of the economic cycle. The four stages of the economic cycle however do not last for a set three months. The waves of the economic cycle varies in length and in magnitude and this makes it unpredictable. Change and unpredictability is a feature of markets..
The challenge for investors is finding the investment to suit the season. Alternatively, even, the investment that suits all seasons. This is, if such an investment exists.
Four identifiable stages make up the economic cycle. They are: expansion, slowdown, contraction and recovery.
Chart 1: The economic cycle

Source: VanEck
The direction and the pace of economic activity identify these cycles.
- An expansionary environment is when growth is expanding and an a faster rate;
- A slowdown occurs when economic activity is slowing down after an expansion;
- A contraction occurs when economic growth is negative and it is still falling; and
- A recovery is when economic growth, after the trough of a contraction, starts to head toward growth.
While the temperature points to a change in season, the Purchasing Managers' Index (PMI) is often used as an indicator for changes in economic cycle. The PMI is an index used to measure the prevailing direction of economic trends in the manufacturing and service sectors. It measures the change in production levels across the economy from month-to-month so is considered a key indicator of the state of the economy. The chart below shows the three-month rolling PMI changes since 1997, highlighting the stage of the economic cycle at that time.
Chart 2: ISM Manufacturing PMI Index
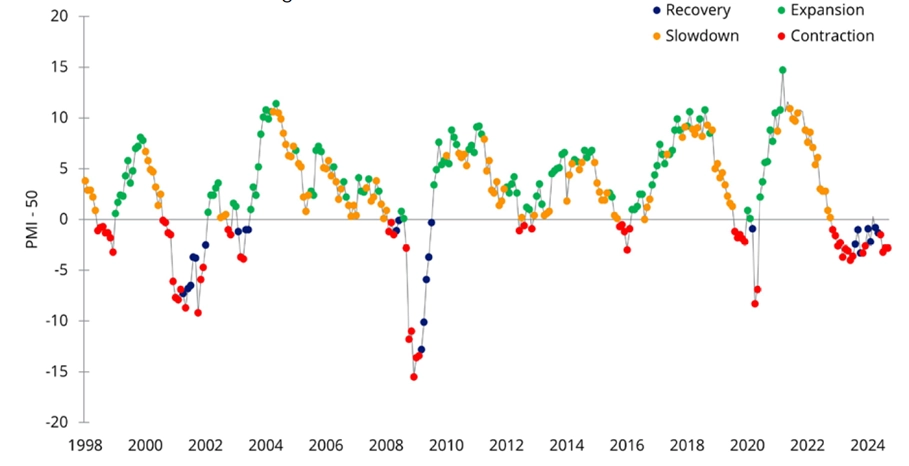
Source: VanEck, Bloomberg. November 1998 to November 2024.
Over that same period, the international share market, as represented by the MSCI World ex Australia Index, has risen despite the falls experienced in the dot.com bust, the GFC and the COVID crisis.
Chart 3: Growth of 10,000: MSCI World ex Australia Index
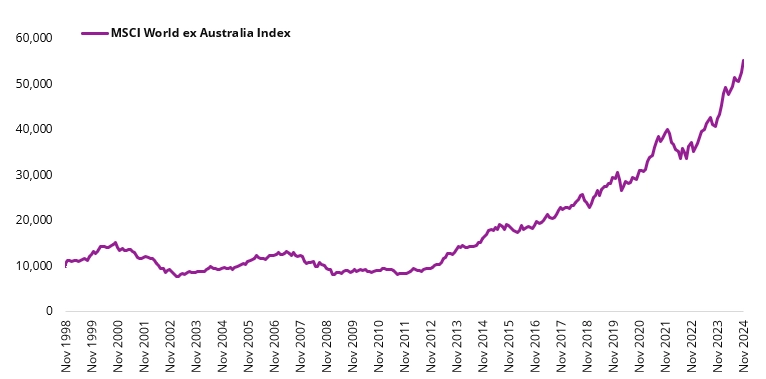
Source: Morningstar Direct, as at 31 January 2022. Past performance is not a reliable indicator of future performance. You cannot invest in an index. Results are calculated to the last business day of the month and assume immediate reinvestment of all dividends and exclude fees and costs associated with investing
The MSCI World ex Australia Index above is a market capitalisation index. For Australian investors this is the ‘market’ for international equities. While it has risen over the past 25 years, according to MSCI, “Over time, individual factors have delivered outperformance relative to the market.”1That is factors have risen more.
These individual ‘factors’ are any characteristic that helps explain the long-term risk and return performance of an asset. According to MSCI “Factors are well documented in academic research and have been used extensively in portfolio risk models and in quantitative investment strategies. Active fund managers use these characteristics in their security selection and portfolio construction process.”
MSCI’s factor indices, which aim to capture the risk and return of factors, perform differently during different economic regimes. We analysed the performance of MSCI’s equity style factors of enhanced value, momentum, quality and growth since 1998 during the different economic regimes outlined above, in Chart 2. The performance of each factor broken up by each economic ‘season’ is presented below.
Table 1: Total performance (% per annum) during different economic regimes
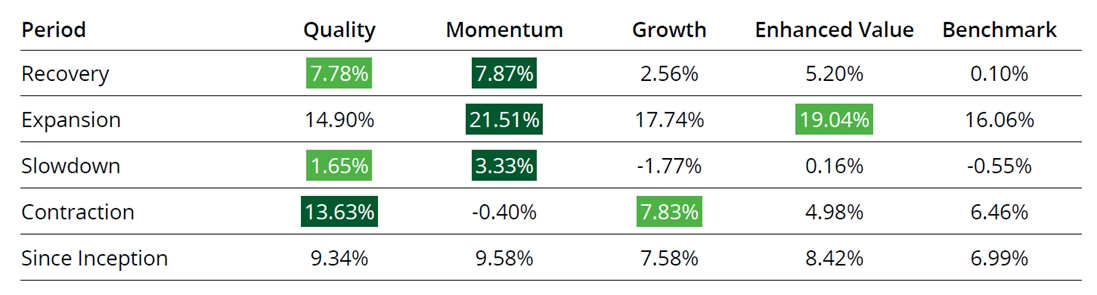
Source: VanEck, Bloomberg. November 1998 to September 2024. Past performance is not a reliable indicator of future performance.
You can see that the quality factor is either the top performing factor or the second best in three out of the four economic regimes. It is second overall. During the one season of the economic cycle in which quality came fourth, expansionary environments, enhanced value and momentum outperformed.
Another way to consider the performance above is relative to the benchmark. This is shown in the table below. You can see that quality’s relative underperformance during expansion is dwarfed by its strong relative outperformance during recoveries and contractions. Enhanced value meanwhile has the second highest outperformance figure in the table below during an expansion, while also offering strong performance during recoveries. The lowest figure in the tables 2 is under momentum, which falls the most, during contractions.
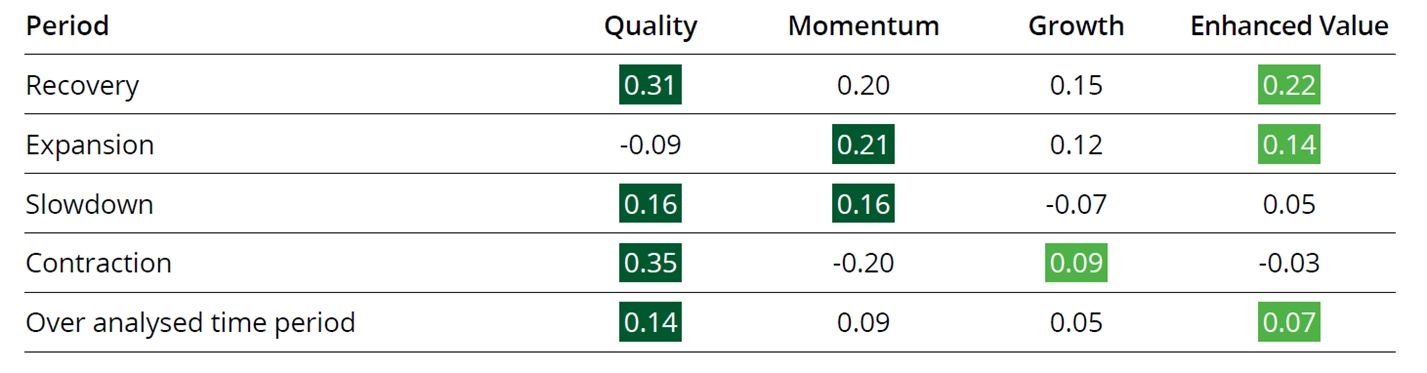
Table 2: Performance differential (% per annum) compared to MSCI World ex Australia benchmark during different economic regimes
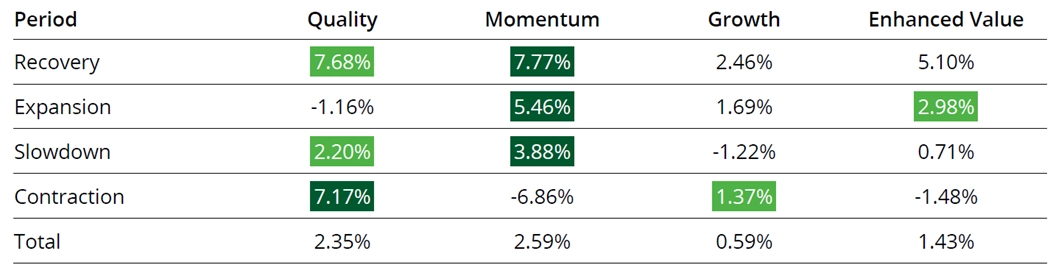
Source: VanEck, Bloomberg. November 1998 to September 2024. Past performance is not a reliable indicator of future performance. Performance differential is calculated by subtracting the total return from the return of the benchmark.
Naturally, investors are concerned about negative returns and volatility. These are risks. The information ratio combines the return differential with the volatility of those returns. Traditionally it has been used by investors is to evaluate the skill of a portfolio manager at generating returns in excess of the benchmark. The higher the information ratio, the better.
Table 3: Information ratio during different economic regimes
Source: VanEck, Bloomberg. November 1998 to September 2024. Past performance is not a reliable indicator of future performance.
You can see from the above that quality has the highest information ratio in slowdowns, contractions and recoveries. Quality has the highest information ratio over the time period analysed, indicating it has the best risk adjusted relative returns over the period.
You can see from the above, while quality does have periods of underperformance, its potential to outperform through the cycle means it could potentially be used as the factor for all seasons. During those periods of recovery into expansion, the enhanced value factor could be also be considered, especially in consideration of its strong risk and performance during recoveries.
The chart below is the same as chart 3 above, updated to include MSCI’s quality and enhanced value indices. You can see, consistent with MSCI’s findings, these factors have delivered outperformance relative to the market over time. Prior to the GFC as economies were recovering and expanding (more green and blue dots in chart 2) enhanced value outperformed. During the contraction and sluggish growth (slowdown) following the GFC and the COVID-19 lockdowns, quality came to the fore.
Chart 4: Growth of 10,000: MSCI World ex Australia Index, MSCI World ex Australia Quality Index and MSCI World ex Australia Enhanced Value Top 250 Select Index
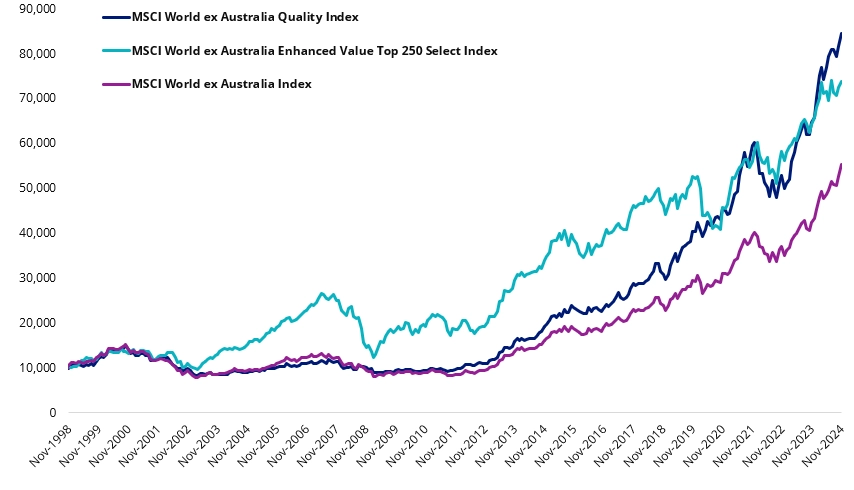
Source: Morningstar Direct, as at 30 November 2024. Past performance is not a reliable indicator of future performance. The above graph is a comparison of performance of MSCI World ex Australia Quality Index, MSCI World ex Australia Enhanced Value Top 250 Select Index and the parent index, based to 10,000 from 30 November 1998. Results are calculated to the last business day of the month and assume immediate reinvestment of all dividends and exclude fees and costs associated with investing in VLUE or QUAL. You cannot invest in an index. QUAL’s Index base date is calculated at 30 November 1994. QUAL Index performance prior to its launch on 15 October 2014 is simulated. VLUE’s Index base date is calculated at 30 November 1998. VLUE Index performance prior to its launch on 15 February 2021 is simulated. The MSCI World ex Australia Index (“MSCI World ex Aus”) is shown for comparison purposes as it is the widely recognised benchmark used to measure the performance of developed market large- and mid-cap companies, weighted by market capitalisation. QUAL and VLUE’s index have fewer companies and different country and industry allocations than MSCI World ex Aus.
It is challenging for investors to navigate economic conditions and prevailing markets. ETFs that capture the factors outlined are being used by savvy investors as tools, to either hold through the cycle, or blend, to help mitigate the troughs of the cycle. You can learn more about the quality factor and quality investing via our dedicated quality education site; or learn about the value factor and value investing here.
As always we recommend you speak to an investment professional to determine which investment is right for you.
Key risks
An investment in VLUE or QUAL carries risks associated with: ASX trading time differences, financial markets generally, individual company management, industry sectors, foreign currency, country or sector concentration, political, regulatory and tax risks, fund operations and tracking an index. See the PDS and TMD for more details.


Last Updated On: 09 December 2024
1– Introducing MSCI Factor Indexes
Any views expressed are opinions of the author at the time of writing and is not a recommendation to act.
VanEck Investments Limited (ACN 146 596 116 AFSL 416755) (VanEck) is the issuer and responsible entity of all VanEck exchange traded funds (Funds) trading on the ASX. This information is general in nature and not personal advice, it does not take into account any person’s financial objectives, situation or needs. The product disclosure statement (PDS) and the target market determination (TMD) for all Funds are available at vaneck.com.au. You should consider whether or not an investment in any Fund is appropriate for you. Investments in a Fund involve risks associated with financial markets. These risks vary depending on a Fund’s investment objective. Refer to the applicable PDS and TMD for more details on risks. Investment returns and capital are not guaranteed.
VLUE and QUAL are indexed to a MSCI index. VLUE and QUAL are not sponsored, endorsed or promoted by MSCI, and MSCI bears no liability with respect to VLUE, QUAL or the indices. The PDS contains a more detailed description of the limited relationship MSCI has with VanEck and the funds.