Managing Australian share market risk
There is a myth that a passive investment strategy which tracks a market capitalisation index minimises risks. The Australian benchmark market capitalisation index provides an excellent example for debunking this myth, with just a little bit of maths...
Most Australian equity investors think they are diversifying and therefore taking on less risk when they invest in passive funds that track the S&P/ASX 200 Index. It sounds odd, but by tracking the market benchmark in Australia, investors actually get the opposite of diversification: concentration.
Most investors equate risk with losses and one way to mitigate losses is to diversify. Diversification provides the potential to reduce losses from some stocks with offsetting gains from others. An equities portfolio should be diversified by sector and stock so no single sector or stock should dominate the portfolio.
Simply put, the Australian benchmark, the market capitalisation weighted S&P/ASX 200 Index, is dominated by financials and materials (including miners) companies. Passive funds which track this index, and even active Australian equity managers not wanting to risk significant underperformance or deviation from the benchmark, carry these inherent biases in their portfolios. This means most Australian investors’ portfolios are overexposed to the largest stocks on ASX: the big 4 banks, the mega-cap miners and their sectors. This creates concentration risk in Australian portfolios. Concentration makes sense if you have high conviction in these stocks and sectors, but for a core strategic allocation it introduces unintended risk. Investors buying a ‘diversified’ Australian portfolio would assume that their fund is more diversified than just 10 stocks representing over 45% of the portfolio and one sector (financials) representing over 35%, as tracking the S&P/ASX 200 produces.
Sector and stock concentration risk
Because of this bias in the market, Australian equity investors are overly exposed to the financials’ sector and therefore the difficulties those companies face.
In 2017, the S&P/ASX 200 Accumulation Index rose 11.80% – dragged down by financials, which rose just 5.05%, as measured by the S&P/ASX 200 Financials Index. Banks operate in mature markets and are struggling to achieve earnings growth in a low interest-rate environment. That’s not likely to change anytime soon. They are now also subject to a royal commission which may further dent banks’ reputations and earnings ability.
In contrast, one of the best performing sectors last year, information technology, rose 26.02% as represented by the S&P/ASX 200 Information Technology Index, yet this sector makes up just 1.90% of the S&P/ASX 200.
Managing Australian share market risk with alternative weighting
Rather than construct an index by its constituents’ size, like the S&P/ASX 200, an alternative method is to equally weight the constituents. The MVIS Australia Equal Weight Index (MVW Index) includes only the largest and most liquid companies on ASX, currently 81 stocks, and equally weights them once a quarter at each rebalance.
Australian equity market – stocks weights
The mega-caps that dominate the Australian market have not changed significantly over time. They have always been the big banks and the big miners.
S&P/ASX 200 Top 10 Securities - 2001 to 2017
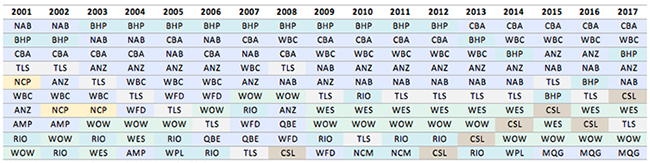
Source: Factset, VanEck, Data from 2001 to December 2017.
Because of the MVW Index’s equal weight construction methodology, at last rebalance no stock was more than 1.3%. Therefore, the MVW Index has less stock concentration risk than the S&P/ASX 200 Index.
Australian equity market – sector weights
The table below highlights the dominance of financials (dark blue) in the S&P/ASX 200, followed by the materials (light blue). The dark blue and light blue areas dominate the table through time.
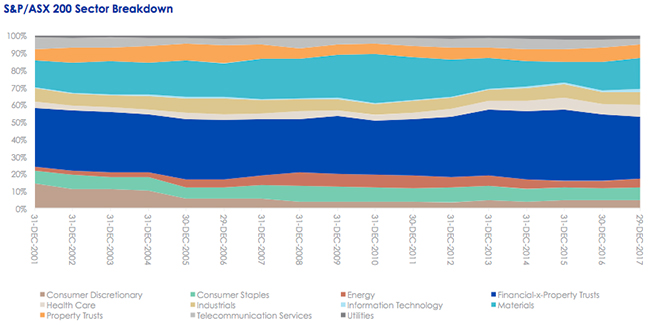
Source: Factset, VanEck, Data from 2000 to December 2017
As a consequence of MVW Index’s construction methodology, it will be underweight, relative to the S&P/ASX 200, sectors that contain larger than average companies. For example, the MVW Index is currently underweight the financials’ sector by 16.2% compared to the S&P/ASX 200. Conversely it will be overweight sectors that contain smaller than average companies. The MVW Index is currently overweight IT by 1.88%. Therefore, the MVW Index has less sector concentration risk than the S&P/ASX 200.
A mathematical investigation of diversification
There are two mathematical proofs that provide more evidence that the MVW Index is better diversified than the S&P/ASX 200: the Herfindahl Index and some very complex calculus.
The Herfindahl Index was developed by economist Orris Clemens Herfindahl. Herfindahl first used his calculation to determine the concentration within the US steel industry. The concentration calculation has been used in fields beyond economics such as aeronautics and biochemistry. It also measures diversification. As at 31 December 2017, the Herfindahl Index for the S&P/ASX 200 Index was 294. The equivalent measure for the MVW Index was 123. In other words, the MVW Index is 2.39 times more diversified than the S&P/ASX 200.
Further, in 2014 Hamich and Brown provided mathematical proof “that equal weight is the portfolio construction approach that gives the best diversification for the long term. Not just better than market capitalisation, but the best possible diversification among any portfolio construction strategy.” The maths involved is complex and included in Appendix 2 article - here. Alternatively, the Australian Financial Review summarised these findings for the lay person - here (AFR subscription required).
Performance
The MVW Index has outperformed the S&P/ASX 200 Accumulation Index in 12 out of the last 15 years. VanEck Vectors Australian Equal Weight ETF (MVW), which tracks the MVW Index, has outperformed in each of the three calendar years it has been trading on ASX, outperforming by 4.16% p.a. since its inception.
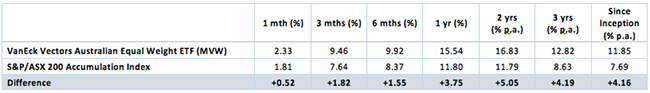
Inception date is 4 March, 2014.
Source: Morningstar Direct, as at 29 December 2017. Source:
Morningstar Direct, as at 29 December 2017. Results are calculated daily to the
last business day of the month and assume immediate reinvestment of all
dividends. MVW results are net of management fees and other costs incurred in
the fund but do not include brokerage costs or buy/sell spreads incurred when investing
in MVW. Past performance is not a reliable indicator of future performance. The MVW Index was launched on 29 November
2013 with a base date of 31 December 2002.
MVW Index performance prior to its launch date is simulated based on the
Index’s current methodology.
In summary, investing in a fund that tracks a market capitalisation benchmark index does not always reduce risk. There is mathematical proof that the MVW Index is better diversified than the Australian market benchmark. As a result, VanEck Vectors Australian Equal Weight ETF reduces stock and sector concentration risk inherent in the S&P/ASX 200. While diversification won't prevent a loss, it can mitigate the impact of sector and stock specific risks on your portfolio. According to the experts, equal weight is the portfolio construction approach that gives the best diversification for the long term. Not just better than market capitalisation, but the best possible diversification among any portfolio construction strategy.
IMPORTANT NOTICE:
All figures in this email are as at 31 December 2017 unless otherwise noted.
This information is issued by VanEck Investments Limited ABN 22 146 596 116 AFSL 416755 (‘VanEck’) as responsible entity of the VanEck Vectors Australian Equal Weight ETF (MVW) (‘Fund’). This is general information only and not financial advice. It does not take into account any person’s individual objectives, financial situation or needs. Before making an investment decision in relation to the Fund, you should read the PDS and with the assistance of a financial adviser consider if it is appropriate for your circumstances. The PDS is available at www.vaneck.com.au or by calling 1300 68 38 37. The Fund is subject to investment risk, including possible loss of capital invested. Past performance is not a reliable indicator of future performance. No member of the VanEck group of companies gives any guarantee or assurance as to the repayment of capital, the payment of income, the performance or any particular rate of return from the Fund.
MVIS Australia Equal Weight Index (‘MVW Index’) is the exclusive property of MV Index Solutions GmbH based in Frankfurt, Germany ('MVIS'). MVIS makes no representation regarding the advisability of investing in the Fund. MVIS has contracted with Solactive AG to maintain and calculate the MVW Index. Solactive uses its best efforts to ensure that the MVW Index is calculated correctly. Irrespective of its obligations towards MVIS, Solactive has no obligation to point out errors in the MVW Index to third parties.

Published: 09 August 2018