Size does matter: Five reasons your Aussie equity exposure should be the best of large- and small-caps into 2023
If you research some of Australia’s largest companies, you’ll discover that many of them were smaller businesses not that long ago. On every company’s way to the top they have to pass through the middle. Investors often overlook medium sized companies as they are considered riskier than their large-cap peers. Yet historically, investors who have added mid-caps to their portfolios have been rewarded for additional risk with superior long-term returns.
After all, as they say, from little things big things grow.
The mid-cap segment of the Aussie market is underappreciated. Mid-cap companies can offer a balance between the high growth of small caps and the stability of large caps. The Australian mid-caps are characterised by successful companies with strong growth profiles, which can offer attractive diversification benefits to Australian equity portfolios.
What are Australian mid-caps
The term mid-caps generally refers to Australia’s 51 to 100 largest companies and are represented by the S&P/ASX Midcap 50 Index. Companies that sit in this band have a lot to offer investors. Notably, since S&P created its S&P/ASX index series in 2000, the S&P/ASX Midcap 50 Index has been its shining light.
Chart 1: Hypothetical growth of 10,000 performance
Source: VanEck, Morningstar. Data to 31 October 2022. S&P/ASX Index series launched April 2000. Results are calculated to the last business day of the month and assume immediate reinvestment of all dividends and exclude costs associated with investing in MVE. You cannot invest directly in an index. Past performance is not a reliable indicator of future performance. Indices rebased to 10,000.
While past performance is not reliable indicator of future performance, we think that Australian mid-caps warrant consideration for your portfolio.
There are five main reasons why you should consider Aussie midcaps to your portfolio:
1. DiversificationMany large-cap and broad based Australian indices are highly concentrated in sectors such as financials and materials. For example, financials and materials together comprise more than 50 per cent of the S&P/ASX 200. While the top 10 companies by weight represent over 45% of the S&P/ASX 200.
Mid-caps, by way of contrast offer more sector diversification for investors, with the financials and materials sectors making up only 36% of the mid-caps universe. Mid-caps also provide more exposure than either small or large caps to healthcare, industrials, IT and utilities. The performance of the S&P/ASX200 and S&P/ASX300 is so heavily driven by large-cap stocks that investors get little exposure to mid-cap performance.
Because the mid-cap index is distributed across market sectors, it is potentially less susceptible to movements due to macro themes, such as weakening commodity prices. This means good companies are rewarded on their merit, rather than the prevailing market sentiment.
As shown in Chart 2, the financials sector makes up 34% of the S&P/ASX 50, while only representing 10% of the S&P/ASX Midcap 50. The mid-cap and small-cap indices also have higher proportions of exposure to consumer discretionary stocks, while the S&P/ASX Midcap 50 has higher allocations to communication services, industrials, IT, energy and materials than the other market cap indices. For those seeking to track companies across a wide range of industries, the S&P/ASX Midcap 50 provides this opportunity.
Chart 2: Mid-caps offer greater sector diversification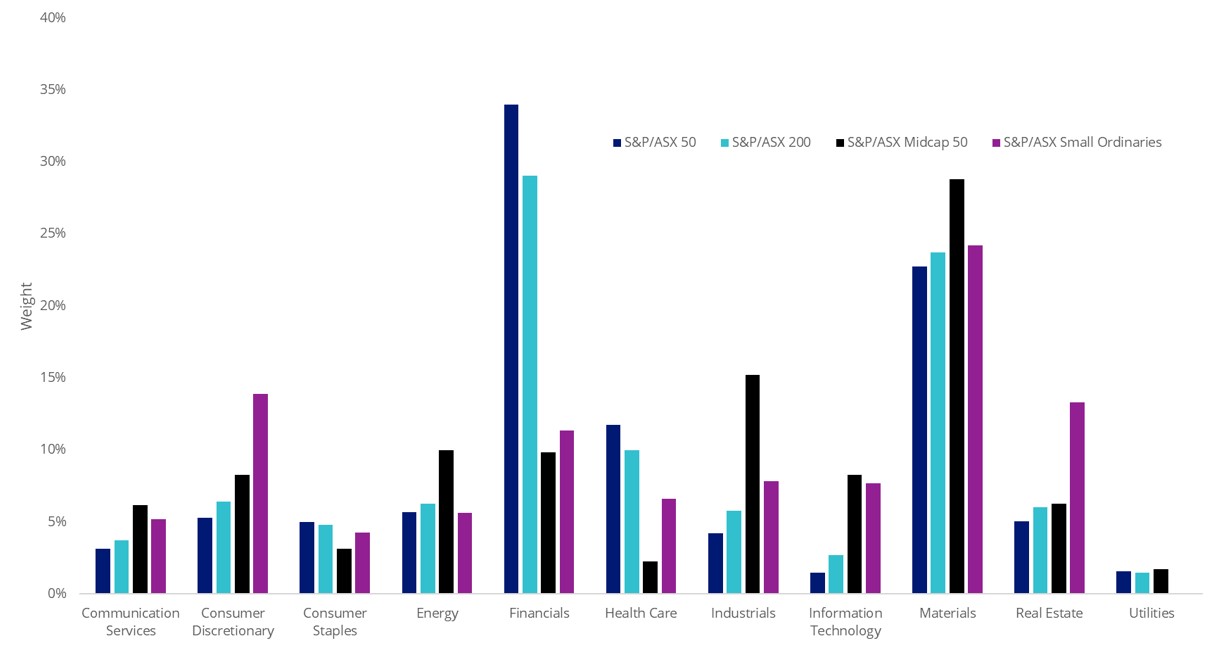
Source: FactSet, 19 November 2022.
2. Gearing up for growthMid-cap companies are often well positioned for growth. Very few of the mega caps that dominate Australian markets are likely to double or triple in size, but those mid-caps that became large caps, at one time did that.
Mid-caps typically have strong management teams like those mega caps. They also often have in common: an established business strategy, strong cash flow, a competitive advantage, access to debt markets and perhaps most importantly, the hunger and capacity for growth.
Unlike high risk small-caps however, mid-caps are not often speculative start-ups or explorers which often burn through capital at a rapid rate, hoping to make it one day before crashing and burning.
Like small caps, mid-caps have room to capture market share, offer new products, enter new markets, gain economies of scale, or obtain intellectual property quickly.
Moreover, the mid-caps space is rife with attractive takeover targets. Mid-cap companies are frequently the object of merger and acquisition activity, which is generally positive for a company’s share price.
For example, BHP recently reached a $9.6 billion-dollar deal to buy copper and nickel producer Oz Minerals. Since BHP’s initial offer in August, Oz Minerals share price has rocketed up 50%.
3. Hidden gemsIn Australia, companies outside the top 50 are often under-researched by stock analysts and therefore potentially mispriced, presenting opportunities for astute investors to cherry pick the best opportunities. It is here some of the country’s best stock pickers find their best ideas.
Large caps are covered in such depth by every analyst in the market that there are no hidden gems to find. Large caps give you straightforward equity returns, but you are never going to get a spectacular above-market return. Mid-caps have greater potential upside, but as always more reward may come with extra risk.
4. Strong alignment
The senior management teams of mid cap companies are often well established, having been with the company for a number of years. Sometimes the management team have significant equity in the business, usually as a result of participating in the IPO. This equity in the business combined with long service, can help to align management’s interests with other shareholders.
5. Mid-caps versus small and mid-cap activeRecently S&P Dow Jones Indices released its much publicised SPIVA Mid-Year Australian Scorecard. The SPIVA Scorecard reports on the performance of actively managed funds against their respective benchmark indices.
Where active management once ruled, the SPIVA Scorecard shows a sharp increase in the number of active small- and mid-cap managers that are falling behind the index. Ten years ago, the 2013 Mid-Year survey showed that over 90% of active small companies funds outperformed over the prior 12 months, over 85% outperformed over 3 years and over 80% outperformed over 5 years. The index used in 2013 was the S&P/ASX Small Ordinaries Index.
SPIVA now utilise the S&P/ASX Mid-Small Index because many active small-cap managers are invested in small and mid-cap stocks. Mid-caps, it appears, were driving this impressive active performance.
A review of this year’s survey does not look as good for active managers. Only 35% of active small- and mid-cap funds outperformed over the prior 12 months, 50% outperformed over 3 years, but only 40% outperformed over 5 years.
2022 has been a difficult time for markets, reinforcing that as macroeconomic regimes change, investors need to look through the gloss of stellar years and question the long-term sustainability of different active approaches. A range of active small- and mid-cap managers that were riding the growth and unprofitable tech wave of the past few years have underperformed in the current market environment.
As markets turned, many small-and mid-cap managers have struggled to keep up with the VanEck S&P MidCap ETF (MVE), the only ETF on ASX that tracks the S&P/ASX Midcap 50 Index.
Chart 3: 2022 active small- and mid-cap year-to-date performance
Source: Morningstar Direct, Returns 1 Jan 2022 to 31 October 2022. Fund Manager Funds are Primary Funds in Morningstar Direct that have S&P/ASX Midcap Index or S&P/ASX Small Companies Fund as its primary index. Results calculated to the last business day of the month and assume immediate reinvestment of all dividends. MVE results are net of management fees and other costs incurred in the fund but do not include brokerage costs and buy/sell spreads incurred when investing in MVE. Past performance is not a reliable indicator of future performance.
It is harder for active small and mid-cap managers to beat the index that includes mid-caps.
Current Australian mid-caps worth a mention
Whitehaven Coal has been on a tear in 2022, up 230 per cent year to date. Underpinning the company’s rise is the meteoric increase in the price of thermal coal, the world’s go-to for energy production. This stemmed from the Ukraine crisis and the European Union’s subsequent ban on imports of Russian coal, which took effect earlier in August, and has taken out a chunk of the global coal supply. It has forced many European countries to go further afield to Australia to source coal for supplies of the fuel, driven too by greater urgency as winter looms.
Another mid cap of note is lithium miner, Pilbara Minerals. The company’s share price has shot up almost 40% in 2022 alongside lithium prices. Investment Bank, Macquarie has recently rated Pilbara as outperform. Saying in a recent note, the company offers “full lithium exposure through its Pilgangoora operation.” Macquarie says, “lithium supply remains tight at each key component of the EV battery supply chain.”
Meanwhile, wealth management company, AMP was one of four local stocks among the best picks at the recent highly regarded Sohn Hearts & Mind Investment Conference. According to the Australian Financial Review, stock pickers are eyeing deep value in the Wealth Manager because “the sum of the parts are worth more than its market capitalisation of $4 billion” and, “AMP keeps getting cheaper.”
And the good news is, all three of the aforementioned stocks, along with a number of other great Aussie mid-caps are part of VanEck’s S&P/ASX Mid Cap ETF (ASX:MVE). MVE is the only ASX-listed ETF that tracks the S&P/ASX Midcap 50 Index.
An investment in MVE carries risks associated with: financial markets generally, individual company management, industry sectors, fund operations and tracking an index. See the PDS for details.


Published: 24 November 2022
Any views expressed are opinions of the author at the time of writing and is not a recommendation to act.
VanEck Investments Limited (ACN 146 596 116 AFSL 416755) (VanEck) is the issuer and responsible entity of all VanEck exchange trades funds (Funds) listed on the ASX. This is general advice only and does not take into account any person’s financial objectives, situation or needs. The product disclosure statement (PDS) and the target market determination (TMD) for all Funds are available at vaneck.com.au. You should consider whether or not an investment in any Fund is appropriate for you. Investments in a Fund involve risks associated with financial markets. These risks vary depending on a Fund’s investment objective. Refer to the applicable PDS and TMD for more details on risks. Investment returns and capital are not guaranteed.