The harmony of investing
In Chinese philosophy, Yin and Yang describe how seemingly opposite or contrary forces may actually be complementary, interconnected and interdependent. Optimal utility is at the point of equilibrium where Yin and Yang find themselves in complete balance. The Australian equity market is an example of imbalance. Most Australian equity portfolios are not in equilibrium but you don’t need to be a Taoist to remedy this.
The Chinese have a single solution for everything, Yin and Yang. Every single element present in the universe can be categorised into Yin or Yang. Optimal utility is at the point of equilibrium where Yin and Yang find themselves in complete balance. This philosophy governs the laws of society, medicine, martial arts and everything under the moon (Yin) or the sun (Yang).
Investing is no different and the Australian equity market, when viewed through this lens, presents a picture of imbalance. Recent market performance highlights the results of this disparity.
The Australian market is represented by the S&P/ASX 200 Accumulation Index (S&P/ASX 200) which is a ‘market capitalisation’ index. This means larger companies with larger market capitalisations represent a larger part of the index. In a concentrated market like Australia the top 10 stocks make up over 45% of the total market. This is not balanced. The Australian market is imbalanced from a sector perspective too as some sectors dominate and others are barely present.
The poor performance of large resource companies and the banks in 2015/16 has highlighted the shortcomings of using the S&P/ASX 200 as the foundation of an investment strategy. Up until the fourth quarter of 2015, investors in S&P/ASX 200 funds had been allocating more and more to financials as their prices increased, even though better opportunities for growth were elsewhere. In 2016 this has impacted the returns of investors whose portfolios closely matched the S&P/ASX 200.
An alternative exists for investors who want both Yin and Yang – one in which all of its holdings are in complete balance. The VanEck Vectors Australian Equal Weight ETF (ASX code: MVW) currently equally weights the largest most liquid 81 stocks listed on ASX. MVW includes the ASX Top 10, but in MVW these make up 12% of the portfolio so the individual weightings of each of these stocks are in balance with the individual weightings of each of the stocks that make up the remaining 88% of MVW.
The performance speaks for itself.
MVW has outperformed the S&P/ASX 200 by 9.73% over the past twelve months returning 19.03% compared to the S&P/ASX 200’s 9.30%.
When compared to all 336 open ended Australian Large Cap Blend funds analysed by Morningstar in Australia in the last 12 months, MVW is 7th. Since the beginning of 2016 MVW holds 1st place as the best performing Australian Large Cap fund.
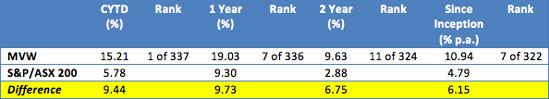
Inception date is March 4, 2014.
Source: Morningstar Direct, VanEck, as at 31 August 2016. Results are calculated daily to the last business day of the month and assume immediate reinvestment of all dividends. MVW results are net of management costs but do not include brokerage costs of investing in MVW. Past performance is not a reliable indicator of future performance.
Morningstar’s Australian Open Ended Equity Universe is based on the defined universe funds that invest primarily in large Australian companies. Stocks in the top 70% of the Australian equities market based on market cap are defined as ‘large’. Comparison universe. The ‘blend’ style is assigned to portfolios where neither growth nor value characteristics dominate.
Please contact us or speak to your VanEck Vectors ETF specialist to allocate your Australian equity portfolio to MVW.
IMPORTANT NOTICE:
This information is issued by VanEck Investments Limited ABN 22 146 596 116 AFSL 416755 (“VanEck”) as responsible entity of the VanEck Vectors Australian Equal Weight ETF (ASX:MVW) (”the Fund”). This is general information only and not financial advice. It is intended for use by financial services professionals only. It does not take into account any person’s individual objectives, financial situation or needs. Before making an investment decision in relation to the Fund, you should read the PDS and with the assistance of a financial adviser consider if it is appropriate for your circumstances. The PDS is available at www.vaneck.com.au or by calling 1300 68 38 37. The Fund is subject to investment risk, including possible loss of capital invested. Past performance is not a reliable indicator of future performance. No member of the VanEck group of companies gives any guarantee or assurance as to the repayment of capital, the payment of income, the performance or any particular rate of return from the Fund.


Published: 09 August 2018