Q: How Would a Mathematician Invest?
A: Equally.
Mathematicians understand the world by investigating numbers and applying logic to what they find. Bringing that discipline to the stockmarket reveals an unexpected answer to a problem, that investors have been trying to solve for a long time.
A proper mathematical proof proceeds in steps, each logically following from its predecessor. But there must be a starting point. A mathematician will tell you that if you start with an 'axiom' that isn't true, your conclusions will be worthless.
Where a lot of investment ideas have gone wrong is starting with the assumption that stockmarket returns follow a normal, or Gaussian, distribution.
Wrong.
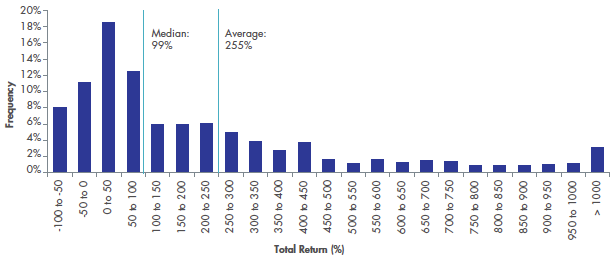
This is a chart of returns for individual US stocks over more than 14 years. It is not a normal distribution:
Figure 1: Individual US Stock returns March 2003 to December 2017

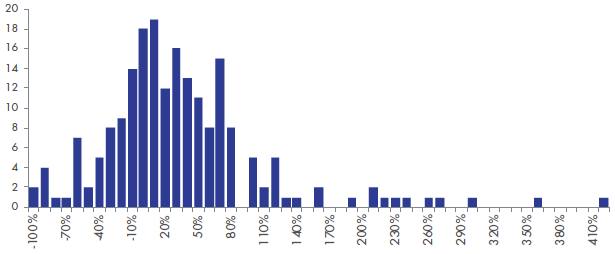
Nor is this, which is based on more recent Australian data:
Figure 2: Returns for the 200 largest Australian stocks three years to May 2018

In each of the two charts:
- The left hand tail is short and stubby because a stock cannot lose more than 100% of its value
- The peak is to the left, not centred
- Increasing the asymmetry, the right hand tail is long and thin, showing that there are some stocks with very high returns
As more people are discovering that this is what the true distribution of stock returns look like, a consensus has been reached to call this distribution 'skewed'. Skew is the topic du jour for mathematical investors.
The visual description of this skewed distribution is easy. It is scrunched to the left: the left tail can't go below-100% and the right tail is very long.
The definition of a skewed distribution that mathematicians like is the Latinate: 'the mean is greater than the median and the median is greater than the mode'.
Translating back into English, the average is higher than the one in the middle which is higher than the one that occurs the most. This can be seen in Figure 1 where the average and median are marked and they are higher than the peak.
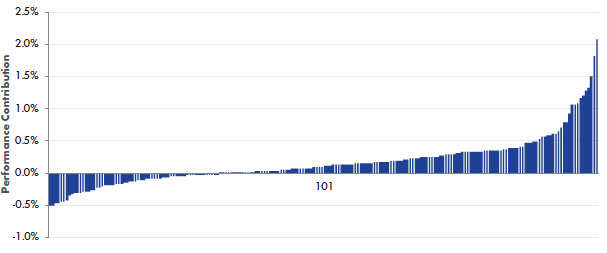
There is a mathematical consequence of this mean-median-mode definition. The stocks in the right hand tail deliver more benefit than the detriment suffered from holding the stocks in the left hand tail. Metaphorically, the very high performers outweigh the very low performers.
This is shown in the following chart where you can see that there is more blue from stock 101 to 200 than there is in stocks 1 to 100.
Figure 3: Returns for the 200 largest Australian stocks in numerical order
Three Years to May 2018

So after two steps in our mathematical journey we have established two things. First, that stock returns are skewed. Second, there are some very high returning stocks that you would have wanted to be exposed to, even if that meant also being exposed to the very low returning stocks. In other words, you would rather be exposed to the two extremes than stuck in the middle.
Not all mathematical words are faux Latin. Some of them are faux Greek. Time to learn the word 'ergodicity'.
Ergodicity is the property of each constituent in a distribution having the same chance to be at any point of the distribution as any other constituent.
In this context, for the distribution of stock returns to be ergodic, at the beginning of the period each stock would have had to have had the same likelihood as any other stock of being in the extreme right or extreme left. If the distribution was ergodic there would be no characteristic of the individuals stocks that could predict that certain stocks had a lesser chance than other stocks of being at either extreme.
The next chart shows this not to be the case by plotting the returns from the Australian data set against the stock's market capitalisation at the beginning of the period.
Figure 4: Returns for the 200 largest Australian stocks versus their market capitalisation
Three Years to May 2018

It can be seen that the companies that were the largest at the beginning of the period produced returns that are far more narrowly distributed than the rest of the stocks. The extremes, where we all would like to have been invested are only populated by the smaller stocks.
The twelve larger cap stocks above the red line have a performance range of -36% (Telstra) to 107% (CSL) compared to the complete range of -100% (Arrium) to 416% (Bluescope Steel). It is interesting that there is a steelmaker at each extreme. That shows how unpredictable the stockmarket is. You're never going to be able to pick which stock is going to come out on top. Investing is still about having a diversified portfolio. But we are discovering a trick to constructing that portfolio.
An investor wants to be at the extremes, particularly the right hand tail, but the larger stocks can't do that. They are in the centre, or left of centre depending on how you define 'centre'. So the trick is to have a lower exposure to these larger stocks and higher exposure to the smaller stocks.
That is not the traditional way to invest. Portfolio investing so often weights stocks based on their market capitalisation. If this was done at the beginning of the Australian data set above, 52% of the portfolio would have been concentrated in the twelve stocks above the red line that delivered the less impressive performance. Only 0.1% of the portfolio would have been in the top performer. At that weighting, that stock's high return becomes less than a rounding error.
There is a simple alternative to market capitalisation weighting and it has a proven track record. As prescribed above, this alternative has lower exposure to the larger stocks and higher exposure to the smaller stocks. The approach is to equal weight the portfolio.
VanEck Vectors Australian Equal Weight ETF (ASX Code: MVW) equal weights 85 highly liquid stocks, giving significant exposure to many smaller stocks that can be at the extreme right of the skewed distribution but would be insignificant in a market capitalisation portfolio. The difference in constituent weightings between this equal weighting scheme and the market capitalisation scheme of the S&P/ASX 200 is shown in the following chart.
Figure 5: MVW vs S&P/ASX 200 Index Constituent Rank and Weightings

Source: Factset, as at 31 May 2018
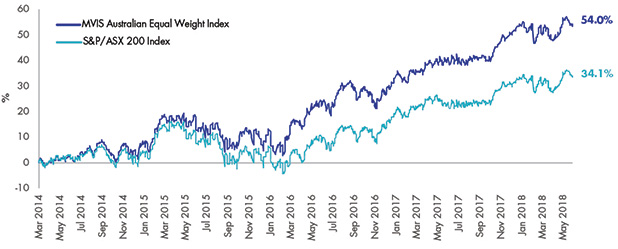
The historic performance of MVW against the S&P/ASX 200 Index has been as follows:
Figure 6: Cumulative returns: MVW vs S&P/ASX 200 Index since MVW inception to 31 May 2018.

Source: Morningstar Direct. Inception date is 4 March 2014. Results are calculated to the last business day of the month and assume immediate reinvestment of distributions. MVW results are net of management costs and expenses, but before brokerage fees or bid/ask spreads incurred when investors buy/sell on the ASX. Past performance is not a reliable indicator of future performance.
A mathematician would prefer an equal weighted portfolio to a market capitalisation portfolio. Why don't you join them?
For those who have enjoyed this mathematical journey, here is a link to a research paper we published recently that covers this analysis in more detail – here
Enjoy.
Important notice: This information is prepared in good faith by VanEck Investments Limited ABN 22 146 596 116 AFSL 416755 ('VanEck') as the responsible entity and issuer of VanEck Vectors Australian Equal Weight ETF ('MVW'). It is general in nature and not financial advice. It does not take into account any person's individual objectives, financial situation or needs. Before making an investment decision investors should read the product disclosure statement and with the assistance of a financial adviser consider if it is appropriate for their circumstances. A copy of the PDS is available at www.vaneck.com.au or by calling 1300 68 38 37. This information is believed to be accurate at the time of compilation but is subject to change. VanEck does not represent or warrant the quality, accuracy, reliability, timeliness or completeness of the information. To the extent permitted by law, VanEck does not accept any liability (whether arising in contract, tort, negligence or otherwise) for any error or omission in the information or for any loss or damage (whether direct, indirect, consequential or otherwise) suffered by any recipient of the information, acting in reliance on it. The MVIS Australia Equal Weight Index ('MVW Index') is the exclusive property of MV Index Solutions GmbH based in Frankfurt, Germany ('MVIS'). MVIS makes no representation regarding the advisability of investing in MVW. MVIS has contracted with Solactive AG to maintain and calculate the MVW Index. Solactive uses its best efforts to ensure that the MVW Index is calculated correctly. Irrespective of its obligations towards MVIS, Solactive has no obligation to point out errors in the MVW Index to third parties. MVW is subject to investment risk, including possible loss of capital invested. Past performance is not a reliable indicator of future performance. No member of the VanEck group guarantees the repayment of capital, the payment of income, performance, or any particular rate of return from the fund.
Published: 09 August 2018


