Invest like a superhero
The ability to heal is what separates some superheroes from others. It’s important your portfolio demonstrates the same ability in the current market environment. Your future depends on it.
Since ancient times the ability to heal quicker has been revered. In Greek mythology Prometheus used it to survive Zeus’ retribution before being rescued by Hercules. More recently it has been popularised in comic books and Hollywood blockbusters. This healing quality gives Wolverine and Deadpool the ability to recover quicker and triumph.
The recent downturn in markets highlights the need for investors to have an investment strategy that, like the best heroes, recovers quicker from shocks and is resilient when times are toughest.
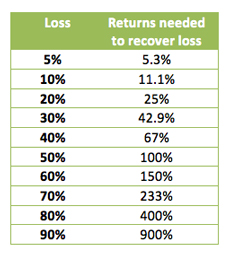
Identifying investments that have the healing factor has been a focus of investors since Graham penned Security Analysis in 1934. Graham’s investment philosophy considered the asymmetric relationship of losses and gains. The outcome of his investment process was a portfolio of companies that during market downturns lost less and recovered faster.
The asymmetry of losses and gains
Graham’s investment process has been labelled “Quality investing” by researchers. Graham defines a Quality company as having “a sufficiently strong financial position and the potential that its earnings will at least be maintained over the years.” He identified seven key characteristics that set Quality companies apart from the rest.
Almost 80 years later MSCI, the world’s largest index provider, created a Quality Index based on Graham’s principals. The MSCI World ex Australia Quality Index (QUAL Index) includes only the highest scoring stocks based on three easily identifiable financial characteristics:
- High return on equity;
- Low earnings variability; and
- Low debt-to-equity ratio.
To measure the healing ability of the QUAL Index a measure called ‘drawdown’ can be used. Drawdown demonstrates both the depth of a fall from an historical peak and the pace of the recovery to a new peak. The maximum drawdown is the distance from the highest peak to the deepest valley. Investments that fall less and recover faster are more desirable.
The chart below shows the drawdown of the QUAL Index versus the broader MSCI World ex Australia Index for the past ten years capturing the GFC. In summary:
- The maximum drawdown of the QUAL Index was 24.28% versus MSCI World ex Australia Index 37.79%
- The pace of recovery of the QUAL Index was eight months quicker.
Drawdown: Jan 2006 - Jan2016
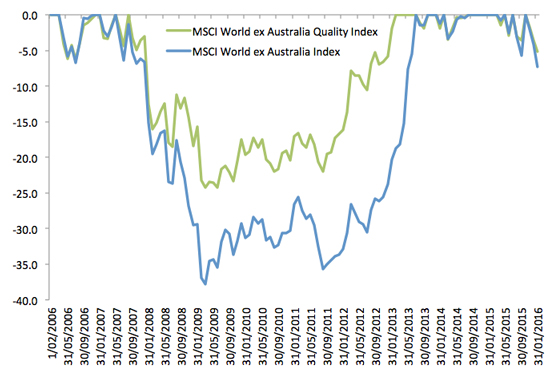
Source: Morningstar Direct. The calculations for the above include the reinvestment of all dividends but do not include management costs or brokerage expenses associated with an investment in the fund. You cannot invest in an index. Results reflect past performance and do not guarantee future results of the index or the fund.
Quality has demonstrated the characteristics of a superhero. It has suffered less and has recovered faster.
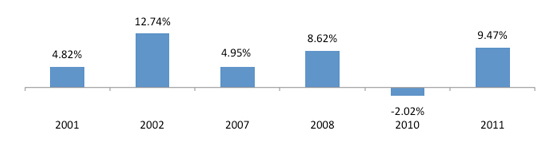
MSCI’s Quality approach also offers strong resilience. It has demonstrated significant outperformance in down markets with less volatility.
Relative performance of the QUAL Index to MSCI World ex Australia Index during the calendar years of negative returns
2000-2016
MSCI World ex Australia Index 1 year rolling return versus universe of quality companies showing lower volatility of the QUAL Index
2000-2016

Source: MSCI, Market Vectors. Results include the reinvestment of all dividends but do not include management costs or brokerage expenses associated with an investment in the fund. You cannot invest in an index. Results reflect past performance and do not guarantee future results of the index or the fund.
In 2014 Market Vectors launched an ETF that tracks the QUAL Index, the Market Vectors MSCI World ex Australia Quality ETF (ASX: QUAL). QUAL is a simple and cost effective strategy that invests in the top 300 Quality companies identified by MSCI.
Australian investors can invest in an international portfolio that can demonstrate a superhero’s healing qualities and resilience on ASX. In the past twelve months QUAL outperformed the MSCI World ex Australia Index by 4.54% returning 9.99%.
Performance of QUAL to 31 January 2016
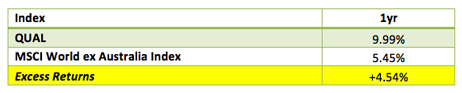
Source: Morningstar Direct, as at 31 January 2016. Results are calculated daily to the last business day of the month and assume immediate reinvestment of all dividends and are net of management costs but do not include brokerage costs of investing in QUAL. The above performance information is not a reliable indicator of current or future performance of QUAL, which may be lower or higher.
If you would like more information on how QUAL please contact our ETF specialists on 02 8038 3300 or email us at info@marketvectors.com.auhere
IMPORTANT NOTICE: This information is issued by Market Vectors Investments Limited ABN 22 146 596 116 AFSL 416755 as responsible entity (‘MVIL’) of the Australian domiciled Market Vectors ETFs (‘Funds’). MVIL is a wholly owned subsidiary of Van Eck Associates Corporation based in New York (‘Van Eck Global’).
This is general information only and not financial advice. It is intended for use by financial services professionals only. It does not take into account any person’s individual objectives, financial situation nor needs (‘circumstances’). Before making an investment decision in relation to a Fund, you should read the applicable product disclosure statement (‘PDS’) and with the assistance of a financial adviser consider if it is appropriate for your circumstances. PDSs are available at www.marketvectors.com.au or by calling 1300 MV ETFs (1300 68 3837).The Funds are subject to investment risk, including possible delays in repayment and loss of capital invested. Past performance is not a reliable indicator of current or future performance. No member of the Van Eck Global group of companies guarantees the repayment of capital, the performance, or any particular rate of return from any Fund.
heightened risks which are in addition to the typical risks associated with investing in the Australian market. These include currency/foreign exchange fluctuations, ASX trading time differences and foreign tax regulations.
QUAL tracks a MSCI Index. QUAL is not sponsored, endorsed, or promoted by MSCI, and MSCI bears no liability with respect to QUAL or the Reference Index. The PDS contains a more detailed description of the limited relationship MSCI has with MVIL and QUAL.
Market Vectors® and Van Eck® are registered trademarks of Van Eck Global.
© 2016 Van Eck Global. All rights reserved.


Published: 09 August 2018