Gold stocks' corner office catalyst
A reinvented gold industry, with companies with lower debt and the ability to generate free cash flow, could help spark interest in gold stocks.
Strong US dollar weakens gold in June
The gold price faced pressure on several fronts in June. The dominant headwind was the US dollar, as the US Dollar Index reached new highs for the year. The synchronised global growth theme that markets were counting on early in the year faded as economic indicators from Europe and many emerging markets have failed to keep pace with those in the US Additional demand for dollars is coming from US government policies, where the Treasury is issuing increasing quantities of debt to fund tax cuts and spending, and the Fed is selling down its hoard of government securities.
Impact of trade and tariffs could support gold
Gold was also caught in the June metals selloff. Copper and zinc suffered sharp falls amid concerns that the Trump administration’s tariff policies will likely dampen demand. While trade policies have adversely affected a number of companies, there is not yet evidence that they are affecting the broader economy or creating additional inflationary pressure. We believe gold will not react positively unless markets see this broader systemic risk emerge. Harley-Davidson announced plans to move some production to its local markets to avoid tariffs. This might become the start of a trend that places the global economy at risk. The Wall Street Journal found that a car costs 50% more in Brazil than a comparable model does in Mexico due to Brazilian protectionist rules that require cars to be assembled in country. Also, the strong US dollar and stimulative fiscal policies are creating import demand that might be temporarily masking the adverse effects of tariff policies.
Gold stocks have outperformed gold since February
Finally, the Fed raised rates for the second time this year on June 13 and upped its guidance to four rate increases in 2018. This lent additional strength to the US dollar, putting pressure on gold. During June, gold fell US$45.35 (3.5%), ending the month near its low for the year at US$1,253.17 per ounce. Gold stocks outperformed gold in June, as the NYSE Arca Gold Miners Index fell by 0.2%.
Gold and gold stocks have shown similar performance in the first half of 2018. Gold declined 3.8%, while the NYSE Arca Gold Miners Index fell 4.0%. The gold price was held in check by a lack of macroeconomic catalysts and the strength of the US dollar. Gold stocks significantly underperformed gold early in the year, with the underperformance reaching 10% in February. However, since then, stocks have outperformed to pull even with gold at mid-year.
Following rate hike, gold could rally following July 4th holiday
The gold price has shown weakness ahead of every Fed rate increase since the hiking cycle started in December 2015. Gold has also rallied immediately after every rate increase, except for two. In June 2017, gold continued to fall after the Fed rate decision, but then rallied following the July 4th holiday week. Again this year, gold continued to fall after the June rate hike and into the week of the holiday. Positioning in the futures market suggests gold is oversold, so we expect to see another delayed rally once the thin holiday trading has passed.
Reinvented gold industry healthy and competitive again
We frequently explain to investors how the gold mining industry has reinvented itself after years of mismanagement. The chart below shows that the return on invested capital (ROIC) for senior gold companies fell below industry peers from 2012 to 2015. ROIC has since risen to historic norms and is again competitive. A number of factors have contributed to the gold industry’s turnaround.
With improved ROIC, gold's again competitive with other industries
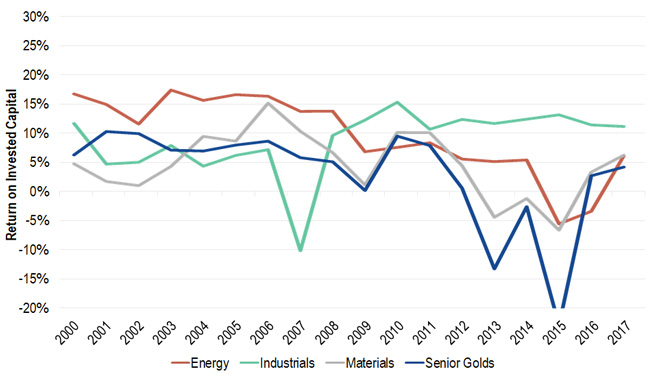
Source: CapIQ; CIBC World Markets Inc. Report as of May 30, 2018. Past performance is no guarantee of future results. Chart is for illustrative purposes only.
Balance sheets are healthy again. CIBC World Markets finds net debt levels have fallen from US$31 billion in 2014 to US$17 billion in 2017, and we expect them to continue to fall. Mining costs have declined roughly 25% since 2012. Adoption of new technologies should allow costs to remain low. Free cash flow yields are expected to rise from 1.8% in 2018 to 8.1% in 2020, assuming a US$1,300 per ounce gold price. Companies have recalibrated their portfolio of mines to focus on properties where they can create the most value. They have also become much better at hitting their targets. RBC Capital Markets found that in 2012, 60% of companies achieved production guidance and less than 50% delivered on original cost guidance. In 2017, production and cost guidance were achieved by 76% and 79% of companies, respectively.
Lasting management changes key to rekindling investor interest
Gold equity valuations are attractive, yet few investors are interested in gold stocks in the current environment. In order to attract investors in the next cycle, we feel companies must show that all of these changes are fundamental and lasting, rather than window dressing to cope with low gold prices. We believe there have been several fundamental changes that insure that wasteful management practices are gone for good:
- Management incentives have changed substantially at the board level. Historically, incentives were centered on production growth. However, it has become very difficult for large gold companies to generate growth and shareholder returns simultaneously. Returns suffered as the quality of gold deposits have declined and costs to develop have increased. Recently boards have restructured incentives to focus on returns rather than growth. As a result, managements are finding innovative ways to mine efficiently and build projects that contribute more to the bottom line.
- Passive gold equity funds have changed the structure of capital formation. In 2011, assets under management (AUM) by dedicated precious metals equity funds was divided 94% active (mainly mutual funds) versus 6% passive (ETFs). CIBC estimates the split is now 33% active and 67% passive. AUM of the 17 active gold equity funds in the US listed on Bloomberg totals US$10.5 billion, while VanEck’s gold equity ETFs alone have AUM of US$12.3 billion, including GDX with US$8.3 billion. Passive funds are not able to participate in secondary offerings or initial public offerings (IPOs). This reduced pool of active funds means the industry has fewer options when it comes to raising capital. We believe companies have no choice but to become more fiscally disciplined to generate funding internally.
We will soon see if the gold price again shows positive moves following the July 4th holiday week. We continue to believe gold may take another run at the US$1,365 per ounce level that has served as the price ceiling since 2014. A successful test of this level is probably needed to bring investor interest back to gold stocks.
IMPORTANT DISCLOSURE
Issued by VanEck Investments Limited ABN 22 146 596 116 AFSL 416755 ('VanEck'). VanEck is a wholly owned subsidiary of Van Eck Associates Corporation based in New York, United States. VanEck Vectors ETF Trust ARBN 604 339 808 (the 'Trust') is the issuer of shares in the VanEck Vectors Gold Miners ETF ('US Fund'). The Trust and the US Fund are regulated by US laws which differ from Australian laws. Trading in the US Fund's shares on ASX will be settled by CHESS Depositary Interests ('CDIs') which are also issued by the Trust. The Trust is organised in the State of Delaware, US. Liability of investors is limited. VanEck Associates serves as the investment adviser to the US Fund. VanEck, on behalf of the Trust, is the authorised intermediary for the offering of CDIs over the US Fund's shares and issuer in respect of the CDIs and corresponding Fund's shares traded on ASX.
This is general information only and not financial advice. It does not take into account any person's individual objectives, financial situation or needs. Investing in international markets has specific risks that are in addition to the typical risks associated with investing in the Australian market. These include currency/foreign exchange fluctuations, ASX trading time differences and changes in foreign regulatory and tax regulations. Before making an investment decision in relation to the US Fund you should read the PDS and with the assistance of a financial adviser consider if it is appropriate for your circumstances. The PDS is available at www.vaneck.com.au or by calling 1300 68 38 37.
Past performance is not a reliable indicator of future performance. No member of the VanEck group of companies or the Trust gives any guarantee or assurance as to the repayment of capital, the payment of income, the performance or any particular rate of return from the US Fund.
An investment in the US Fund may be subject to risks that include, among others, competitive pressures, dependency on the price of gold and silver bullion that may fluctuate substantially over short periods of time, periods of outperformance and underperformance of traditional investments such as bonds and stocks, and natural disasters, all of which may adversely affect the US Fund. Foreign investments are subject to risks, which include changes in economic and political conditions, foreign currency fluctuations, changes in foreign regulations, and changes in currency exchange rates that may negatively impact the US Fund's return. Small- and medium- capitalisation companies may be subject to elevated risks. The US Fund's assets may be concentrated in a particular sector and may be subject to more risk than investments in a diverse group of sectors.
NYSE Arca Gold Miners Index is a trademark of ICE Data Indices, LLC or its affiliates ("ICE Data") and has been licensed for use by VanEck in connection with the US Fund. Neither the Trust nor the Fund is sponsored, endorsed, sold or promoted by ICE Data. ICE Data makes no representations or warranties regarding the Trust or the Fund or the ability of the NYSE Arca Gold Miners Index to track general stock market performance.
ICE DATA MAKES NO EXPRESS OR IMPLIED WARRANTIES, AND HEREBY EXPRESSLY DISCLAIMS ALL WARRANTIES OF MERCHANTABILITY OR FITNESS FOR A PARTICULAR PURPOSE WITH RESPECT TO THE NYSE ARCA GOLD MINERS INDEX OR ANY DATA INCLUDED THEREIN. IN NO EVENT SHALL ICE DATA HAVE ANY LIABILITY FOR ANY SPECIAL, PUNITIVE, INDIRECT, OR CONSEQUENTIAL DAMAGES (INCLUDING LOST PROFITS), EVEN IF NOTIFIED OF THE POSSIBILITY OF SUCH DAMAGES.
Related Insights


Published: 09 August 2018