Miners’ margins grow as gold soars to fresh highs
Gold reached new highs in July due to concerns over escalating global geopolitical risks, a shift towards safer and more defensive assets and speculation about an imminent Fed rate cut.
Another month, another high
Gold’s rally this year has been impressive. Gold reached intra-day highs of US$2,431 in April; US$2,450 in May and US$2,483 per ounce in July.
Chart 1: Gold has averaged around US$2,358 per ounce since its April peak
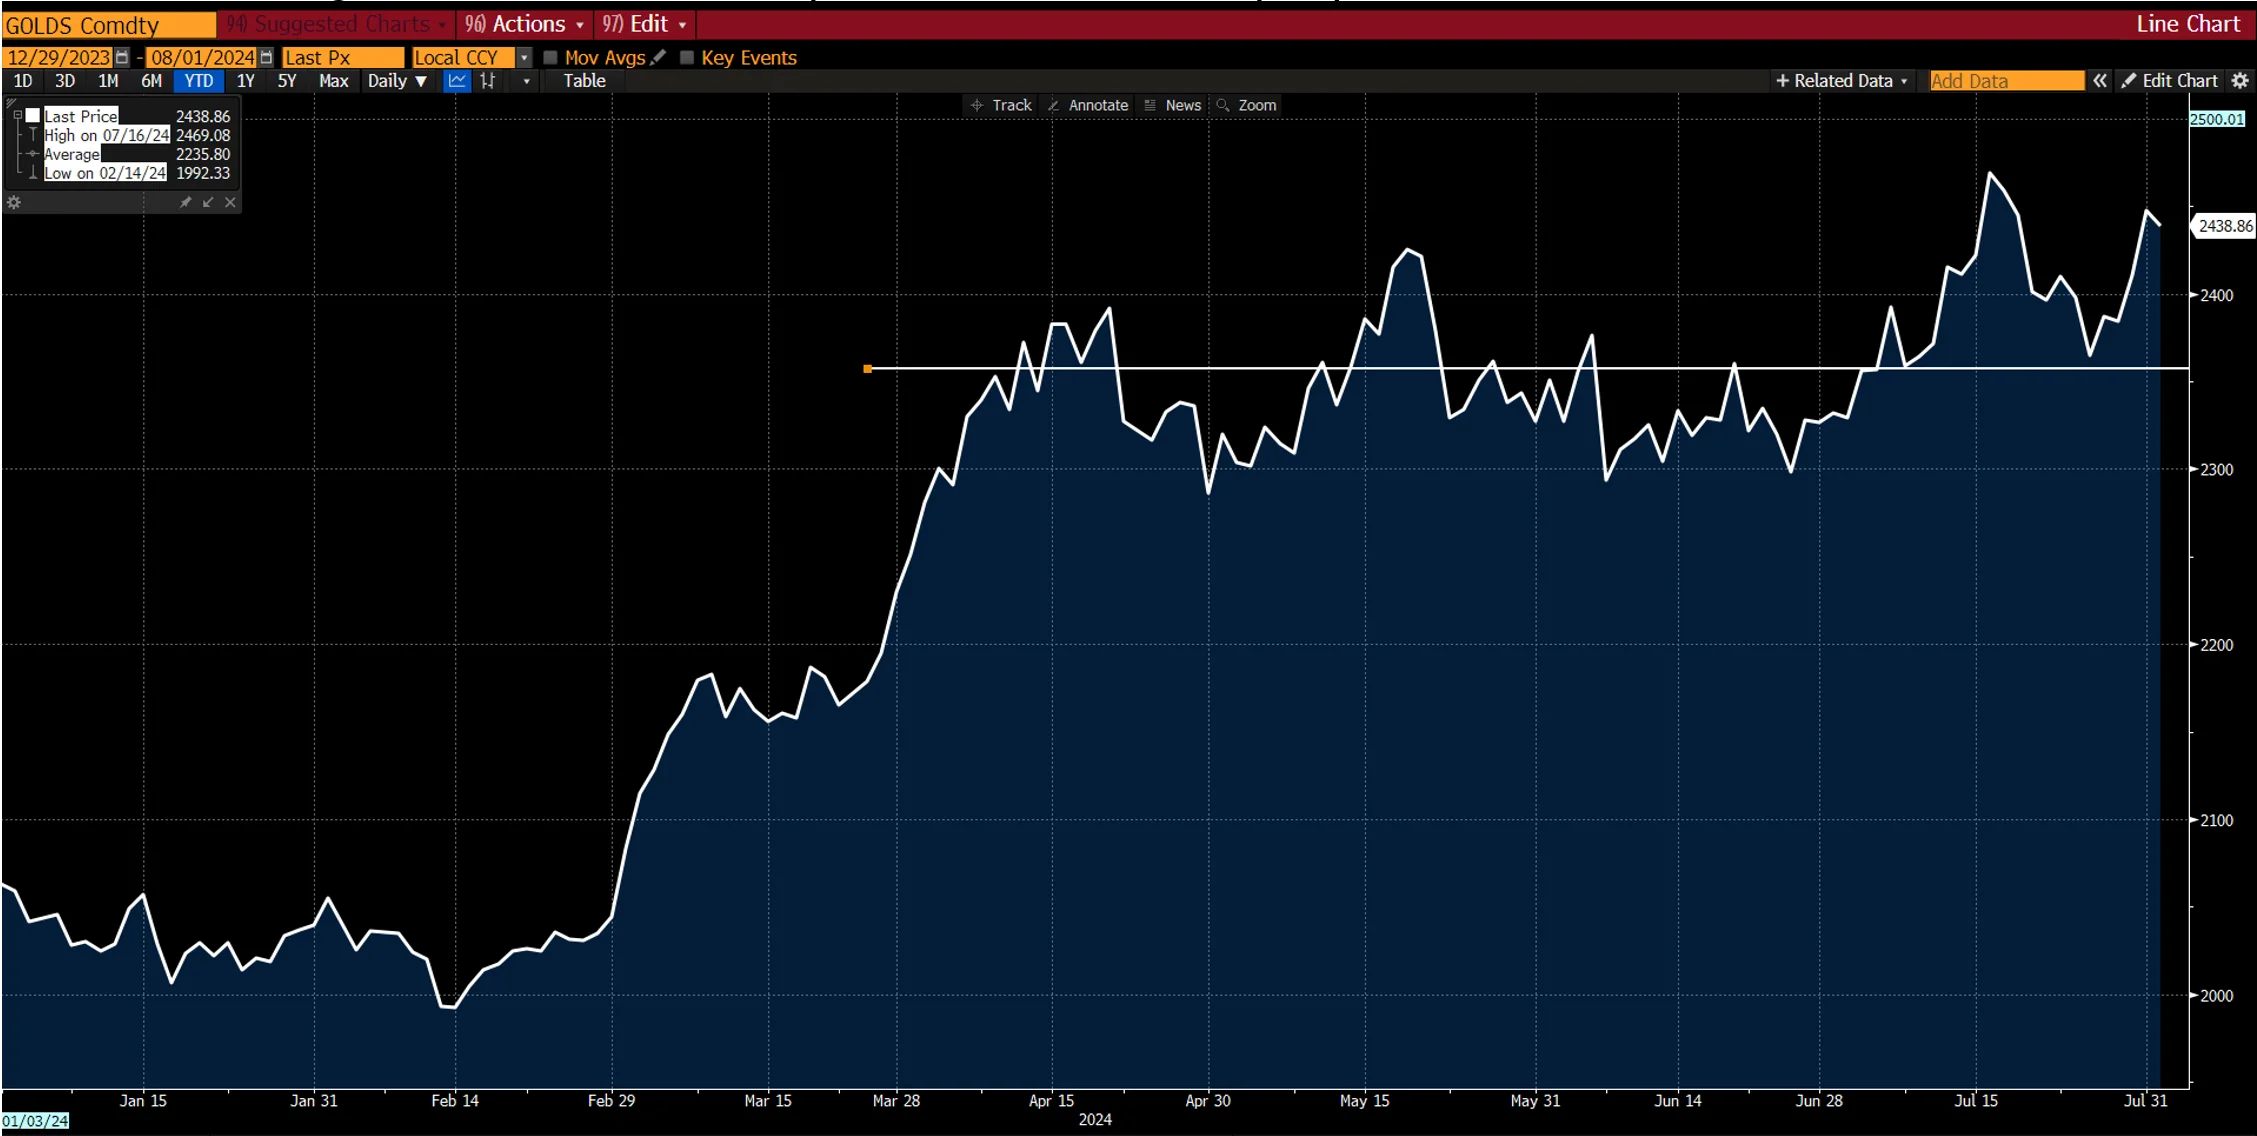
Source: Bloomberg. Data as of July 31, 2024.
Key drivers: heightened geopolitical risk and market rotation
In July, the price of gold continued to be supported by heightened global geopolitical risk as the US elections took an unexpected turn, and tensions worsened in the Middle East. Gold's strength in July coincided with a 1.60% decline in the Nasdaq 100 Index, reflecting a broader pullback in equity markets driven by powerful technology stocks. “Rotation” was a hot word in financial markets in July and it is fair to assume that gold would benefit from such a rotation into safer, cheaper, or more defensive assets. Investment demand, as gauged by the holdings of gold bullion backed ETFs, picked up in July, with net inflows resulting in a 1.8% increase in holdings during the month.
Also…rate cuts
Last, but not least, lower-than-expected June US Consumer Price Index readings seem to have convinced markets that the US Federal Reserve (Fed) will soon cut rates, supporting gold. At the end of July, three 25 basis point cuts were priced in for 2024, compared to two at the end of June. Lower real interest rates have historically been positive for gold. The performance of gold in the year or so following the start of the last three rate cutting cycles supports this view. Gold closed on 31 July at US$2,447.60 per ounce, up US$120.85 or 5.19% during the month.
Chart 2: Historically, gold has performed well following the Fed’s first rate cuts
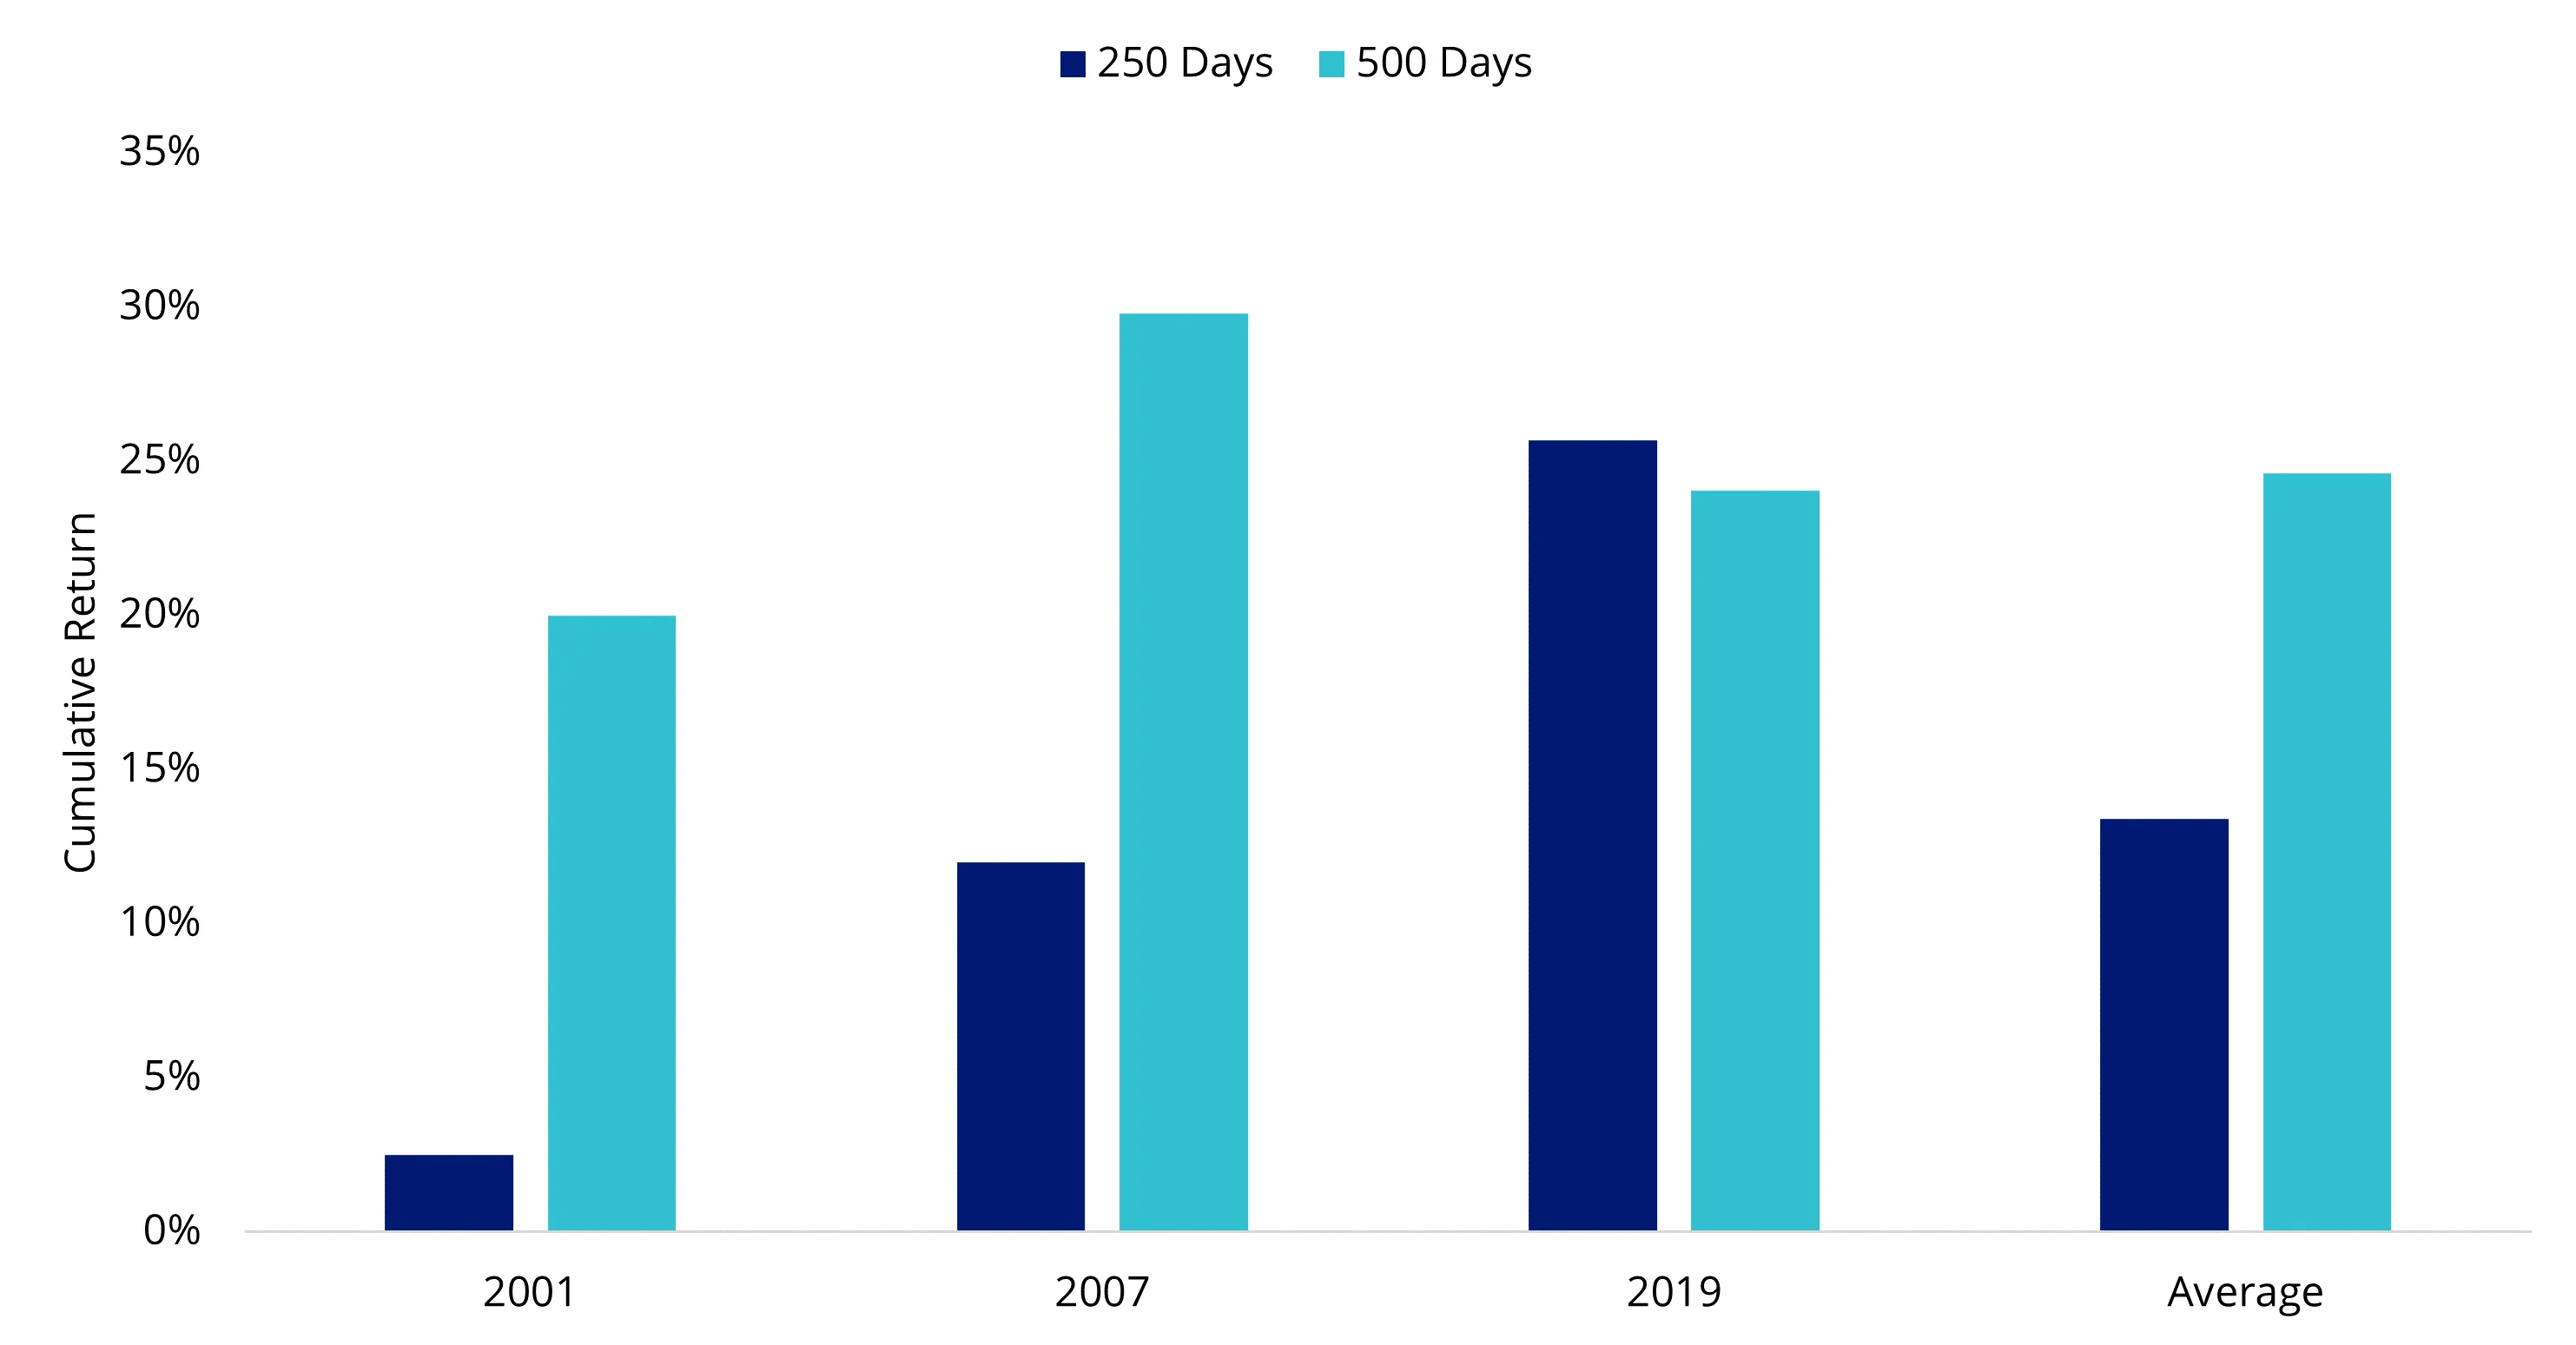
Source: JPMorgan, VanEck. Data as of July 31, 2024.
Miners are starting to shine
Gold stocks showed their gold price leverage in July. The NYSE Arca Gold Miners Index returned 13.38% outperforming bullion. For the gold miners, these record gold prices mean record margins. With costs contained, their free cash flow generation expanded significantly in Q2.
Table 1: Healthy margins for miners these days—despite higher costs
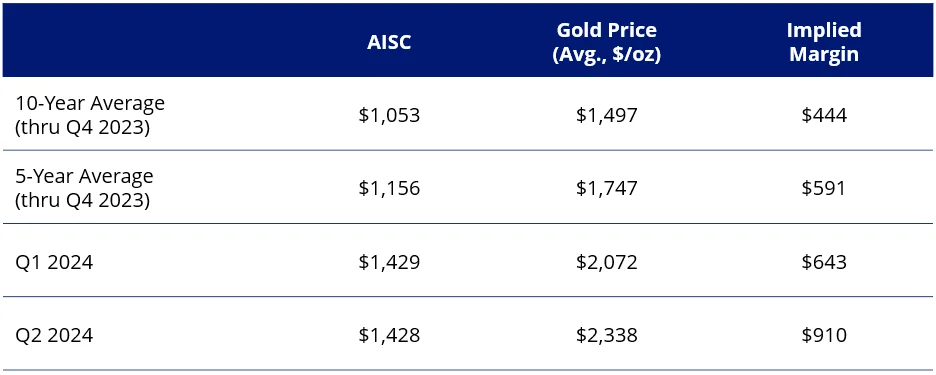
Source: Scotiabank, VanEck. Data as of June 30, 2024.
Gold companies have been reporting their financial and operating results for Q2 2024. We track a universe of companies during the earnings season to assess how they deliver against expectations, and thus far, the updates appear to be a net positive for the sector with about 80% of results beating or meeting consensus estimates. This is encouraging, and we continue to stress how critical it is that these companies consistently meet their targets. Achieving this should lead to higher valuations that are supported, not only by high free cash flow yields during periods of record gold prices, but also by the markets’ conviction that these companies are solid, sustainable and profitable businesses, able to offer positive returns throughout the commodity cycles.
Demand could still be a major catalyst
So far this year, gold and gold stocks have been among the top performing assets. While the gold price has reached new highs, gold stocks remain well below their historic peaks. Even a slight increase in global capital allocations to gold and gold mining stocks could have a material impact on the price of gold and gold equities, given that the sector represents a small percentage (approximately 1%1) of global financial assets. Similarly, despite the robust purchasing of gold in recent years, the central banks of emerging economies remain relatively underinvested in gold, with indications that they are looking to increase the percentage of total reserves held in gold. If both investors and central banks’ sentiment towards gold and gold equities continues to improve, the additional demand could significantly impact the gold price and the valuations of gold stocks.
Chart 3: China/EM central banks have been big buyers…but could be bigger…
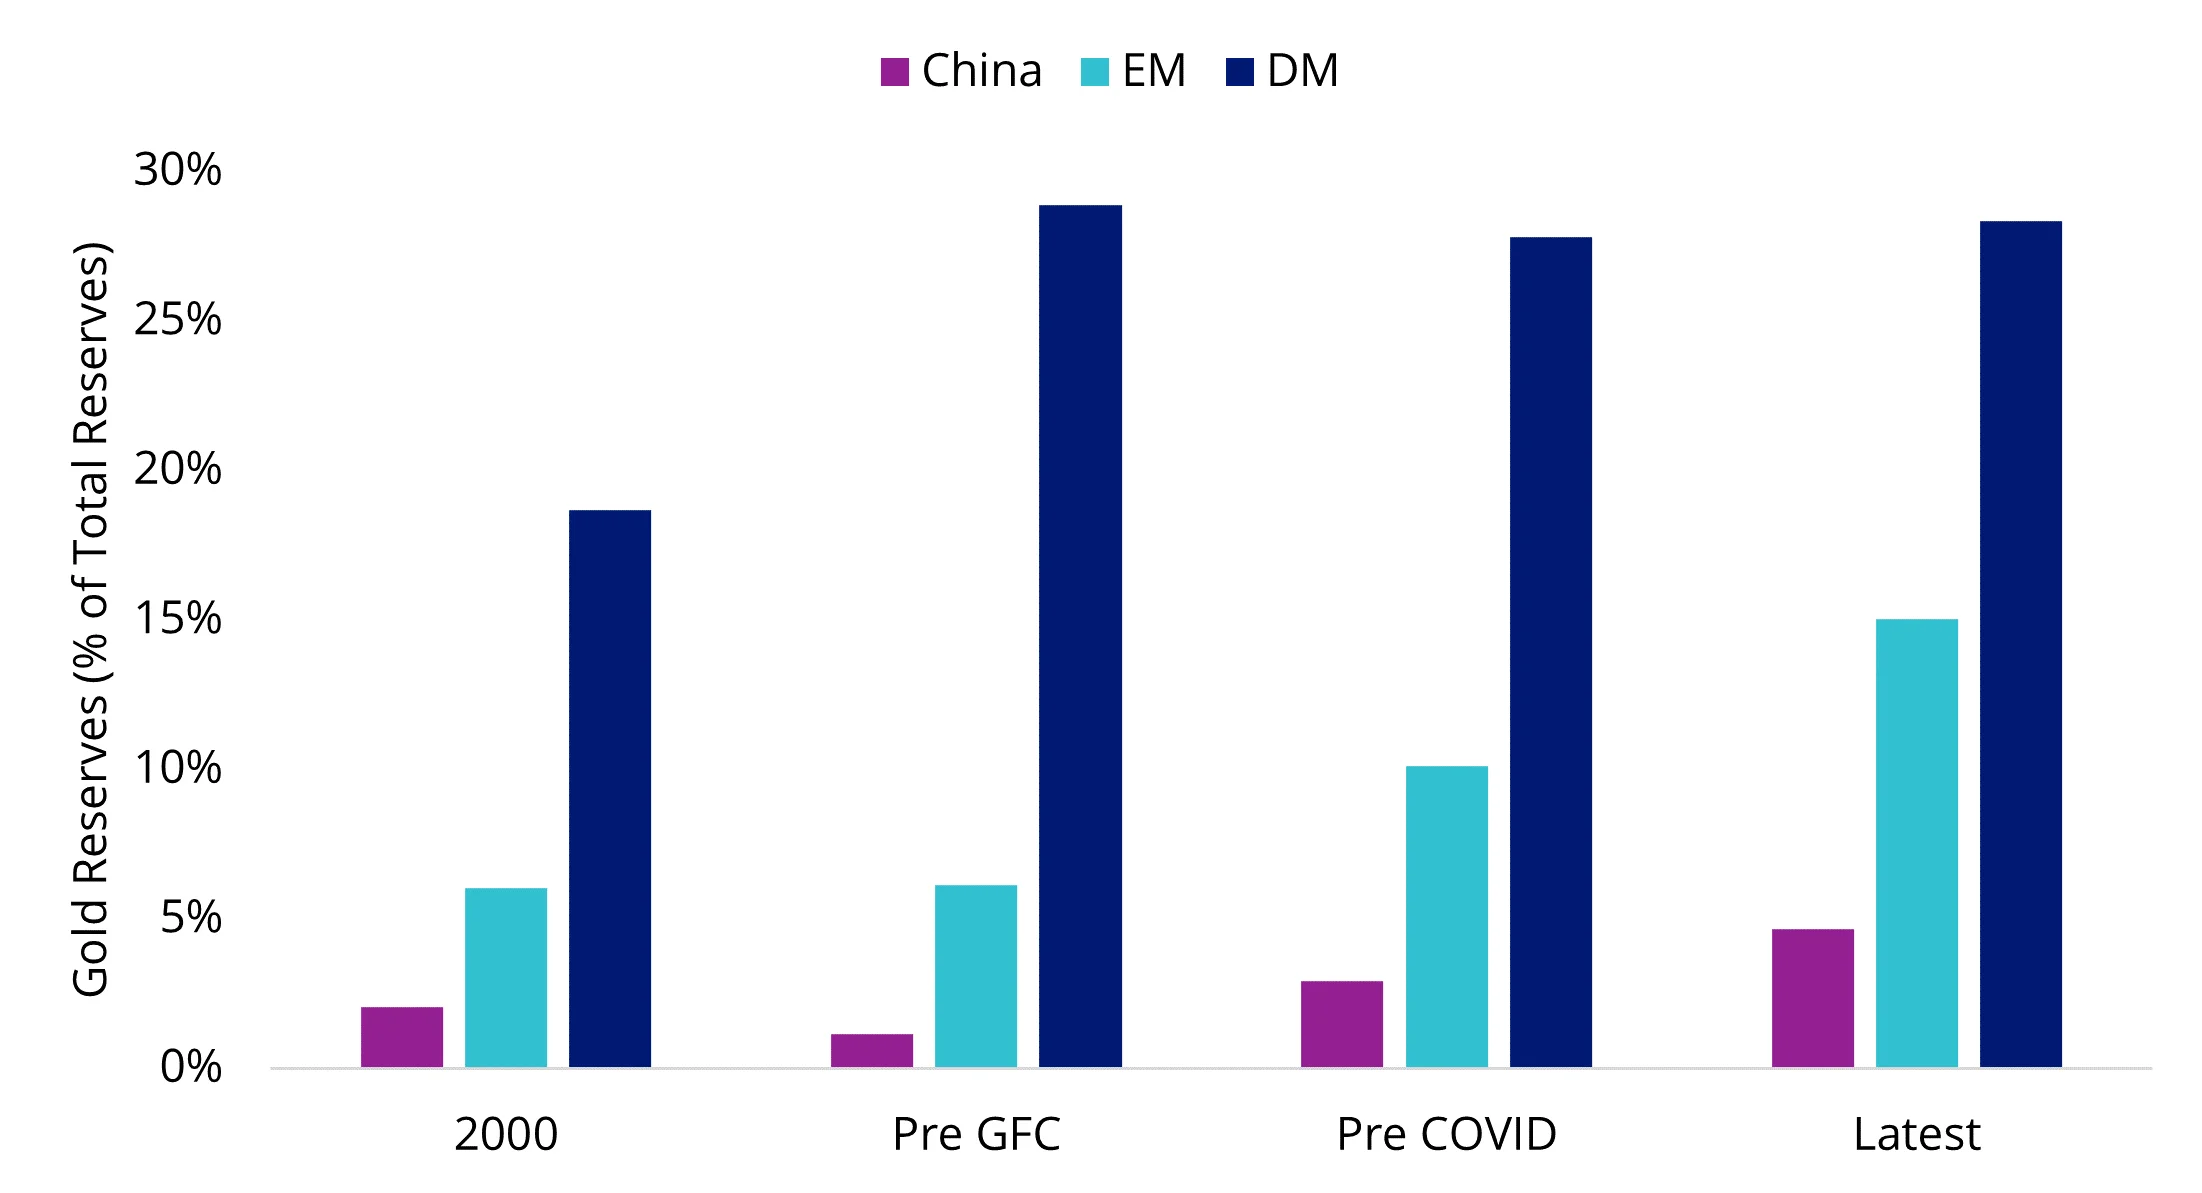
Source: Goldman Sachs, World Gold Council. Data as of June 30, 2024.
Source:
1https://www.gold.org/goldhub/research/market-primer/gold-market-primer-market-size-and-structure
Related Insights


Published: 13 August 2024
Any views expressed are opinions of the author at the time of writing and is not a recommendation to act.
VanEck Investments Limited (ACN 146 596 116 AFSL 416755) (‘VanEck’) is the issuer and responsible entity of all VanEck exchange trades funds (Funds) listed on the ASX. This is general advice only and does not take into account any person’s financial objectives, situation or needs. The product disclosure statement (PDS) and the target market determination (TMD) for all Funds are available at vaneck.com.au. You should consider whether or not an investment in any Fund is appropriate for you. Investments in a Fund involve risks associated with financial markets. These risks vary depending on a Fund’s investment objective. Refer to the applicable PDS and TMD for more details on risks. Investment returns and capital are not guaranteed.