A-REIT success beyond all Good, man
The Goodman Group’s meteoric rise throughout 2024 underscored its impressive assets and strong financial position. As its data centre and logistics portfolios thrived during and after COVID, other Australian real estate investment trusts (A-REITs) in the office and retail subsectors lagged.
However, the status quo changed significantly in February, as demonstrated by the S&P/ASX 200 A-REIT Index (“the index”). Goodman’s share price took a hit after its post-earnings trading halt was lifted. After raising $4 billion at a 6.9% discount to the previous closing price, its share price subsequently fell 6.6%.
As Goodman represents over 40% of the S&P/ASX 200 A-REIT Index (“the index”), its decline dragged the index down by 6.38%.
Strong reporting period
However, the index decline is not indicative of performance in the broader A-REITs sector, which is benefiting from low supply in sub-sectors such as office, retail and residential.
Long-term concerns about the office sector are beginning to fade as more and more companies and government departments discourage working from home.
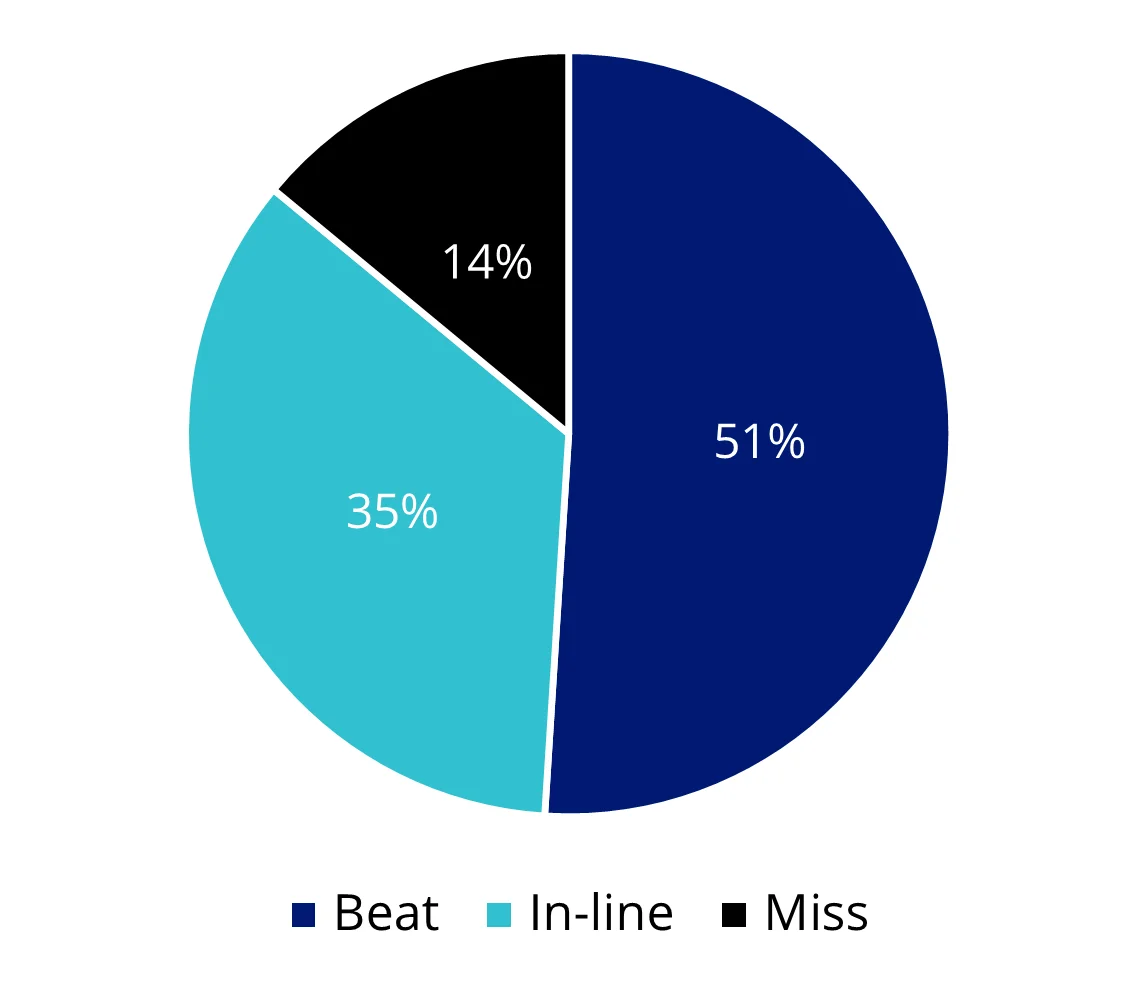
During the most recent February earnings season, more than half of the A-REITs exceeded expectations. Many A-REITs investors may be underexposed to the commercial property sectors that are primed for growth.
Ironically, Goodman’s results were a ‘beat’, but its share price was battered after the capital raise, highlighting the need for diversification beyond one company.
Positioning for the next stage of the cycle
With last week’s subdued GDP numbers indicating the Australian economy had experienced only a mild growth increase, many investors are positioning their portfolios in anticipation of the economy’s direction from here.
Each scenario, we think, warrants consideration of A-REITs: a falling rate environment, to stimulate economic growth, will be beneficial for A-REITs, while if the recovery has already started, a review of past recoveries highlights that A-REITs were among ASX’s shining stars, including significant outperformance in 2011/12, 2014/15, 2018 and 2021.
As always, past performance is by no means a reliable indicator of future performance.
Capped weighting for diversified exposure
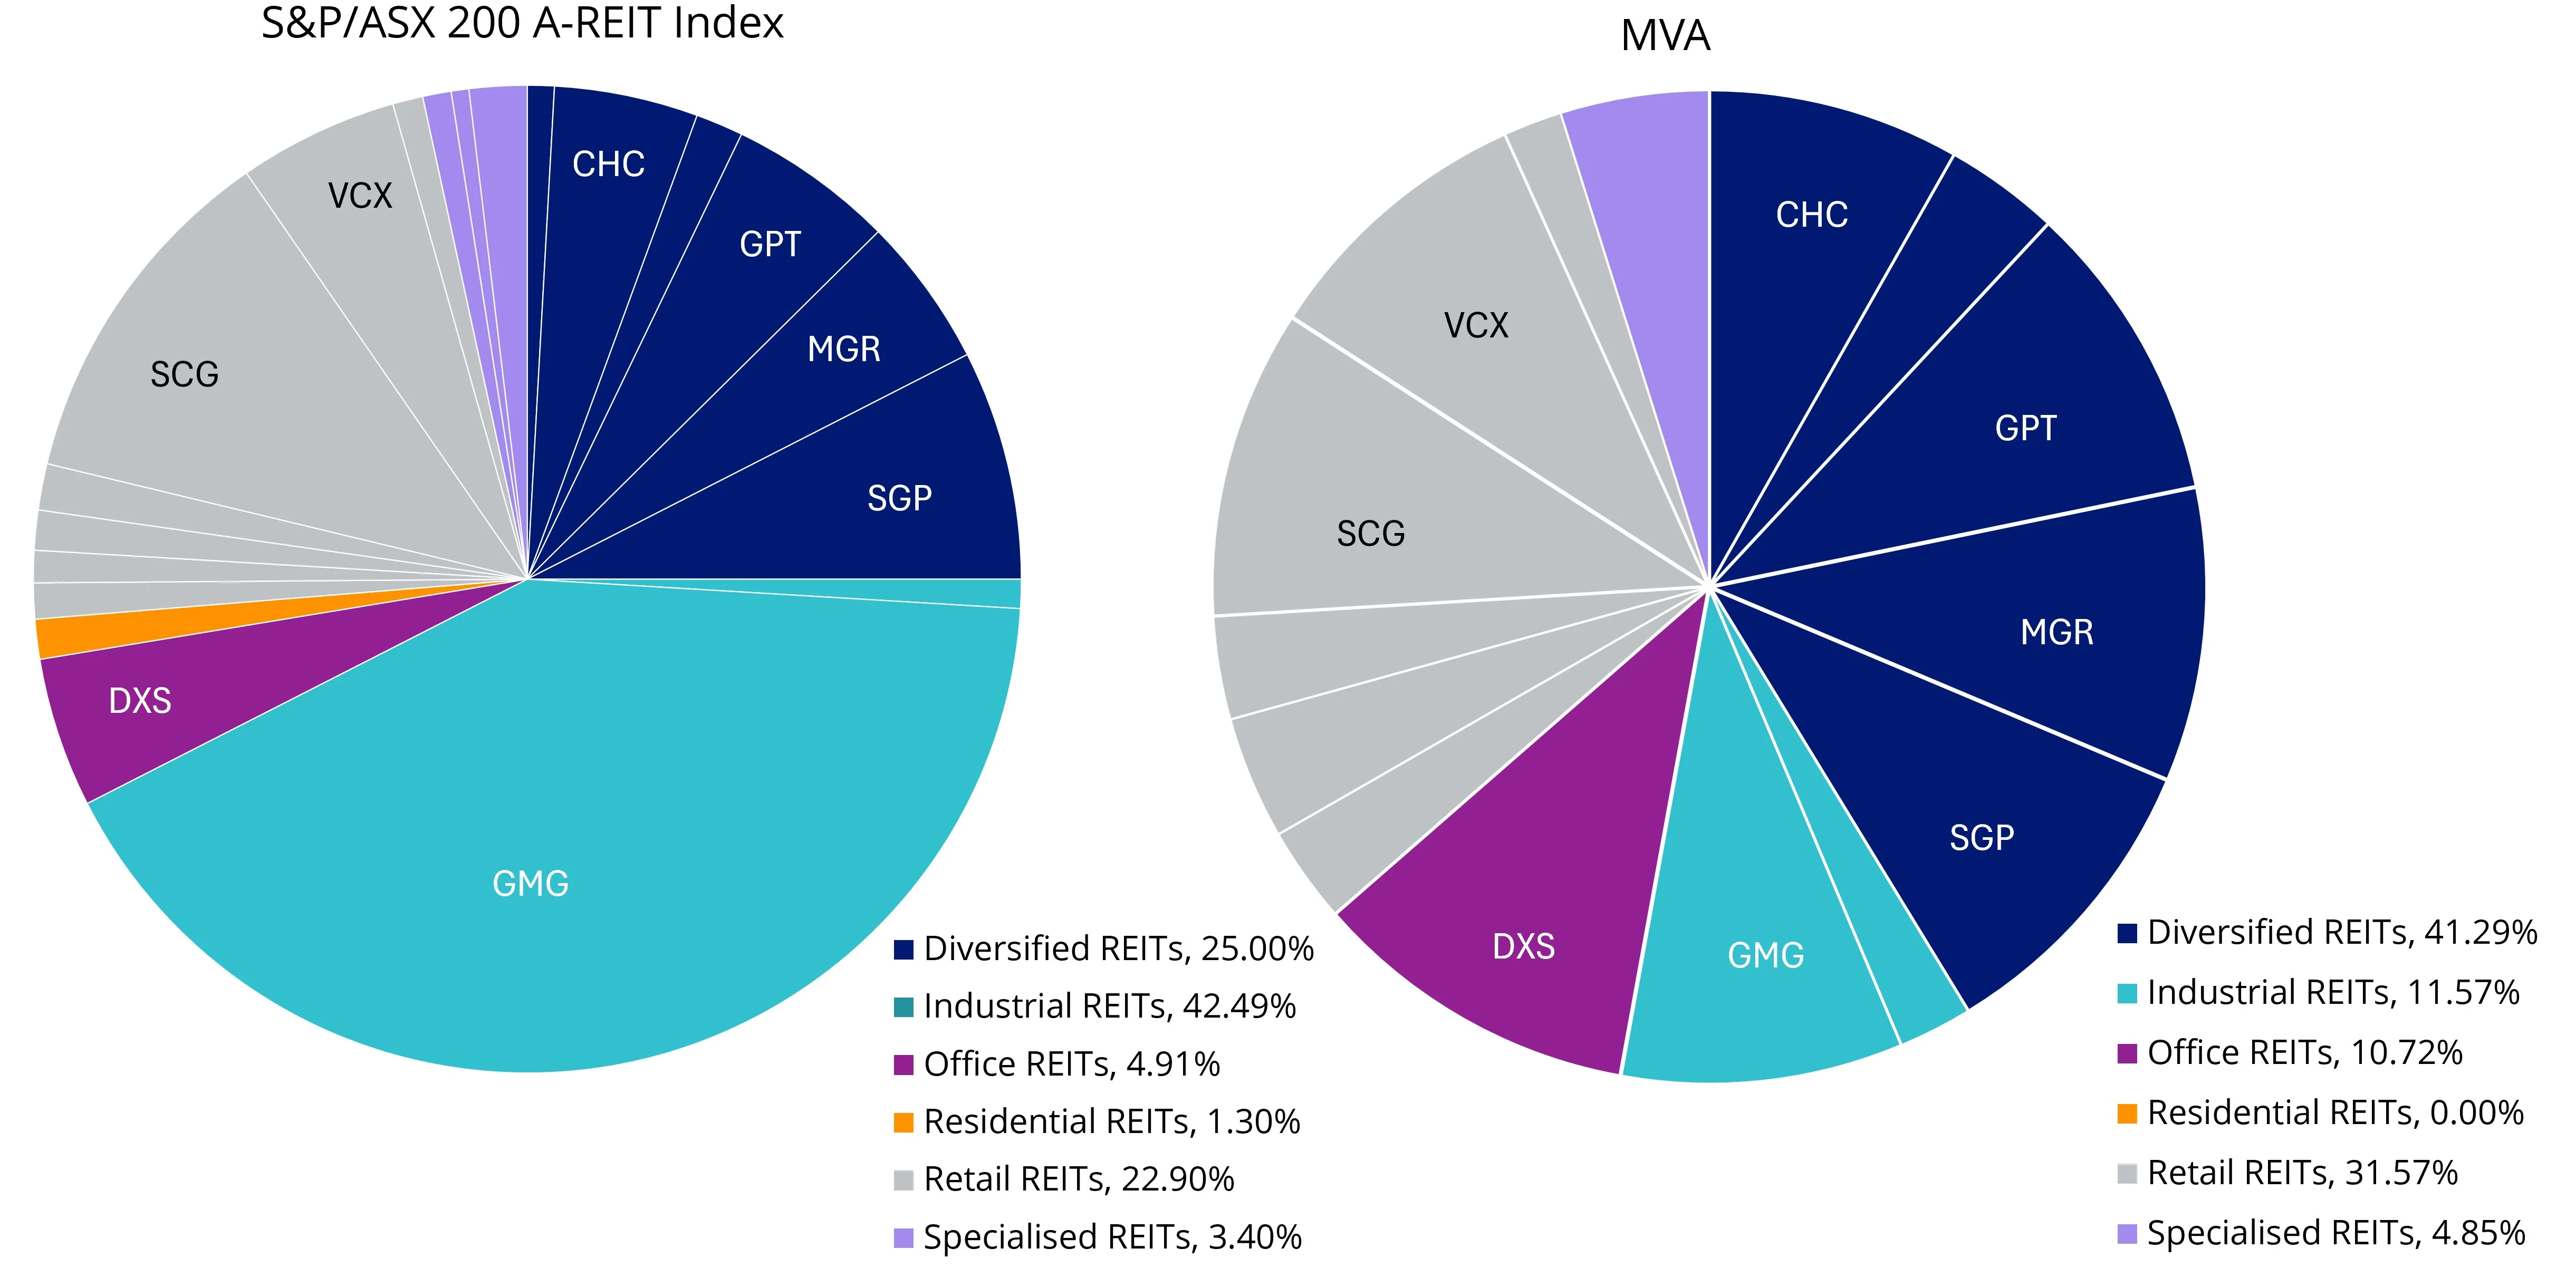
The VanEck Australian Property ETF (MVA) caps constituents at 10%, so that one single REIT or subsector does not dominate. This limit provides a more balanced approach than the index, with greater exposure to the office, retail and diversified subsectors.
Charts 1 & 2: Subsector breakdown

Source: FactSet, 28 February 2025
The benefit of this diversified sector exposure is reflected in MVA’s February returns, which outperformed the index by 5.13%.
Chart 3: MVA beats versus misses from the February 2025 reporting season

Source: VanEck, Bloomberg to 3 March 2025
Attracted to yield
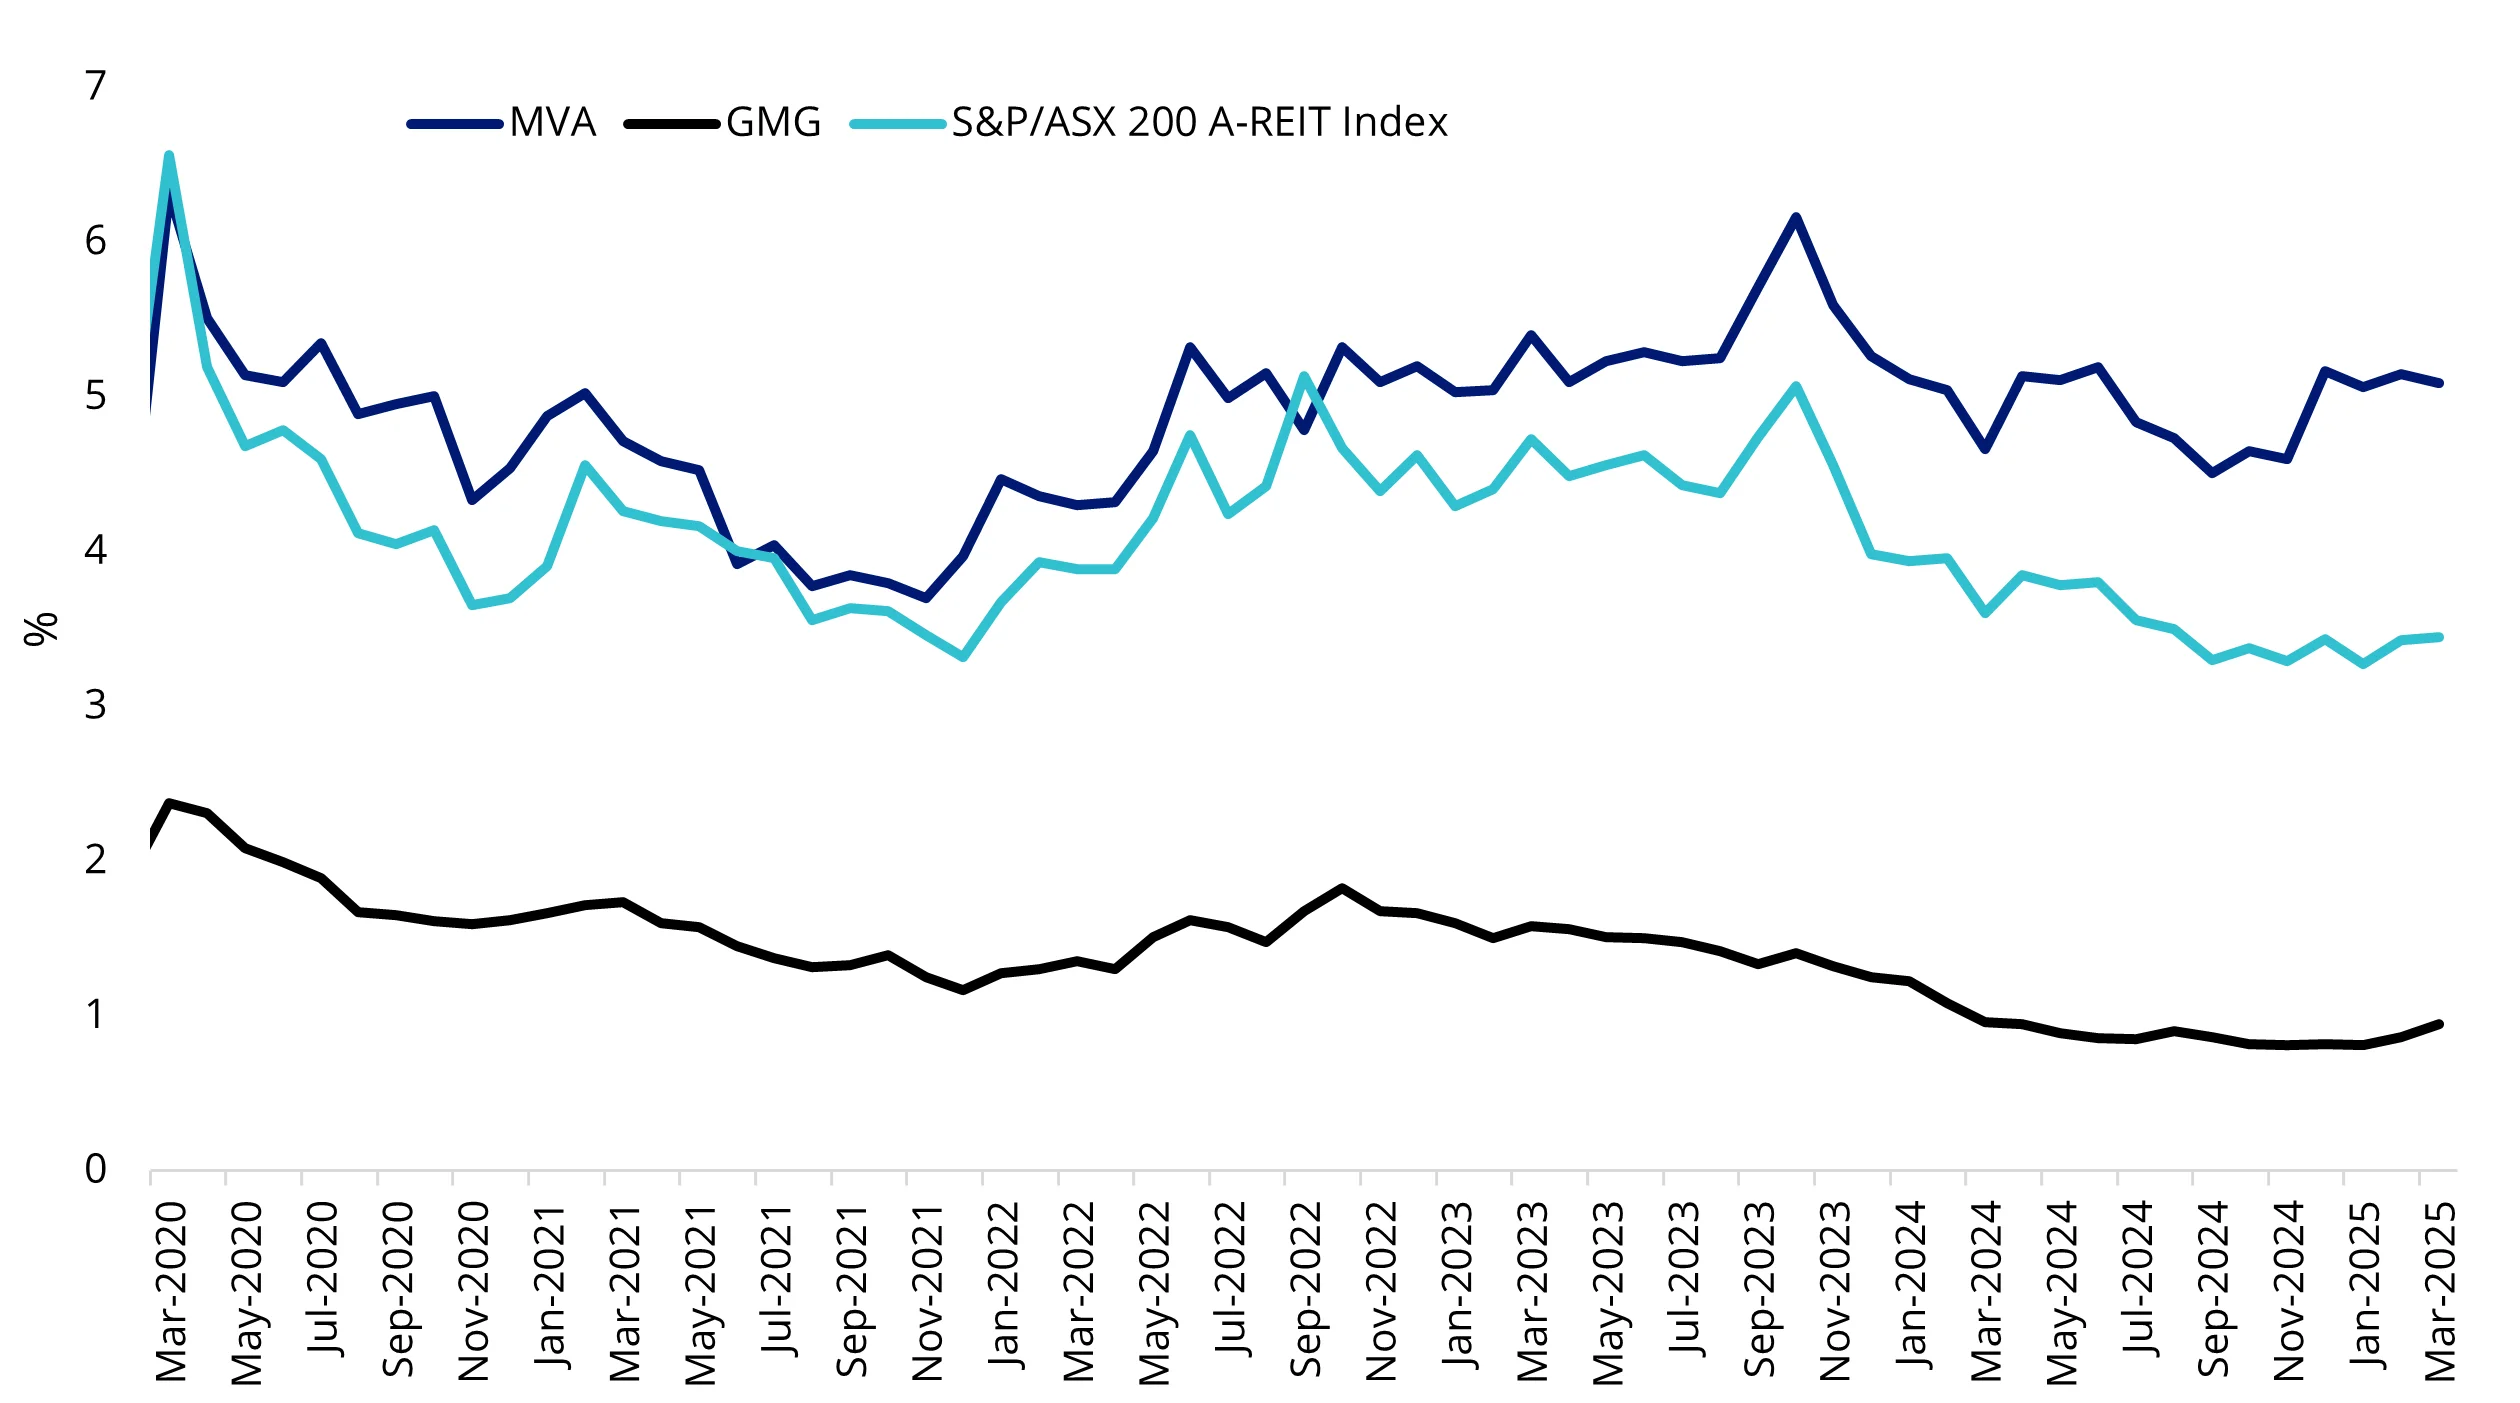
Diversification is not the only consideration for A-REIT investors. In the past, Australian investors have been attracted to A-REITs for the steady income, which is linked to rental income. MVA’s more balanced approach makes sense if you are allocating to A-REITs for the yield, as Goodman has among the lowest dividend yields in the sector and, as a result, has dragged the index’s income performance down.
Chart 4: Dividend yield

Source: Bloomberg, 4 March 2025. For MVA and S&P/ASX 200 A-REIT Index, the dividend yield is the weighted average of each portfolio security’s distributed income during the prior twelve months. You cannot invest in an index. Past performance is not a reliable indicator of future performance.
Table 1: Calendar year index performance from GFC to 2025 (%)

* YTD is to 28 February 2025
Source: Morningstar Direct. Past performance is not a reliable indicator of future performance. Results are calculated to the last business day of the month and assume immediate reinvestment of all dividends and excludes fees and costs associated with investing in an ETF. You cannot invest directly in an index. ETF performance is different to index performance. The S&P/ASX 200 Index is shown for broad market comparison purposes as it is the widely recognised benchmark used to measure the performance of the broad Australian equities market. It includes the 200 largest ASX-listed companies, weighted by market capitalisation. MVA’s index measures the performance of the largest and most liquid ASX-listed A-REITs, with a maximum weight of 10% in each security at rebalance. MVA is only exposed to one sector of the S&P/ASX 200 Index. ‘Click here for more details’.
What Table 1 highlights, too, is the difficulty of timing the market. Outperformance this year underscores new opportunities in the A-REITs sector, with performance driven by new tailwinds that benefit a broader mix of A-REITs. This shift isn’t captured by the benchmark index, which is overweight Goodman Group, highlighting the importance of diversification.
Key risks
An investment in our Australian Property ETF carries risks associated with: financial markets generally, individual company management, industry sectors, stock and sector concentration, fund operations and tracking an index. See the VanEck Australian Property ETF PDS and TMD for more details.
Published: 12 March 2025
Any views expressed are opinions of the author at the time of writing and is not a recommendation to act.
VanEck Investments Limited (ACN 146 596 116 AFSL 416755) (VanEck) is the issuer and responsible entity of all VanEck exchange traded funds (Funds) trading on the ASX. This information is general in nature and not personal advice, it does not take into account any person’s financial objectives, situation or needs. The product disclosure statement (PDS) and the target market determination (TMD) for all Funds are available at vaneck.com.au. You should consider whether or not any Fund is appropriate for you. Investments in a Fund involve risks associated with financial markets. These risks vary depending on a Fund’s investment objective. Refer to the applicable PDS and TMD for more details on risks. Investment returns and capital are not guaranteed.
MVIS Australia A-REITs Index (‘MVIS Index’) is the exclusive property of MV Index Solutions GmbH based in Frankfurt, Germany (‘MVIS’). MVIS is a related entity of VanEck. MVIS makes no representation regarding the advisability of investing in the Fund. MVIS has contracted with Solactive AG to maintain and calculate the MVIS Index. Solactive uses its best efforts to ensure that the MVIS Index is calculated correctly. Irrespective of its obligations towards MVIS, Solactive has no obligation to point out errors in the MVIS Index to third parties.


