Australian REITs could be back in business
The next phase of the cycle may create opportunities in ASX REITs, though not uniformly across sub-sectors. Discover our top picks, insights on Goodman Group, and key considerations for investors.
Equities have had a great run over the last 12 months, with double-digit growth in the S&P500 and the S&P/ASX 200 performing better than expected.
However, the cyclical nature of investing means asset classes that that are outperforming now may perform differently down the line. As we approach the next stage of the economic cycle, many investors are considering the alignment of their portfolios.
Australian Real Estate Investment Trusts (A-REITs) are an asset class worth considering. With central banks either beginning or nearing the point of reducing interest rates — and with the market fully anticipating a Federal Reserve rate cut by September — history suggests that REITs tend to benefit from such conditions as their borrowing costs decrease.
As always, however, it’s important to be selective, especially in light of present valuations.
Office and retail REITs are top picks
We think real estate investment trusts (REITs) in the office and retail sub-sectors are best positioned to reap the spoils.
Australian businesses are increasingly winding back the flexible working arrangements introduced during the pandemic, coupled with strong migration numbers has seen office occupancy rates stabilise.
Retail occupancy is also strong, with early signs of a potential reacceleration in retail sales. This has prompted net operating income to accelerate for retail REITs and rebound for office REITs.
Both office and retail REITs are currently being offered at attractive discounts to net tangible assets, making them stand out as a great value play for savvy investors.
Chart 1: Occupancy rates across office and retail REITs

Chart 2: Price to Net Tangible Assets (NTA) below historical average
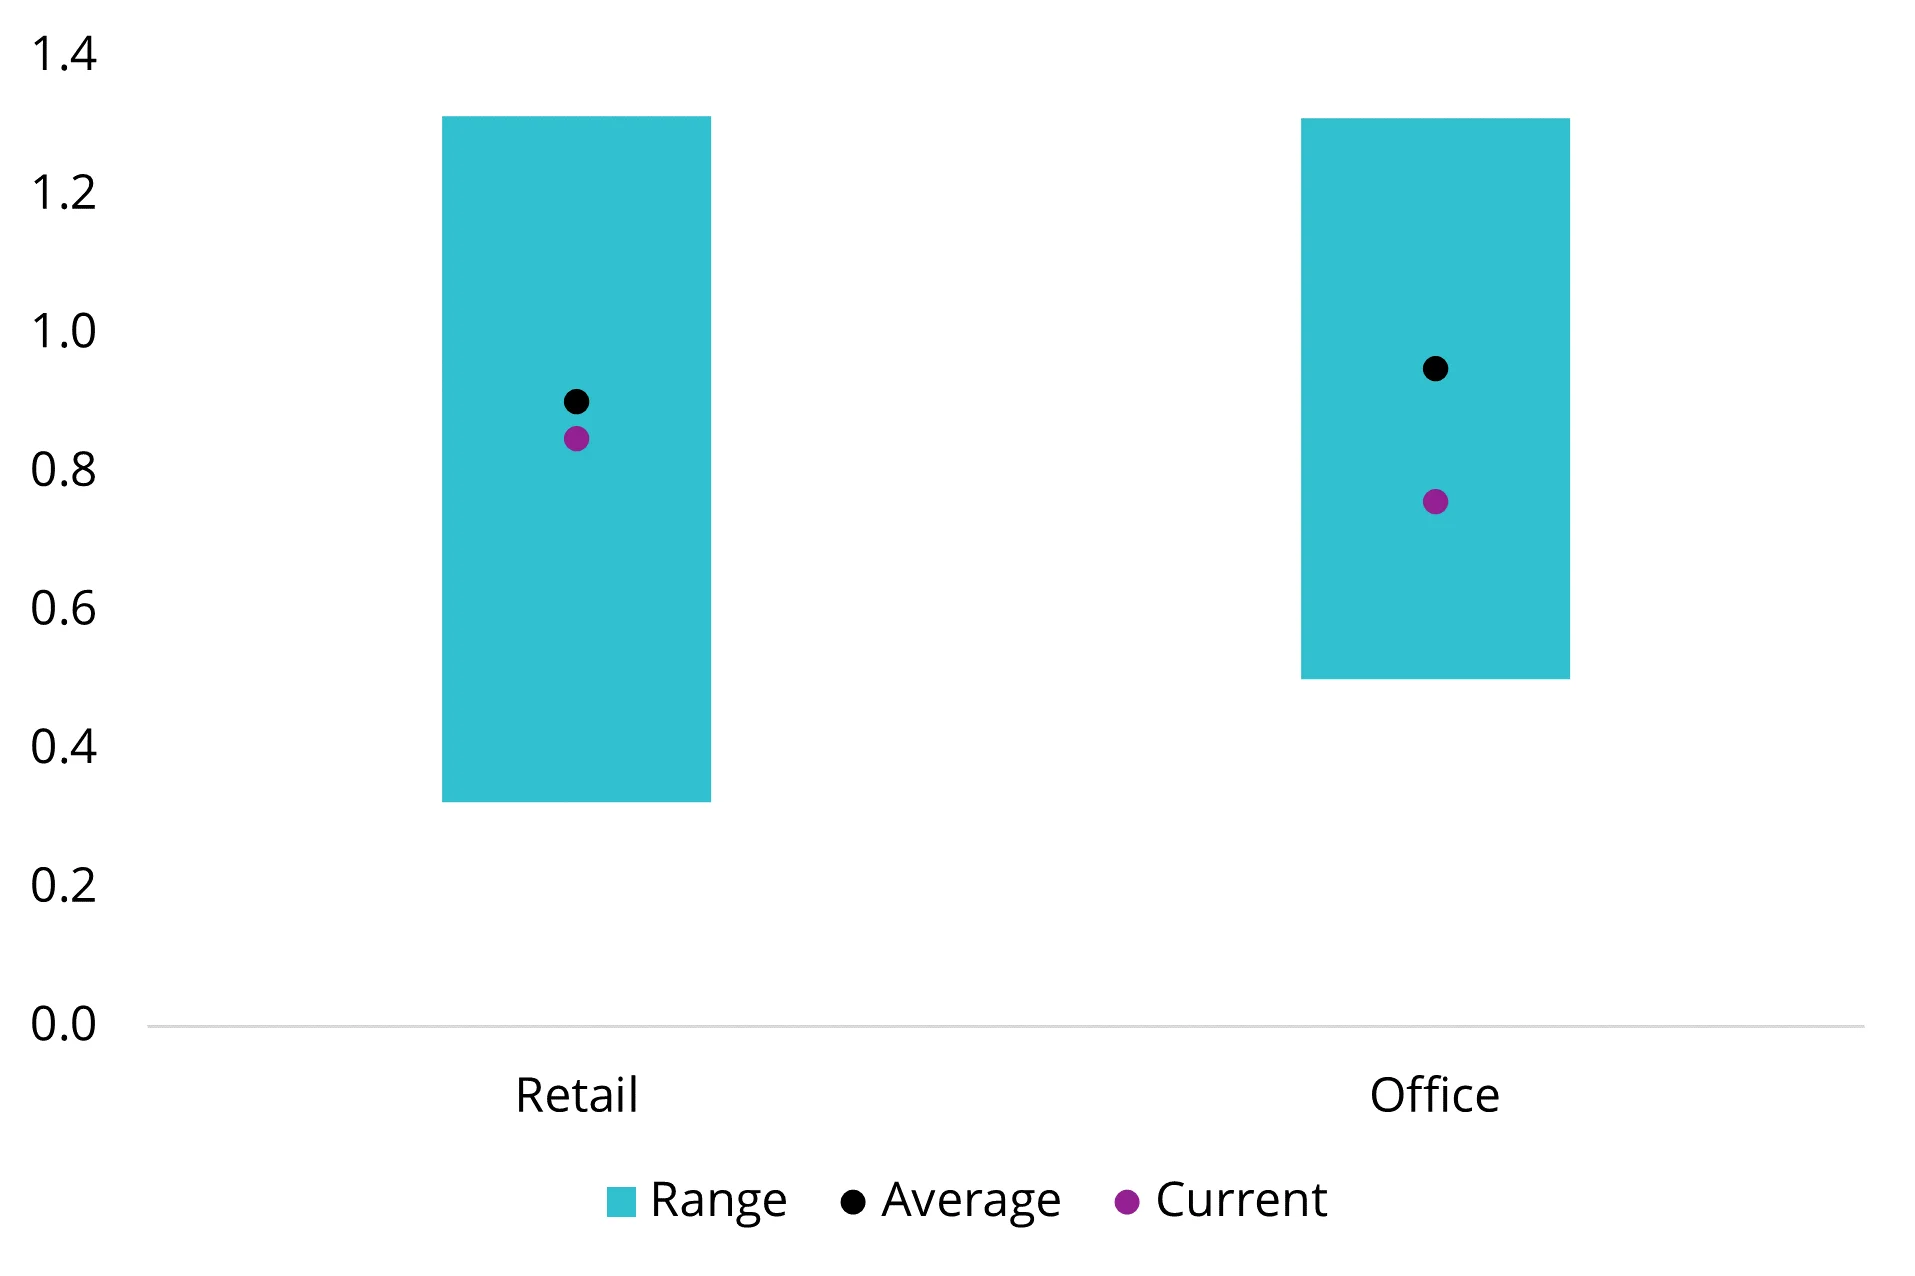
Chart 3: Net operating income YoY
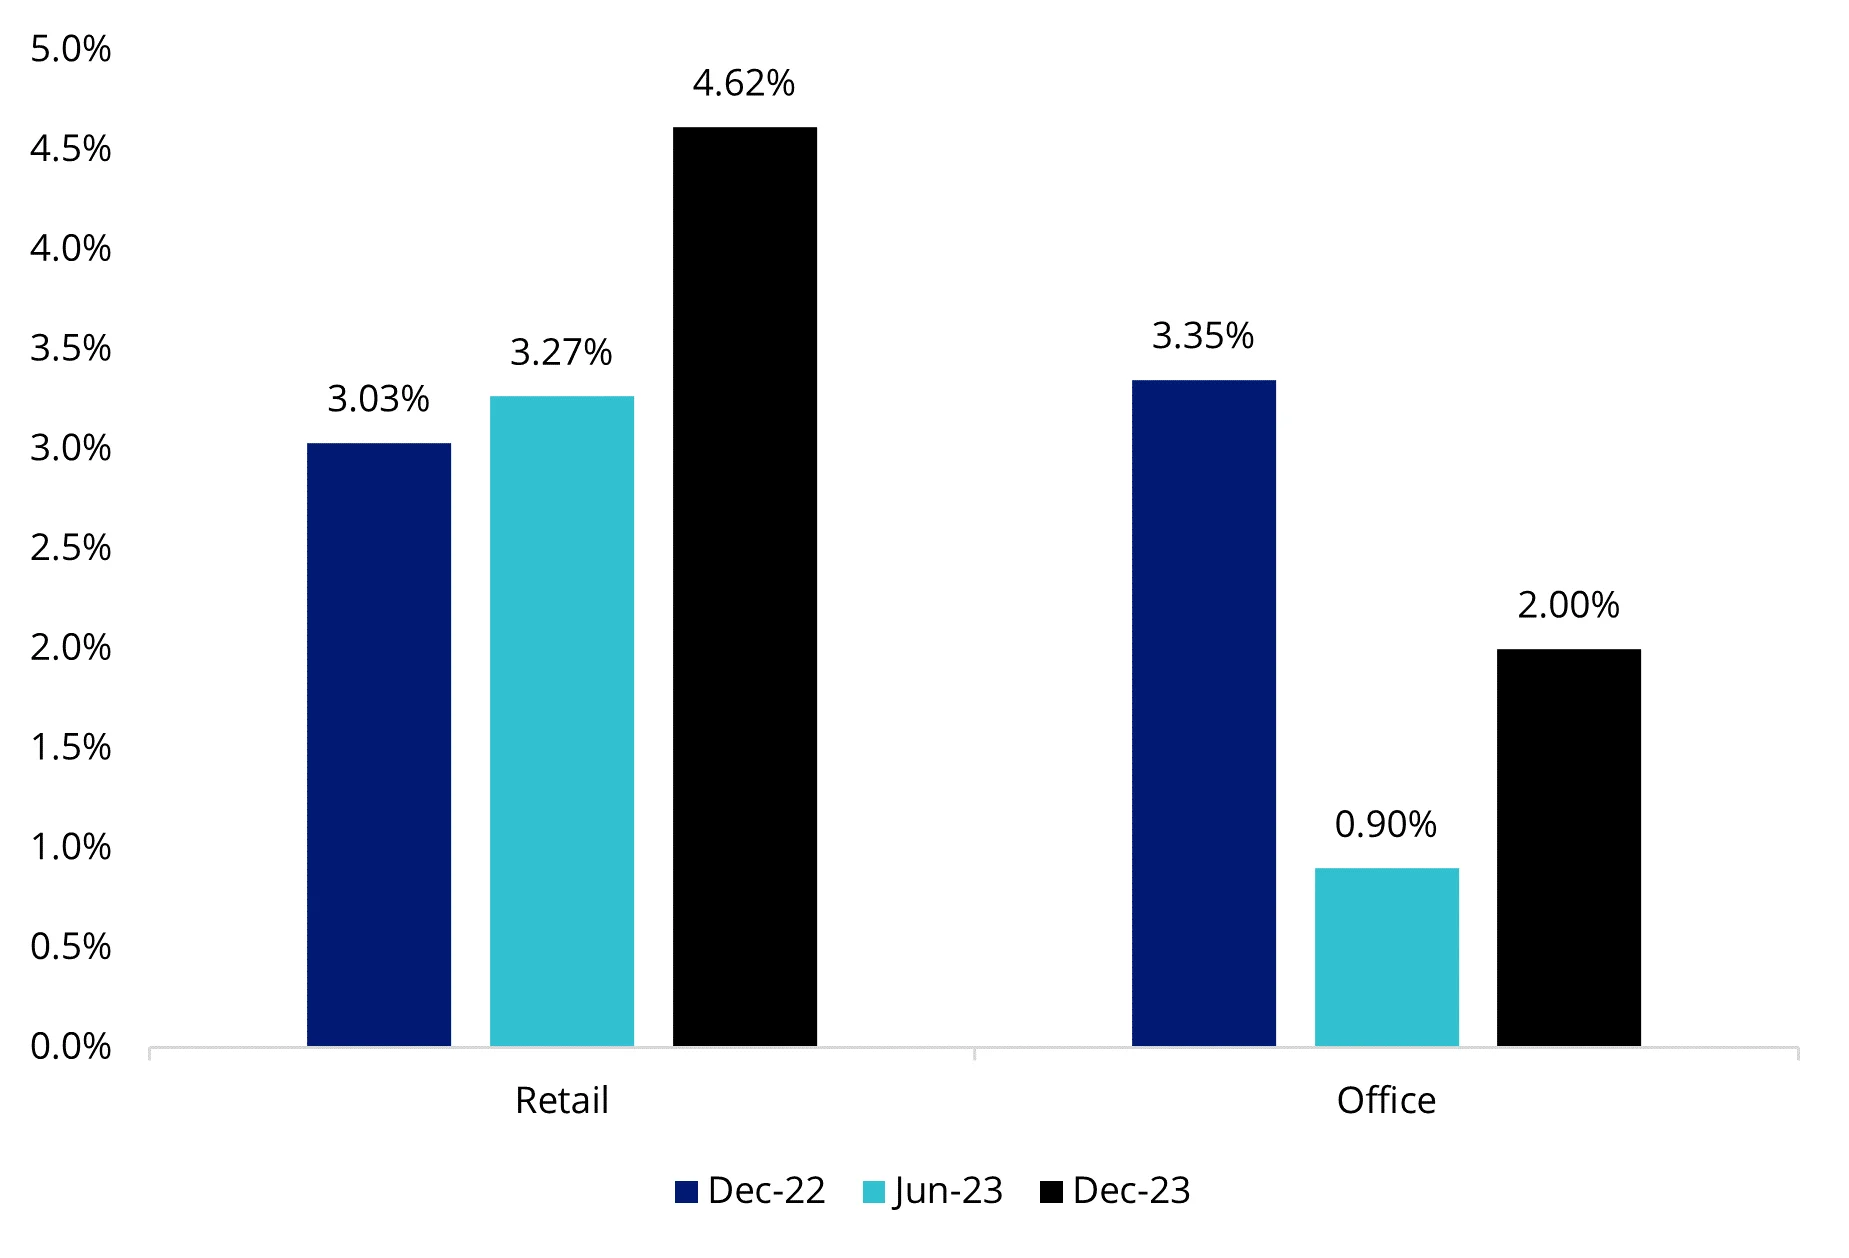
Source for chart 1,2 and 3: Office as equal weighting of DXS, GPT, SGP, MGR, ABP and GOZ. Retail as equal weighting of VCX, GPT, SCG, SGP, MGR, CQR, SCP, HDN. 1 January 2009 to 31 March 2024. Note: data not supplied for retail occupancy December 2022.
Industrial REITs could be vulnerable to a pull-back
Goodman Group (GMG), the largest industrial REIT on the ASX, is one of the few REITs that bucked the downturn. Over the last 12 months, its share price has gone up by more than 70% on the back of promising developments in the expansion of its data centre warehouse pipeline.
However, strong sentiment has resulted in the price to 12 month forward earnings ratio reaching the upper bound of its historical average, which could make it vulnerable to a correction if high earnings growth isn’t sustained.
Chart 4: Goodman Group’s earnings per share (EPS) growth year on year
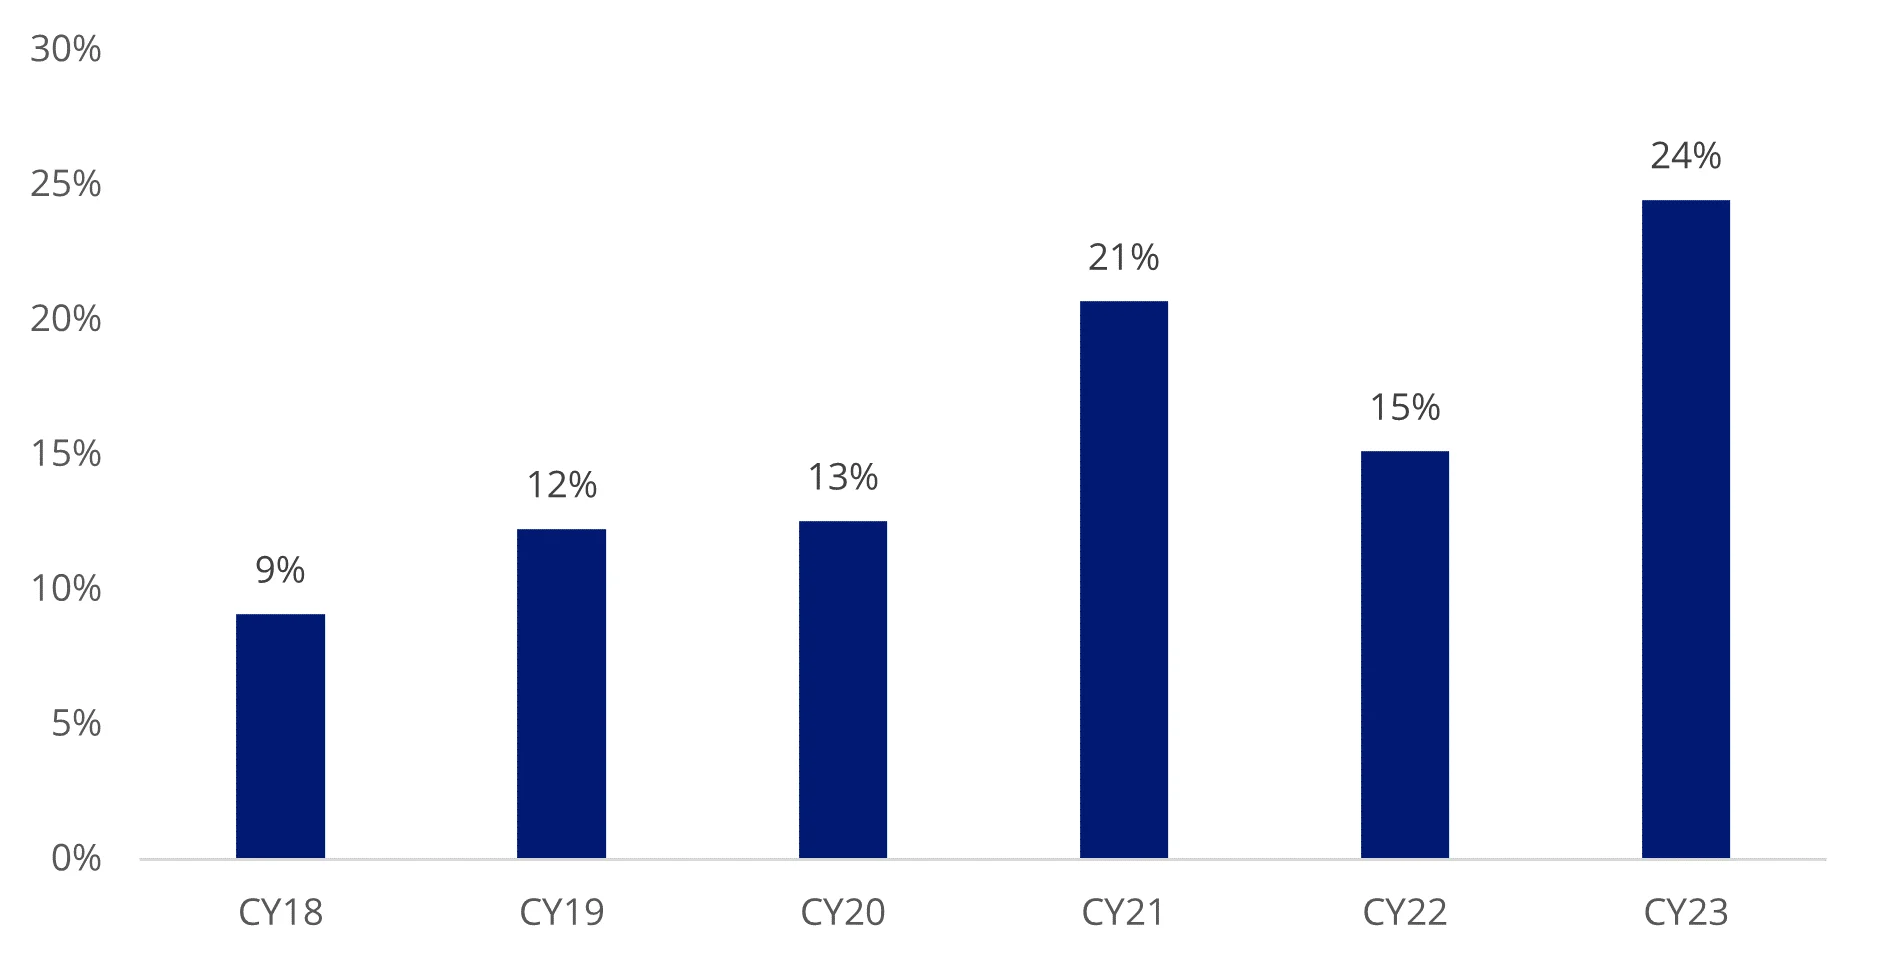
Source: Goodman Group
GMG’s soaring share price performance isn’t mirrored in its dividend yield. GMG operates differently to typical rent-collecting REITs by functioning primarily as a property developer and fund manager. This means GMG’s rents account for less than a quarter (23%) of its cashflows, and its current yield is only 0.86%.
This low dividend yield has flow-on effects on the benchmark index. As GMG constitutes 38% of the S&P/ASX200 A-REIT index (up from 25% a year ago), the benchmark dividend yields have trailed accordingly.
Access A-REITs with a single ASX trade
For those looking wanting to add or increase allocations to commercial real estate, the VanEck Australian Property ETF (MVA) offers exposure to a diversified portfolio of Australian REITs, featuring investments in retail, office, specialised and industrial real estate sectors.
By capping individual REITs in the ETF to a maximum 10%, MVA avoids over-exposure to dominant companies like GMG. This approach promotes a more diversified portfolio and has resulted in a higher dividend yield of 5.39%, compared to the S&P/ASX 200 A-REIT index’s yield of 3.71% (as at 30 June 2024). This is by no means indicative of future performance.
Chart 5: Comparison of MVA and ASX 200 A-REIT index dividend yields
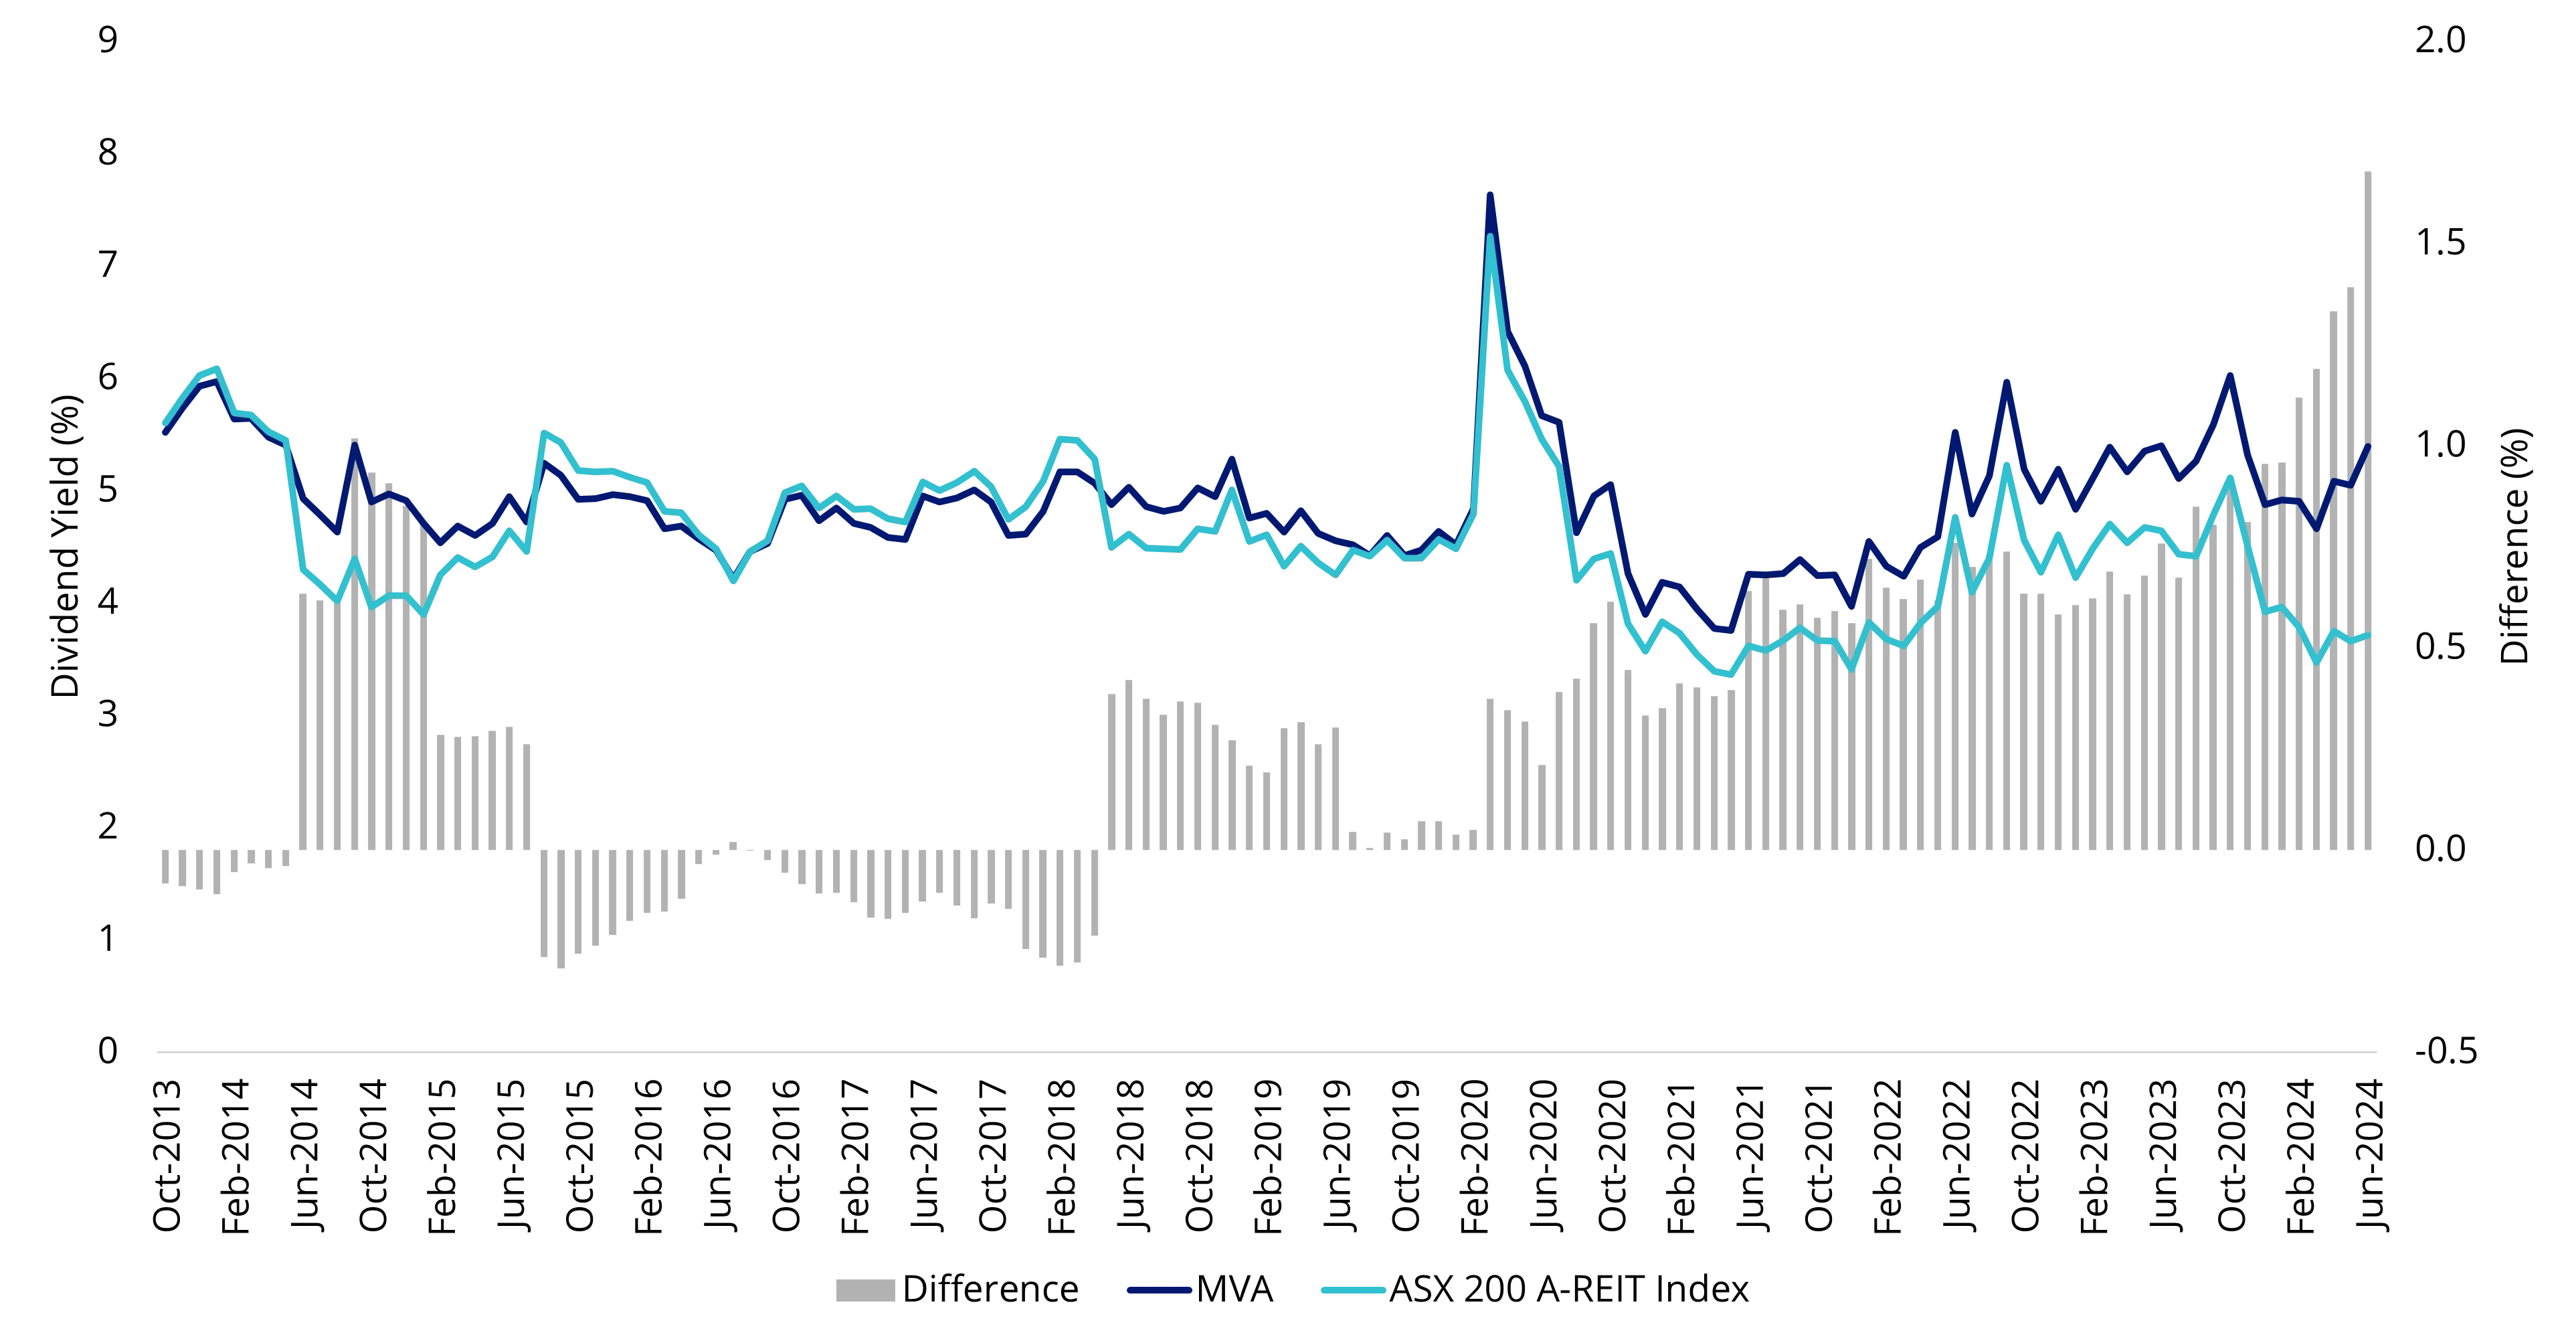
Source: FactSet, as at 30 June 2024. You cannot invest in an index. Past performance is not indicative of future performance.
Key risks
An investment in our Australian Property ETF carries risks associated with: financial markets generally, individual company management, industry sectors, stock and sector concentration, fund operations and tracking an index. See the VanEck Australian Property ETF PDS and TMD for more details.
Related Insights


Published: 30 July 2024
Any views expressed are opinions of the author at the time of writing and is not a recommendation to act.
VanEck Investments Limited (ACN 146 596 116 AFSL 416755) (VanEck) is the issuer and responsible entity of all VanEck exchange traded funds (Funds) trading on the ASX. This information is general in nature and not personal advice, it does not take into account any person’s financial objectives, situation or needs. The product disclosure statement (PDS) and the target market determination (TMD) for all Funds are available at vaneck.com.au. You should consider whether or not an investment in any Fund is appropriate for you. Investments in a Fund involve risks associated with financial markets. These risks vary depending on a Fund’s investment objective. Refer to the applicable PDS and TMD for more details on risks. Investment returns and capital are not guaranteed.


